

Briefly: in our opinion, full (300% of the regular position size) speculative short positions in mining stocks are justified from the risk/reward point of view at the moment of publishing this Alert.
It’s never fun to watch the markets move in the “wrong” direction – meaning the opposite direction that would increase the value of one’s portfolio. However, paying too much attention to day-to-day price changes is (right after being overinvested and overleveraged) one of the key reasons due to which beginning investors don’t get satisfactory results from their overall investment actions.
So, what should one do? As always – it is the outlook that determines the proper course of action, not the historical (because even if it’s just one day away, it’s still already “in the history”) performance of any asset. And to better determine the outlook, one should focus on the big picture and put day-to-day price swings into proper context. Let’s do exactly that.
First of all, let’s recall, why we exited the previous long position and entered a short one in the first place. We didn’t do it because it was clear that the rally was over.
We did it because it was crystal-clear that the easy part of the rally was over, and because the multiple reasons pointing to a medium-term price decline in the precious metals sector remained intact.
Given both factors, closing a long position while opening a short one was justified from the risk to reward position in my view. Since it was only the easy part of the rally that was over, there was a risk that we’ll see another brief upswing before seeing another powerful decline.
Did anything that happened so far this week invalidate anything from the above? No. The points made in this week’s flagship Gold & Silver Trading Alert remain up-to-date.
Did gold, silver, or mining stocks rally above my previous target zones? No.
In yesterday’s analysis I wrote the following:
Now, today’s the FOMC statement day (+press conference), so we can expect more intraday volatility in the following hours. This could mean a move above yesterday’s highs, but such a move would not be likely to hold.
So, nothing really changed and nothing particularly unexpected happened. Let’s take a look at the charts for more details.
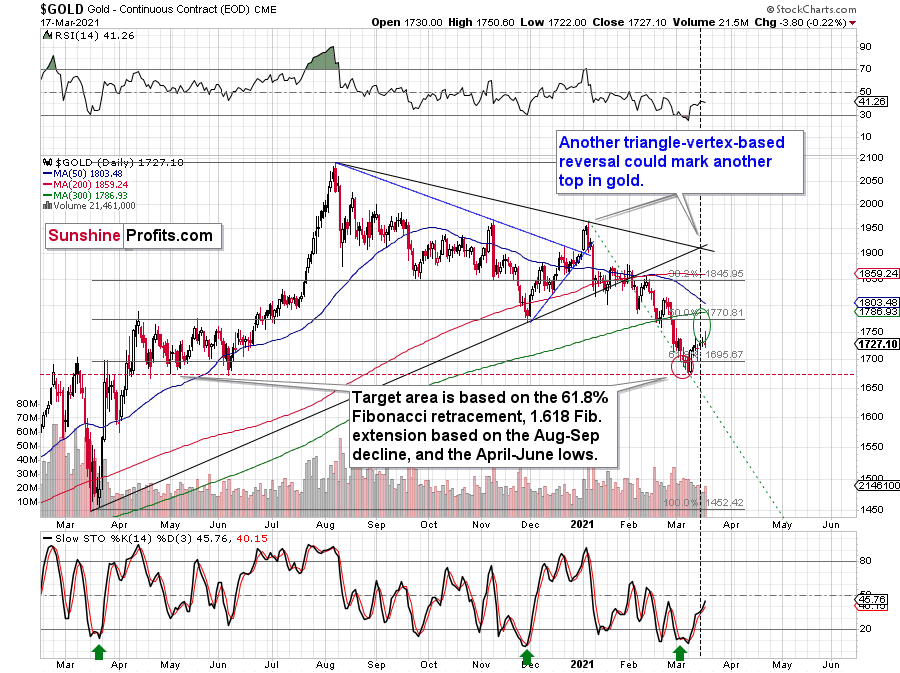
The upper border of gold’s upside target area is at about $1,770 and this week’s high in gold is (so far) $1,754. Consequently, gold didn’t break higher and it remains in a corrective mode.
Technically, the recent rally is nothing more than a small correction after the confirmed breakdown below the November 2020 lows.
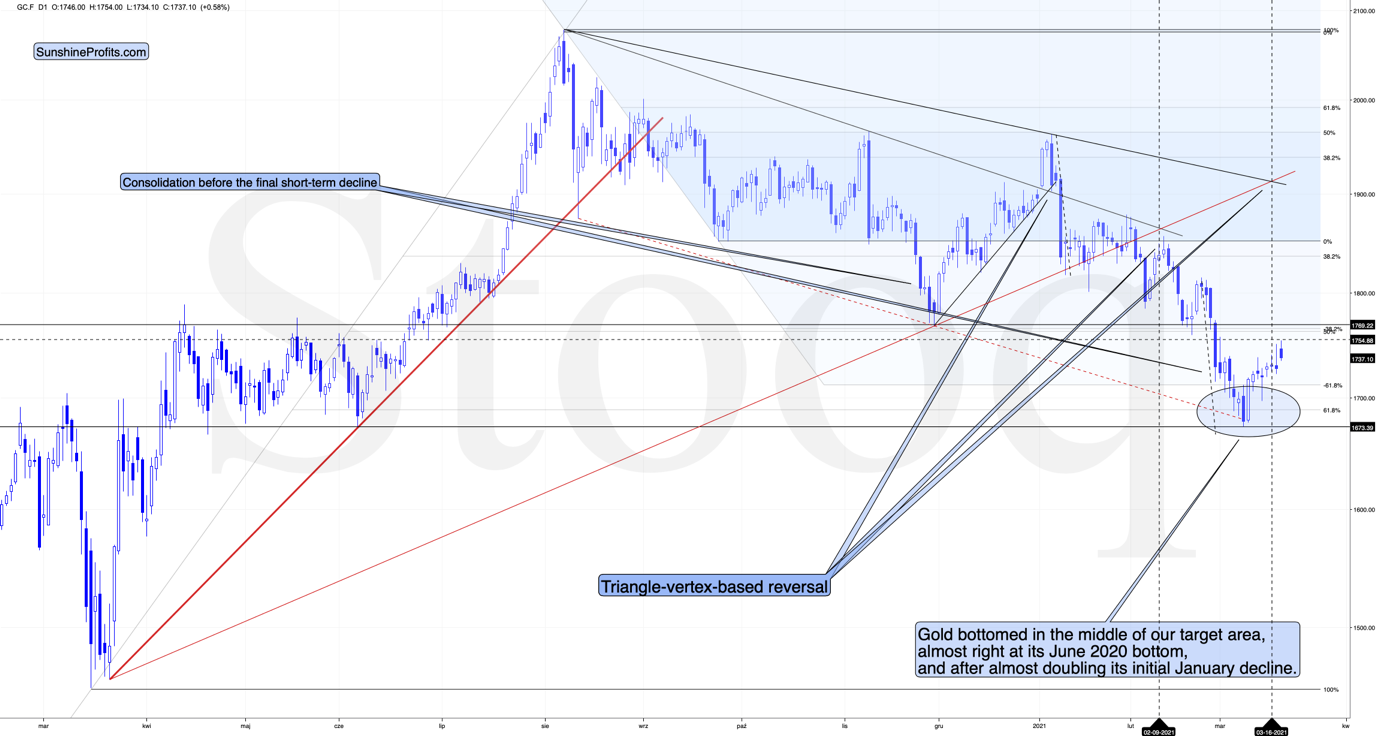
Gold is just after its triangle-vertex-based reversal, but since these points tend to work on a near-to basis, gold could reverse any day (or hour) now. Perhaps it already did – the 4-hour chart shows that gold just invalidated its breakout above the March 11 and March 3 highs.

A decisive move lower from here would mean that the March rally was actually a zigzag corrective pattern. Conversely, if gold rallies from here, a move to $1,770 would become likely. For now, the former scenario – a decline – seems more probable.
Mining stocks followed gold higher and they moved to the upper part of my previous target area, but not yet to its upper border. As you may recall, I mentioned the possibility of GDX moving to the $34 - $35 area and my original target for this rally was slightly below $34.
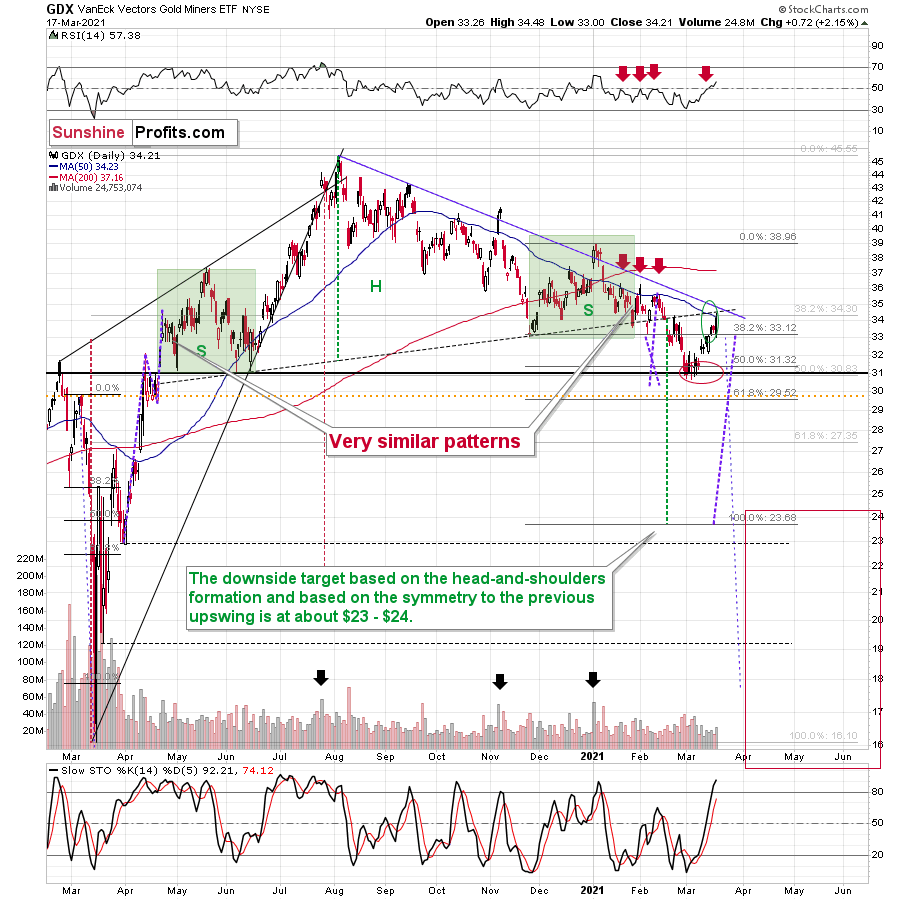
The GDX ETF now encountered the strongest combination of resistance areas, while the Stochastic indicator moved above the 80-level. Technically, the situation is now much more bearish in the GDX ETF chart than it was at the beginning of the year. Back in January, the GDX ETF was only at the declining blue resistance line.
Now, in addition to being very close to the above-mentioned line it’s also at:
- The neck level of the previously broken broad head and shoulders pattern
- The 50-day moving average
- The previous (late-February) highs.
Consequently, it’s highly likely that we’ve either just seen a top or one is close at hand.
Before moving to more fundamental issues, let’s take a look at the USD Index.
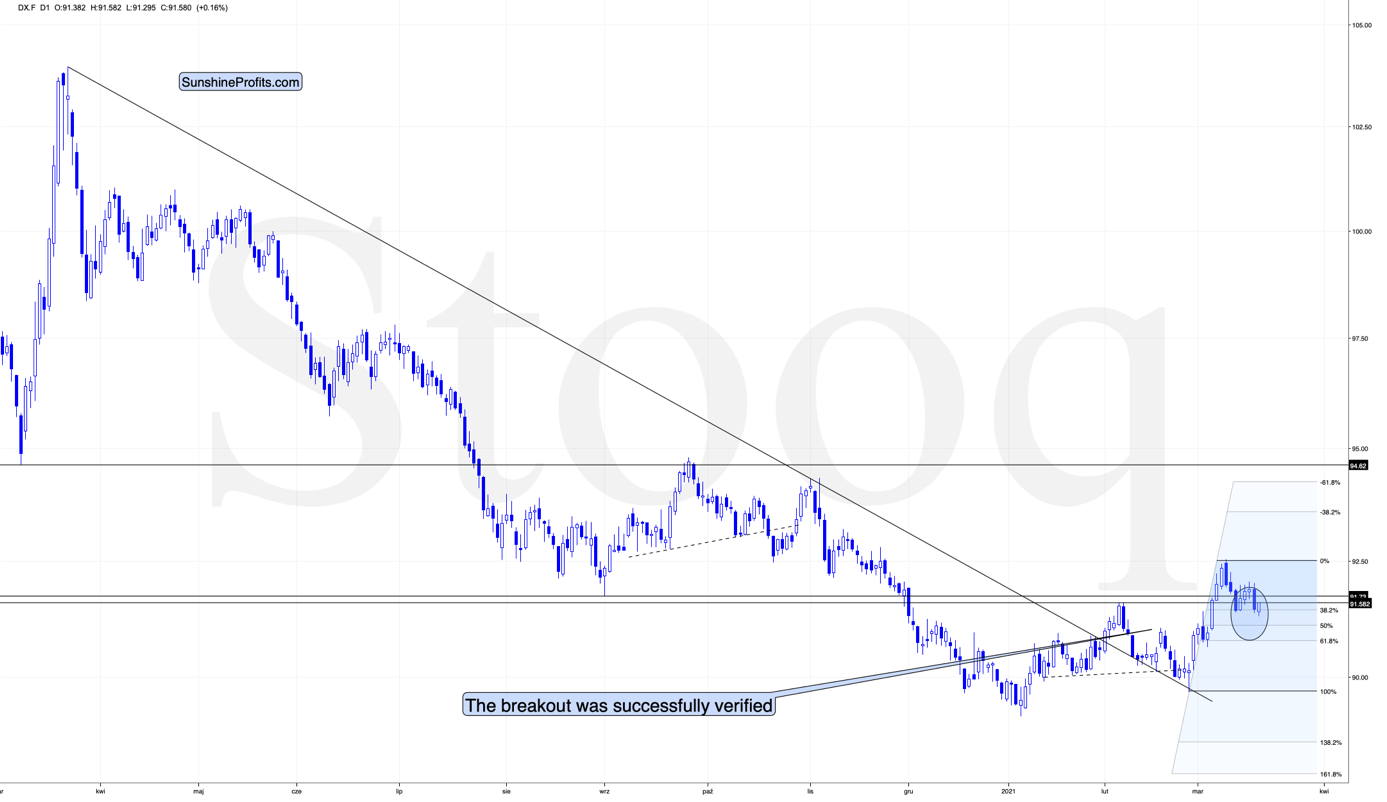
Exactly one week ago (March 11), I wrote the following on the above USD Index chart:
[I wrote that when the USD Index was at about 91.9 and gold was at about $1,733 as a response to a question whether a small move lower in the USDX could indeed trigger a ~40 rally in gold.]
So, can the bottom in the USD Index form at about 91.6 while gold rallies to ~$1,770. Of course.
One of the ways in which this could be done is for the USD Index to rally a bit here while gold ignores that and rallies anyway – which is what we already see taking place right now – and then when the USD Index declines to 91.6 or so, gold would rally even more. Gold is only $40 away from the above-mentioned upside target, so it won’t take much to get it there. For instance, we might see another $10 rally while the USD Index pauses, and then a $30 rally when the USDX finally declines, and bottoms.
Moreover, please note that the USD Index could move below 91.6 on an intraday basis and then rally back to it in terms of the daily closing prices. The previous 2021 high in terms of the closing prices was 91.52. So, actually, the USDX could decline to one of the Fibonacci retracements on an intraday basis before getting back up. The classic retracements based on the recent move higher are:
- 38.2% - 91.44
- 50% - 91.10
- 61.8% - 90.77
Also, based on the entire 2021 rally, the retracements would be:
- 38.2% - 91.25
- 50% - 90.85
- 61.8% - 90.45
Consequently, the USD Index could decline to one of those levels (more likely to 91.10 – 91.44 than to 90.45 – 90.85) and then rally back up on an intraday basis, and the analogy to how the situation developed in 2018 would still remain intact.
Combining both above details (gold’s temporary outperformance and the possibility for the USD Index to decline below 91.6 on a very temporary basis) suggests that the rally to $1,770 in gold, and the brief decline in the USD Index can indeed take place together.
In the following days, I added that the easy part of the rally was over, and based on some technical factors, it was no longer so likely that gold would indeed reach $1,770.
What actually transpired in the following days was that the USD Index indeed moved higher and then once again lower while gold exceeded the previous highs. It didn’t move to $1,770, though, but to $1,754 (at least so far). The USD Index bottomed (assuming that today’s overnight low was the final bottom for this decline) at ~91.3, which is more or less in the middle of the downside target area that I put in bold in the above quote.
After moving to ~91.3, the USD Index rallied back above its March 11 low, thus invalidating the breakdown below it.
Technically, it seems that we just saw a zigzag corrective pattern in the USD Index, which is one of the most common shapes that a correction could take. Consequently, it seems that the rally might continue now.
Having said that, let’s take a look at the market from a more fundamental angle.
Abracadabra
Pulling another rabbit out of his hat, at 2 p.m. ET, Jerome Powell, Chairman of the U.S. Federal Reserve (FED), made the PMs’ short-term problems disappear.
Please see below:
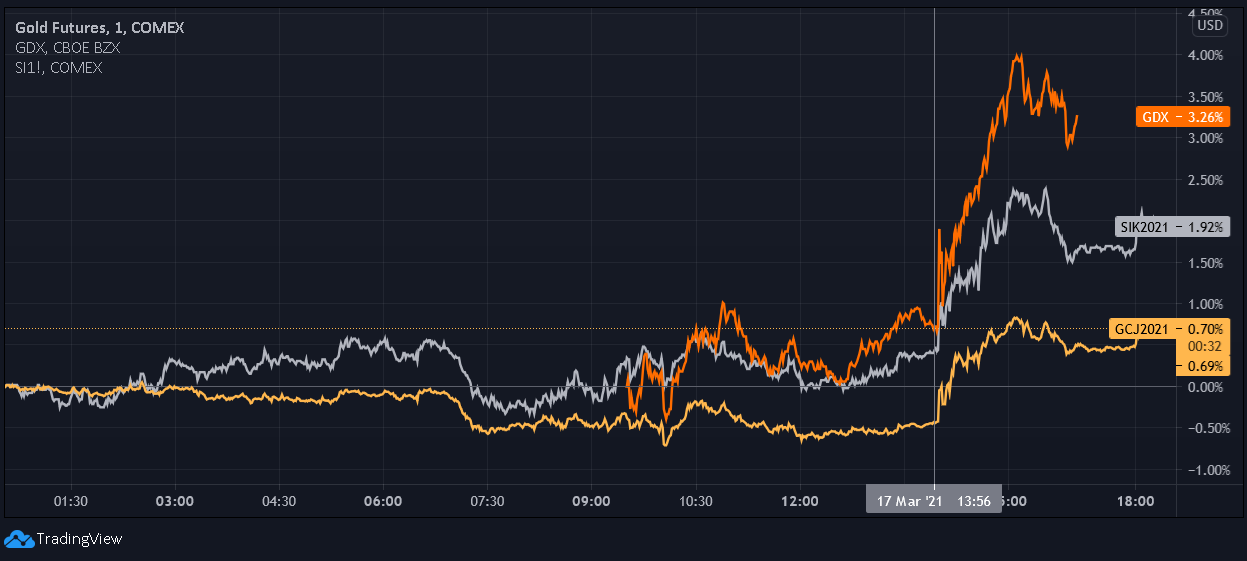
I warned on Mar. 17 that the PMs could receive a major boost if he strikes the right tone. And delivering a magical performance, Powell’s presence did just that. Remember though: despite his ability to talk down the USD Index and suppress U.S. Treasury yields, the medium-term ramifications will likely be unkind.
Over the last few months, Powell was adamant that he didn’t see any “unwelcome inflation.” However, on Mar. 17, the FED Chair slightly changed his tone.
Please see below:
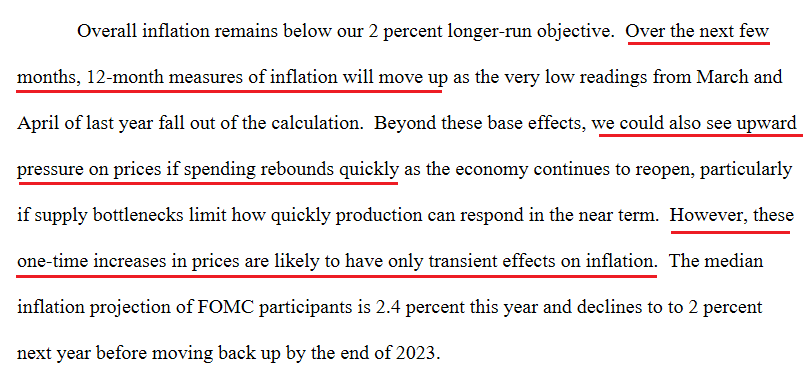 Source: U.S. FED
On Mar. 4, I wrote that Powell’s deny-and-suppress strategy is seemingly evolving into acknowledge-and-deflect. Thus, not wanting to deny the obvious, Powell finally admitted that inflation “could” be an issue.
More importantly though, his assertions of “one-time” and “transient” are the most newsworthy. Think about it: when inflation was visible, Powell said that it was non-existent. Now that inflation is screaming, he describes it as “transient.”
Behind the curve?
Remember, Powell didn’t major in inflationary honesty: he earns his diploma by maintaining a halcyon environment across fixed income and equity markets. Case in point: when asked to define an “overshoot” of the FED’s inflation target, he responded, “we have resisted the temptation to try and quantify what that means, but when we are above target … we can do that.”
Translation? He’ll let us know.
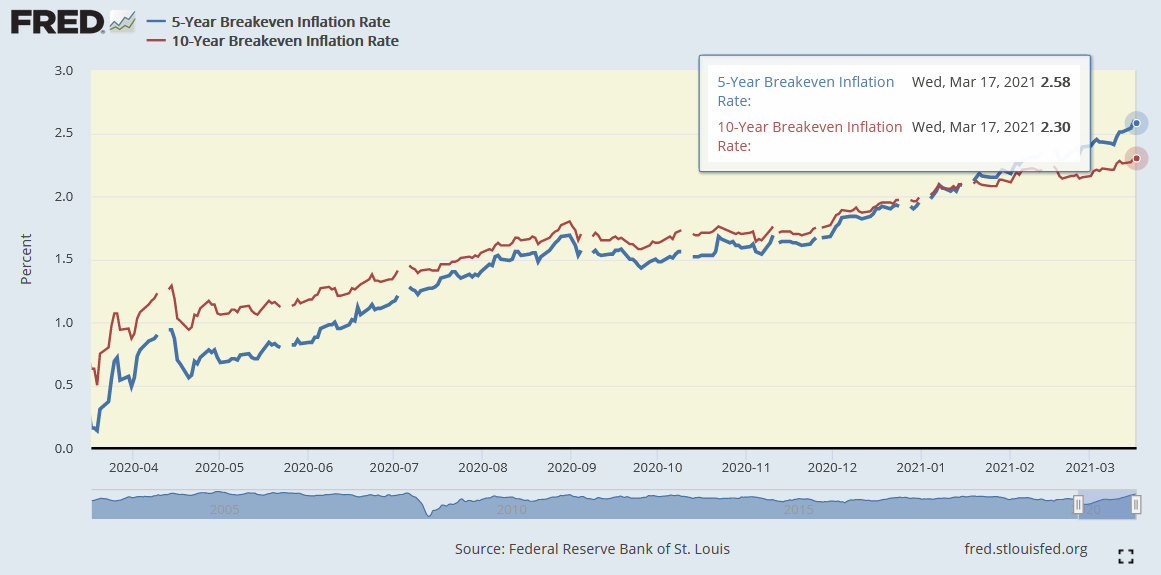
Ironically, he also said that "we want inflation expectations at 2%."
Well, if you analyze the chart below, you can see that U.S. 5-Year and 10-Year inflation expectations are well above 2%.
However, in an effort to thread the needle, Powell told reporters: “with regard to interest rates, we continue to expect it will be appropriate to maintain the current 0 to .25% target range until labor market conditions have reached levels consistent with the committee’s assessment of maximum employment and inflation has risen to 2% and is on track to moderately exceed 2% for some time. I would note that a transitory rise in inflation above 2%, as seems likely to occur this year, would not meet this standard.”
Thus, moving from no “unwelcome inflation” to above 2% is “likely to occur this year,” bond investors aren’t the only ones raising their eyebrows. Within the FOMC’s latest dot plot, four out of 18 FOMC members now expect a rate hike by 2022 (up from one during the December meeting).
Please see below:
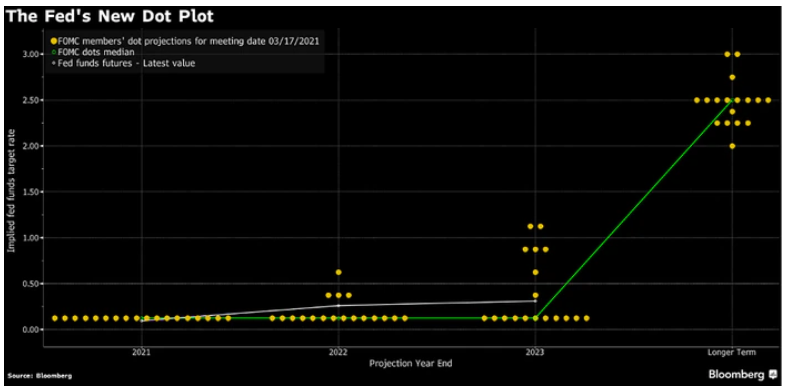
To explain, the yellow dots above represent FOMC members’ projections for the federal funds rate (the short-term overnight lending rate). If you analyze the four dots in the middle of the chart (2022), you can see that FED officials are slowly moving up their rate-hike expectations.
As a result, while Powell is quite successful at pacifying financial markets, the fundamentals remain the same. In the short-term, markets rally on what they hope to achieve. Over the medium-to-long-term, reality reveals what has actually been achieved.
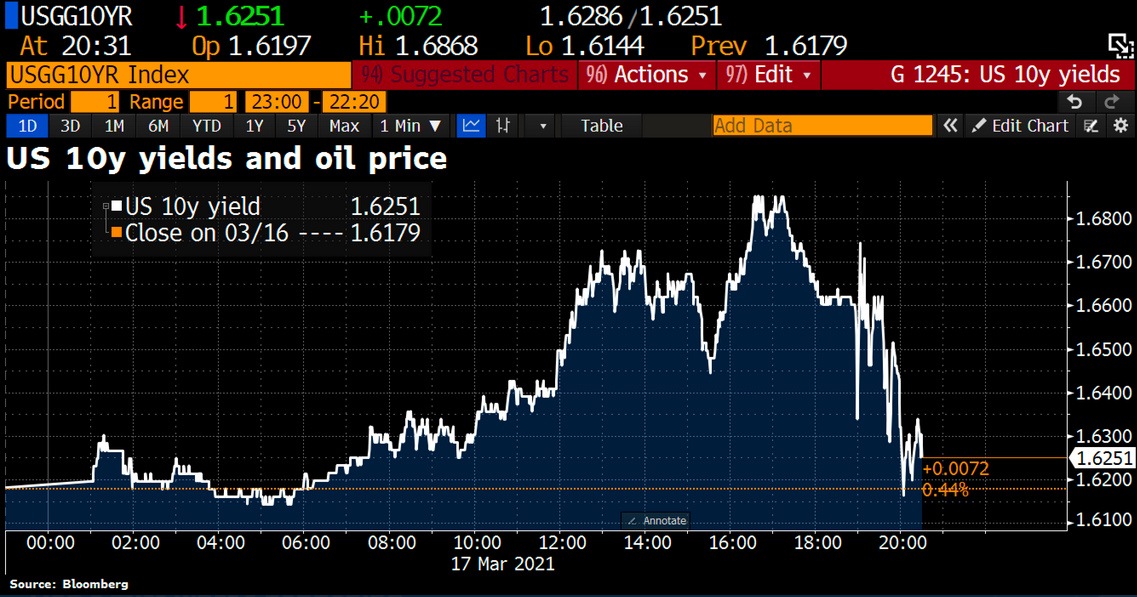
Case in point: immediately following Powell’s performance, the U.S. 10-Year Treasury yield plunged.
Conversely, the EUR/USD surged (sinking the USD Index in the process).
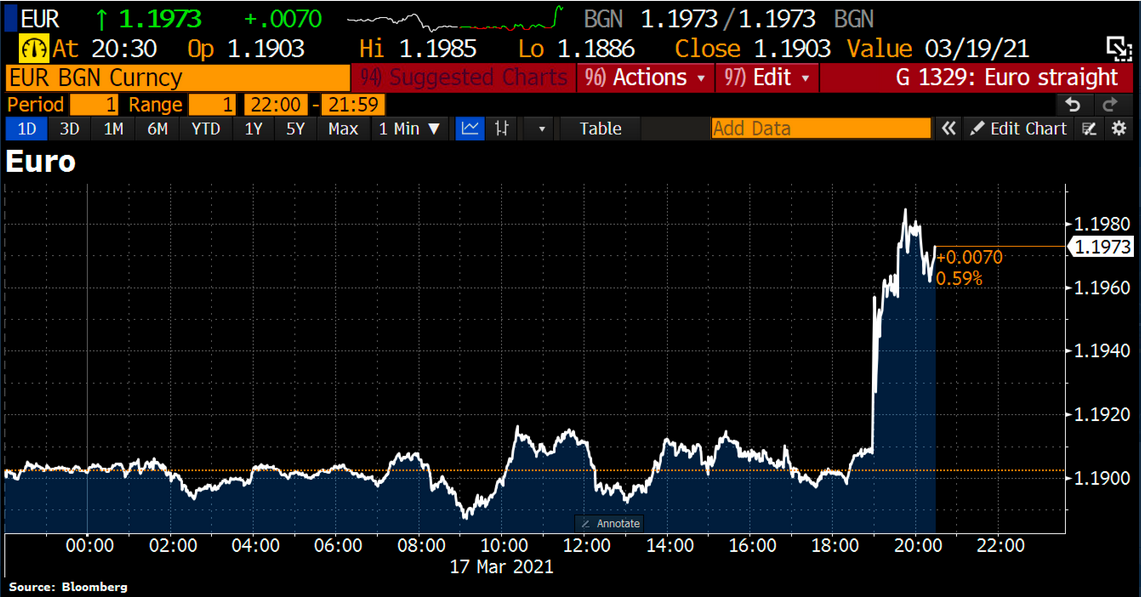
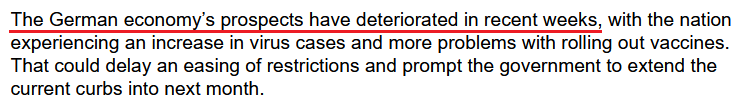
However, while sentiment moves markets, the economic reality is much different on the ground. Case in point: as the EUR/USD enjoyed a 0.66% rally on Mar. 17, German Chancellor Angela Merkel’s economic advisers reduced their 2021 GDP growth forecast from 3.7% to 3.1%. For context, Germany is Europe’s largest economy and the original projection (3.7%) – made only four and a half months ago – is now below economists’ consensus estimate.
Please see below:
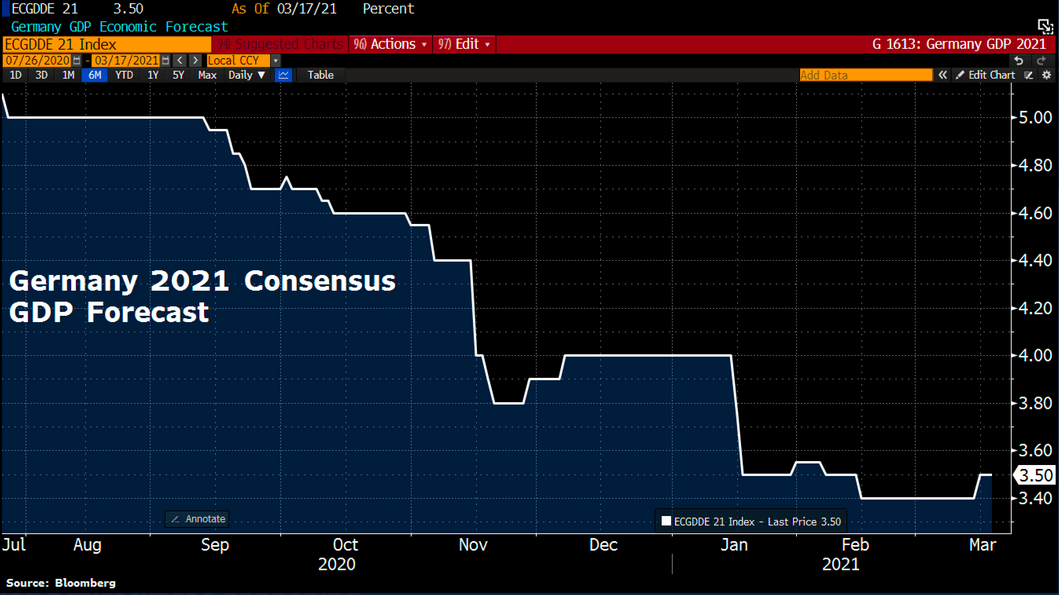
In addition, while Bundesbank President Jens Weidmann called Germany “sufficiently resilient” and implied that a recovery would “arguably only be postponed,” hope remains investors’ favorite therapy. In reality though, Europe’s fundamental underperformance of the U.S. is one of the worst-kept secrets.
 Source: Bloomberg
Contrasting Germany’s downgrade, the FOMC actually increased its 2021 U.S. GDP growth forecast from 4.2% (which it made in December) to 6.5% (the red box below). Furthermore, the U.S. unemployment rate is expected to fall to 4.5% (versus a December forecast of 5.0%).
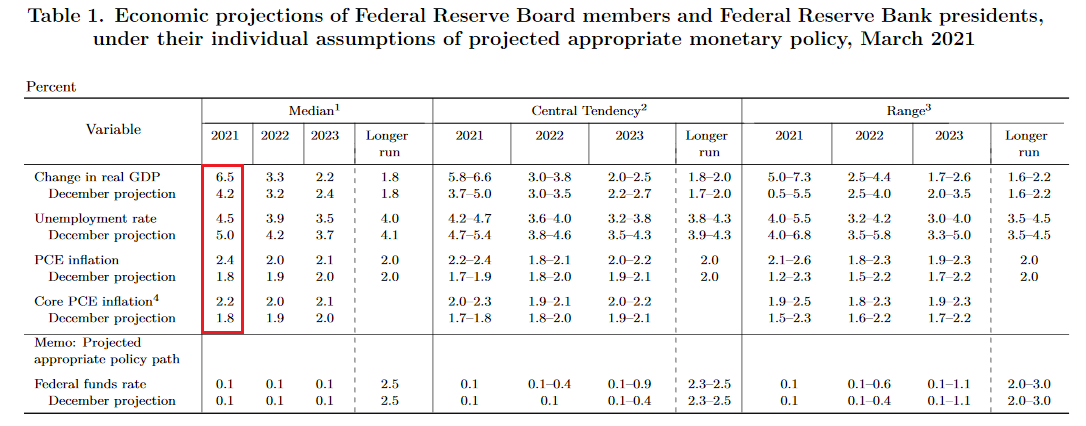 Source: U.S. FED
Thus, when U.S. economic outperformance of Europe is increasing, why is the EUR/USD rallying? And if FOMC members are increasing their rate-hike expectations, why are the U.S. 5-Year and 7-Year Treasury yields falling?
Well, as I mentioned above, in the short term (and especially very short term), investors create their own reality.
Keep in mind though: a few choice words and a reinforced narrative doesn’t solve Powell’s fundamental quandary. With breakeven inflation rates failing to follow nominal yields lower, the FED Chair remains stuck in a medium-term inflation trap. Moreover, with the EUR/USD bought on hope and sold on reality, the USD Index should reap the benefits over the medium-term.
In fact, the quick Powell-induced decline in the 10-year yields might already be over. One of the previous charts showed that the yields declined substantially initially, they still ended the day higher.
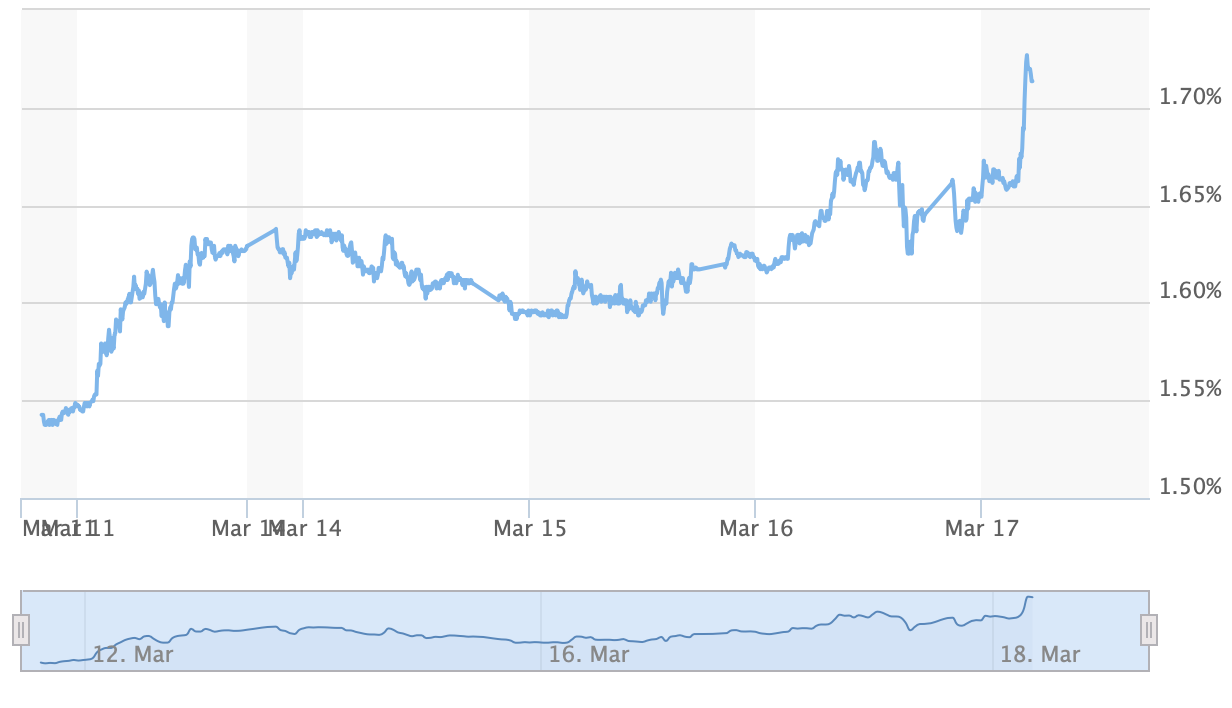
Source: Marketwatch
Just as the move lower in yields was temporary, the move lower in the USD Index and the rally in the precious metals sector might be (has been?) very short-lived.
In conclusion, the PMs received a short-term boost on Mar. 17, but their fundamental ills have yet to be cured. The USD Index’s negativity was mind over matter, and despite the volatility, the U.S. 10-Year Treasury yield actually ended the day up by 0.62%. As a result, the medium-term outlook for the PMs remains profoundly bearish. To reiterate what I wrote yesterday: a Powell-induced pause, followed by a continuation of the theme, will likely haunt the PMs over the medium-term.
Overview of the Upcoming Part of the Decline
- It seems to me that we are already after the initial bottom and the initial correction. If not, then it seems likely to me that the corrective upswing will be completed within a week. It’s more likely that the next big move lower is already underway, though.
- After miners slide once again in a meaningful and volatile way, but silver doesn’t (and it just declines moderately), I plan to switch from short positions in miners to short positions in silver (this could take another 1-2 weeks to materialize). I plan to exit those short positions when gold shows substantial strength relative to the USD Index, while the latter is still rallying. This might take place with gold close to $1,450 - $1,500 and the entire decline (from above $1,700 to about $1,475) would be likely to take place within 1-12 weeks and I would expect silver to fall hardest in the final part of the move. This moment (when gold performs very strongly against the rallying USD and miners are strong relative to gold – after gold has already declined substantially) is likely to be the best entry point for long-term investments in my view. This might happen with gold close to $1,475, but it’s too early to say with certainty at this time. In other words, the entire decline could take between 1 and 12 weeks, while silver declines particularly fast in the final 1-2 weeks.
- If gold declines even below $1,500 (say, to ~$1350 or so), then it could take another 10 weeks or so for it to bottom, but this is not what I view as a very likely outcome.
- As a confirmation for the above, I will use the (upcoming or perhaps we have already seen it?) top in the general stock market as the starting point for the three-month countdown. The reason is that after the 1929 top, gold miners declined for about three months after the general stock market started to slide. We also saw some confirmations of this theory based on the analogy to 2008. All in all, the precious metals sector would be likely to bottom about three months after the general stock market tops . If the mid-February 2020 top was the final medium-term top, then it seems that we might expect the precious metals sector to bottom in mid-May or close to May’s end.
- The above is based on the information available today and it might change in the following days/weeks.
Letters to the Editor
Q: I am enjoying your guidance very much, thank you. In your analyses I have read how it would be better to short the GDXJ, and not use the JDST because of the time decay of leveraged ETFs.
If a person decides to short in this case, they lose leverage, unless they short a leveraged ETF. So, this is something I haven’t seen your comments on. If I short NUGT, I see three advantages.
1) I’m shorting, thereby avoiding the time decay.
2)I gain leverage by using a 2x ETF,
3) I’m guessing here, but if there is time decay in this trade, doesn't the time decay now work in my favor?
Looking forward to hearing how I’m wrong about this. Your sharp mind and words can straighten this out for me. Again, Thank you!
A: Thank you for the kind words. In many cases, shorting JNUG (or NUGT) would indeed be a nice compromise between leverage and the ability to stay in a given position, even if the market does nothing for prolonged periods.
However, since there’s no free lunch in general, let’s consider what one would be resigning from or in what way would one be paying for this. There are two factors here:
- While the time decay now works in one’s favor, the possible loss on the trade is theoretically unlimited. In case of the unleveraged positions, that also applies, but in case of leveraged positions this is becoming increasingly more important.
- The leverage is not as big as it seems in this case. The 2x leverage works on a day-to day-basis, not based on the entire move.
Here’s what it means in practice:
If the GDXJ moves from $48.74 to $24.12 over the next 40 trading days and it declines by the same % each day, it would imply a decline by about 1.74327% each day. This means that – given the 2x leverage – JNUG would decline by about 3.48655% each day, and JDST would rally by about 3.48655% each day – for these 40 trading days.
Now, since on each day it would move by a certain percentage of its previous days price, it means that the situation is not as symmetrical as it may seem.
Yesterday’s closing prices for JNUG and JDST were $92.83 and $10.63, respectively.
So, by rallying 3.48655% each day for 40 trading days, starting at $10.63, JDST would be likely to increase to about $10.63 x (1+0.0348655)^40 = $41.87
However, by declining 3.48655% each day for 40 trading days, starting at $92.83, JNUG would be likely to decline to about $92.83 x (1-0.0348655)^40 = $22.45.
Buying JDST at $10.63 and selling it at $41.87 means more or less quadrupling one’s capital dedicated to this trade (profit of about 294%).
Shorting JNUG at $92.83 and covering the short position at $22.45, means a profit of less than 100% (about 76%).
So, the former approach would have yielded almost 4x as good results.
Now, what would happen if one was on the wrong side of the market for an identical move? Well, if – given the same scenario – one shorted JDST / went long JNUG, one would either lose 294% of the initial position (assuming that they would be increasing the deposit necessary for shorting in order to prevent the position from being closed), or “only” 76%.
I’m quite sure that after considering the above simulation the idea of shorting leveraged products no longer seems so attractive to many people. But am I saying that one should never do it? No – I’m just saying that one needs to know exactly what they are getting themselves into. There are myriads of strategies in financial engineering, but there’s never any free lunch. And if there is, it’s being exploited too quickly by various algorithmic trades that individual investors won’t be able to really reap any meaningful profits from it.
I’d say that if one is expecting a bigger move to happen relatively soon, then regular long positions (either leveraged or not, depending on one’s preference) would be preferred, but if one thinks that a given move is very likely to take place but it’s not clear when that would take place and if we would see some sideways trading for weeks or months before, then shorting leveraged instruments might be worth considering, while keeping the position sizing principles in mind. In general, it’s best to consider such strategies only after one gets more experience in the markets – I definitely don’t recommend that to everyone (or most people).
Q: I’m not sure if you are tracking this or not, but since the gold peak in August 2020, gold has dropped $3.15 per each one basis point increase in the 10-year yield. If this continues, and the Fed starts YCC at a 10-year yield of 2%, then the trough in the price of gold will be circa $1624. As such, $1350 - $1500 gold might just be a bridge too far.
A: That’s a very interesting observation, thank you. There are two things that I’d like to say here:
- The Fed might not start the YCC program (Operation Twist 3.0) for longer, if stocks don’t plunge profoundly. This would confirm my previous points, when I was writing that I expect PMs and stocks to decline together during the first part of stocks’ decline (exactly what happened after the 1929 top and after the tech bubble burst). This might happen with yields closer to 3%. If that takes place, it would imply – based on your calculations – a bottom about $315 lower than $1,624, meaning at about $1,309.
- Your calculations are based on average movement, and my targets are based on the extremes that gold might reach during the emotional slide. Gold and yields go together, but it’s not a perfect alignment. For instance, right now, the yields just moved to new yearly highs, while gold didn’t, because it had previously declined too much too quickly, and it had to correct. In the final part of its decline, gold would be likely to get ahead of itself too and decline more than “it should”.
In my view, based on any of those reasons, gold could bottom close to $1,500, and based on some (even partial) combination of both, it could temporarily move even lower.
Summary
To summarize, the PMs’ medium-term decline is well underway, and based on the recent performance of the USD Index, gold and mining stocks, it seems that the corrective upswing is already over (or about to be over). The next big move lower seems to be already underway or about to start.
In addition, because we’re likely entering the “winter” part of the Kondratiev cycle (just like in 1929 and then the 1930s), the outlook for the precious metals’ sector remains particularly bearish during the very first part of the cycle, when cash is king.
The confirmed breakout in the USD Index is yet another confirmation of the bearish outlook for the precious metals market.
After the sell-off (that takes gold to about $1,450 - $1,500), we expect the precious metals to rally significantly. The final part of the decline might take as little as 1-5 weeks, so it's important to stay alert to any changes.
Most importantly, please stay healthy and safe. We made a lot of money last March and it seems that we’re about to make much more on this March decline, but you have to be healthy to enjoy the results.
As always, we'll keep you - our subscribers - informed.
By the way, we’re currently providing you with a possibility to extend your subscription for a year, two years or even three years with a special 20% discount. This discount can be applied right away, without the need to wait for your next renewal – if you choose to secure your premium access and complete the payment upfront. The boring time in the PMs is definitely over and the time to pay close attention to the market is here. Naturally, it’s your capital, and the choice is up to you, but it seems that it might be a good idea to secure more premium access now, while saving 20% at the same time. Our support team will be happy to assist you in the above-described upgrade at preferential terms – if you’d like to proceed, please contact us..
To summarize:
Trading capital (supplementary part of the portfolio; our opinion): Full speculative short positions (300% of the full position) in mining stocks are justified from the risk to reward point of view with the following binding exit profit-take price levels:
Mining stocks (price levels for the GDXJ ETF): binding profit-take exit price: $24.12; stop-loss: none (the volatility is too big to justify a stop-loss order in case of this particular trade)
Alternatively, if one seeks leverage, we’re providing the binding profit-take levels for the JDST (2x leveraged) and GDXD (3x leveraged – which is not suggested for most traders/investors due to the significant leverage). The binding profit-take level for the JDST: $39.87; stop-loss for the JDST: none (the volatility is too big to justify a SL order in case of this particular trade); binding profit-take level for the GDXD: $94.87; stop-loss for the GDXD: none (the volatility is too big to justify a SL order in case of this particular trade).
For-your-information targets (our opinion; we continue to think that mining stocks are the preferred way of taking advantage of the upcoming price move, but if for whatever reason one wants / has to use silver or gold for this trade, we are providing the details anyway.):
Silver futures upside profit-take exit price: unclear at this time - initially, it might be a good idea to exit, when gold moves to $1,512.
Gold futures upside profit-take exit price: $1,512.
Long-term capital (core part of the portfolio; our opinion): No positions (in other words: cash
Insurance capital (core part of the portfolio; our opinion): Full position
Whether you already subscribed or not, we encourage you to find out how to make the most of our alerts and read our replies to the most common alert-and-gold-trading-related-questions.
Please note that we describe the situation for the day that the alert is posted in the trading section. In other words, if we are writing about a speculative position, it means that it is up-to-date on the day it was posted. We are also featuring the initial target prices to decide whether keeping a position on a given day is in tune with your approach (some moves are too small for medium-term traders, and some might appear too big for day-traders).
Additionally, you might want to read why our stop-loss orders are usually relatively far from the current price.
Please note that a full position doesn't mean using all of the capital for a given trade. You will find details on our thoughts on gold portfolio structuring in the Key Insights section on our website.
As a reminder - "initial target price" means exactly that - an "initial" one. It's not a price level at which we suggest closing positions. If this becomes the case (like it did in the previous trade), we will refer to these levels as levels of exit orders (exactly as we've done previously). Stop-loss levels, however, are naturally not "initial", but something that, in our opinion, might be entered as an order.
Since it is impossible to synchronize target prices and stop-loss levels for all the ETFs and ETNs with the main markets that we provide these levels for (gold, silver and mining stocks - the GDX ETF), the stop-loss levels and target prices for other ETNs and ETF (among other: UGL, GLL, AGQ, ZSL, NUGT, DUST, JNUG, JDST) are provided as supplementary, and not as "final". This means that if a stop-loss or a target level is reached for any of the "additional instruments" (GLL for instance), but not for the "main instrument" (gold in this case), we will view positions in both gold and GLL as still open and the stop-loss for GLL would have to be moved lower. On the other hand, if gold moves to a stop-loss level but GLL doesn't, then we will view both positions (in gold and GLL) as closed. In other words, since it's not possible to be 100% certain that each related instrument moves to a given level when the underlying instrument does, we can't provide levels that would be binding. The levels that we do provide are our best estimate of the levels that will correspond to the levels in the underlying assets, but it will be the underlying assets that one will need to focus on regarding the signs pointing to closing a given position or keeping it open. We might adjust the levels in the "additional instruments" without adjusting the levels in the "main instruments", which will simply mean that we have improved our estimation of these levels, not that we changed our outlook on the markets. We are already working on a tool that would update these levels daily for the most popular ETFs, ETNs and individual mining stocks.
Our preferred ways to invest in and to trade gold along with the reasoning can be found in the how to buy gold section. Furthermore, our preferred ETFs and ETNs can be found in our Gold & Silver ETF Ranking.
As a reminder, Gold & Silver Trading Alerts are posted before or on each trading day (we usually post them before the opening bell, but we don't promise doing that each day). If there's anything urgent, we will send you an additional small alert before posting the main one.
Thank you.
Przemyslaw Radomski, CFA
Founder, Editor-in-chief

