

Briefly: in our opinion, full (300% of the regular position size) speculative short positions in junior mining stocks are justified from the risk/reward point of view at the moment of publishing this Alert.
The year 2021 is over, 2022 has finally arrived. However, why does the current price action look “sooo last year”? Because the patterns appear to be repeating and the clearest similarity is present in the key precious metal – gold itself.
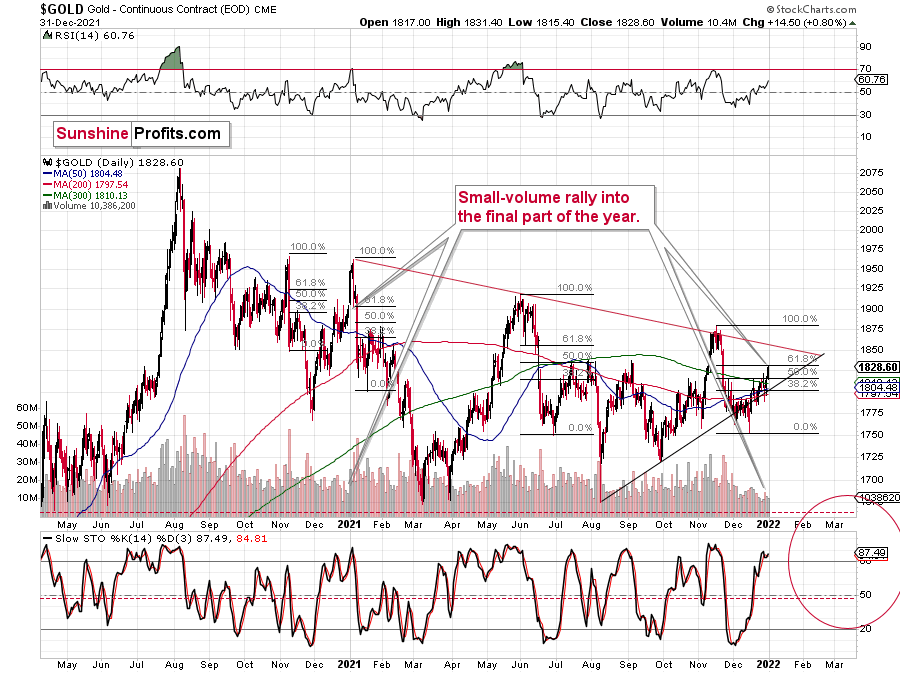
Gold prices moved higher in late December, and it happened on low volume. The rally caused the stochastic indicator to move above 80 and the RSI above 50. That’s exactly what happened in both: late 2021 and late 2020.
What does it mean? Well, it means that we shouldn’t trust this rally, as it could end abruptly, just like the one that we saw a year ago.
Besides, gold corrected 61.8% of the preceding decline (so it moved to its most classic Fibonacci retracement), which means that – technically – what we saw in the past two weeks was just a correction, not the beginning of a new rally.
Moving back to the similarity to what happened last year, let’s take a look at the mining stocks’ performance.
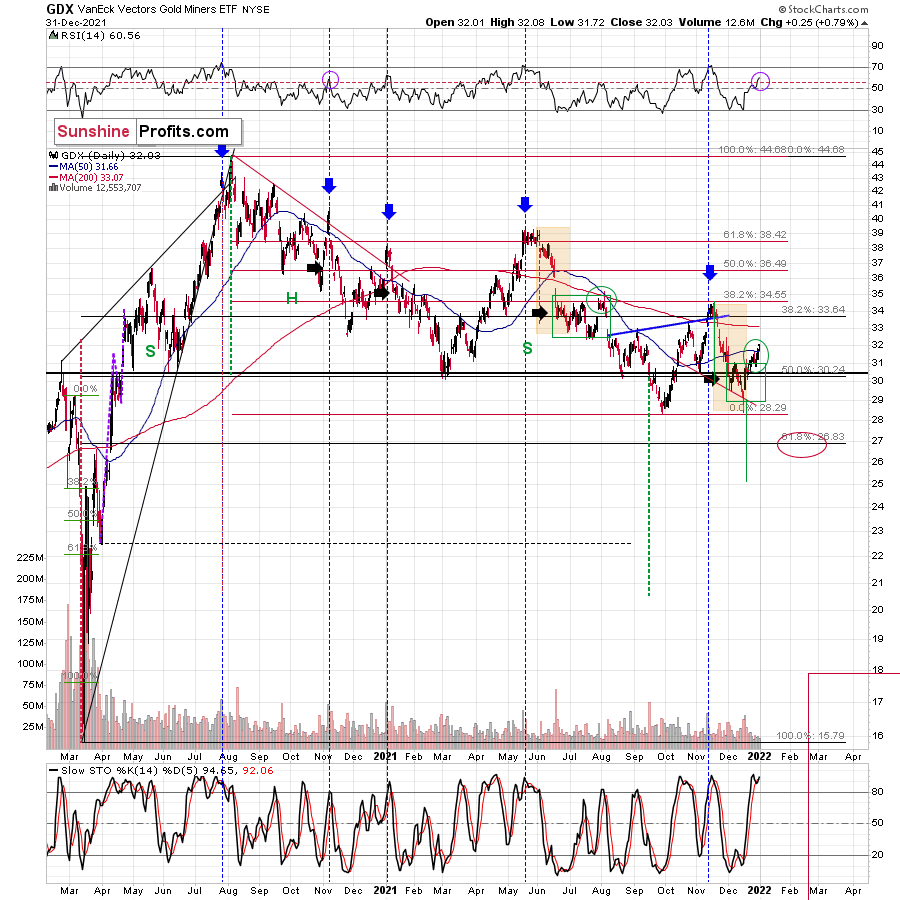
The price moves were more volatile last year, which is why it’s useful to look at the analogies from the indicators’ point of view. After all, indicators exist to make situations more comparable to each other and, thus, to be able to play the history-rhymes card more often.
The stochastic indicator is above 80, and the RSI is above 70. I marked the moves in the RSI with purple ellipses – they look alike.
Since declines followed soon in January 2021, it seems that we’re going to see something similar also this year.
Of course, the analogy to last January is not the most important one. What happened in 2013, 2008, and 2000 is much more important. In particular, the link between now and 2008 is interesting because of what’s happening in the stochastic indicator in the long-term HUI Index chart.

The moves in the indicator are similar, and I marked the specific tops with red and black arrows. In the current situation, we saw yet another small move up, but that’s most likely because the price moves are now less volatile. The areas marked with red ellipses remain similar and show back-and-forth movement before the big decline.
We are now in this back-and-forth trading movement period.
The implications are not bullish, but bearish.
Speaking of back-and-forth movement, let’s take a look at what’s been taking place in the USD Index recently.
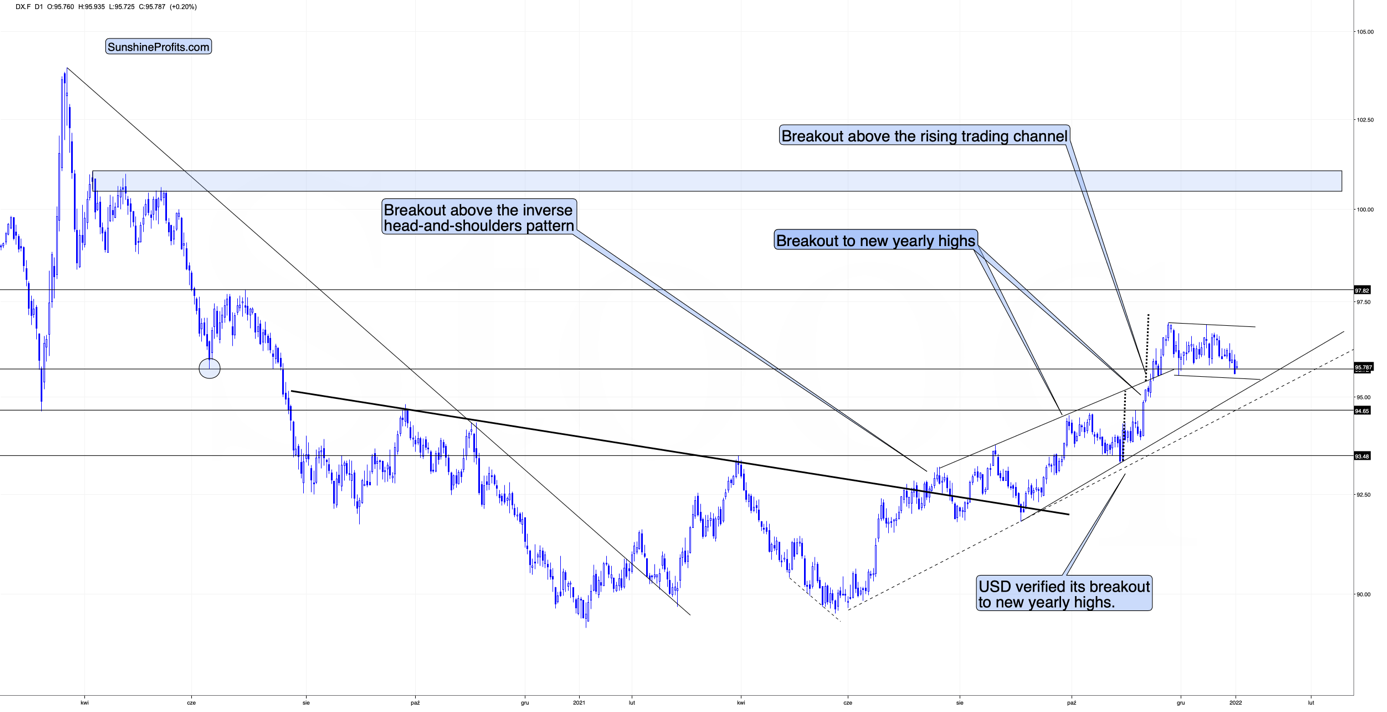
The USDX has been consolidating after rallying sharply in November 2021. This is quite normal, and we saw something similar after previous short-term rallies during the current medium-term rally.
By the way, do you remember when I told you how the USD Index was likely to rally in 2021, when everyone and their brother was bearish on it last year?
The July-September 2021 consolidation, as well as the smaller October consolidation, were also normal parts of the bigger upswing. However, why would I say that this is a consolidation and not a double top?
Because the consolidation takes place after the USD Index breaks clearly above the previous important lows. The March 2020 low and the June 2020 low can be examples. Consolidation has been taking place above the latter. In fact, it was even tested in late November, and it held. The recent move lower is simply another test – just like what we saw in June 2020.
Since consolidation has been taking place for some time now, it’s likely that the next move higher will be quite visible once again.
This means that the previous target of about 97.5 might have been too conservative. Instead, it seems more likely that the USD Index would rally to its previous resistance area close to its April and May 2020 highs. That’s approximately the 100-101 area.
Of course, such a rally in the USD Index would be bearish for precious metals prices.
Let’s take a look at the silver price outlook.
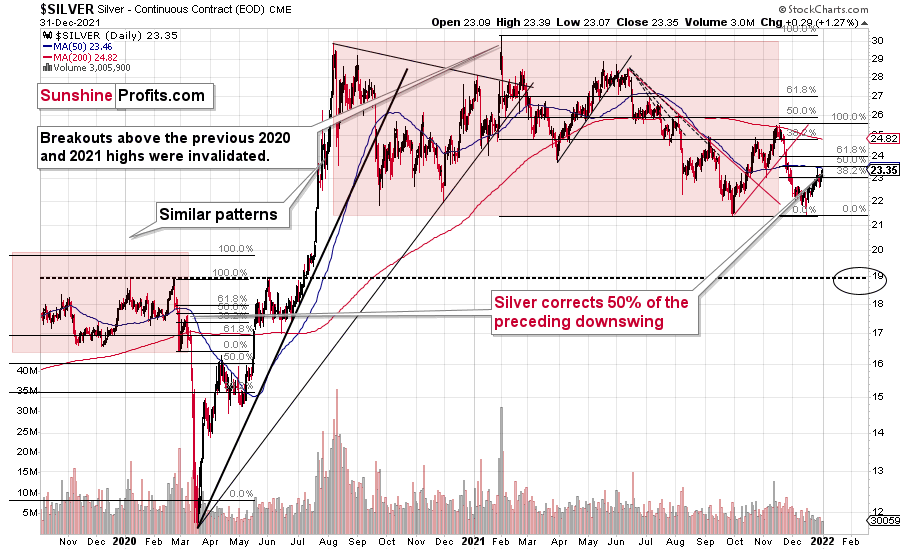
The white metal is not as strong as it was in late 2020 and early 2021, but it seems to be repeating a different pattern.
Namely, after the late-Feb. and early-Mar. 2020 slide (that took silver to its previous lows), silver corrected about half of its previous decline. The same thing happened recently.
Back then, silver topped close to its 50-day moving average, and that’s where the white metal moved recently as well.
Just because this pattern is similar price-wise, it doesn’t mean that it’s identical time-wise, and thus that silver is likely to drop as quickly as it did in 2020. Right now, the price moves are not as volatile, and the declines are unlikely to be AS volatile as they were in 2020 – at least not before the final part of the decline.
It seems that what took days in 2020, now takes weeks. This means that we might see a decline that’s so huge that it takes weeks or even months to complete, not just several days.
Having said that, let’s take a look at the markets from a more fundamental angle.
New Year, Same Problems
With 2021 now in the rearview, the GDXJ ETF (our short position) ended the year as one of the worst-performing financial assets. With the negative fundamental developments that upended its performance in 2021 poised to intensify in 2022, more downside will likely materialize before a long-term buying opportunity emerges.
To explain, the Omicron variant has dominated the headlines over the last several weeks. While media coverage often intensifies investors’ anxiety, the bond market has essentially given the all-clear. For example, renewed panic sank the U.S. 10-Year Treasury yield below 1.36% intraday on Dec. 20. However, after rallying into year-end, the Treasury benchmark ended 2021 at 1.52%.
Moreover, the jump cemented a 66% rise in 2021, and the fundamental impact of higher interest rates is like Kryptonite for the PMs. As a result, with more of the same poised to persist in 2022, the PMs are likely far from a long-term bottom.
Please see below:
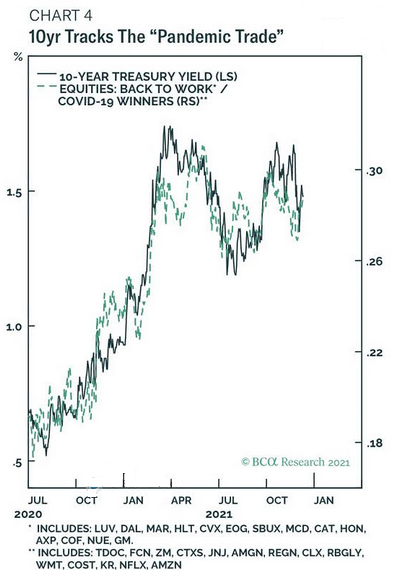
To explain, the dark blue line above tracks the U.S. 10-Year Treasury yield, while the light blue dashed line tracks the ratio of reopening stocks to stay-at-home stocks. For context, the reopening basket includes companies like Delta Air Lines, Marriott International, and Starbucks, while the stay-at-home basket includes companies like Zoom, Netflix, and Amazon.
If you analyze the relationship, you can see that outperformance by the reopening basket (the light blue dashed line rises) often coincides with a higher U.S. 10-Year Treasury yield. Thus, with peak negativity likely behind us, both metrics should increase as Omicron fears fade.
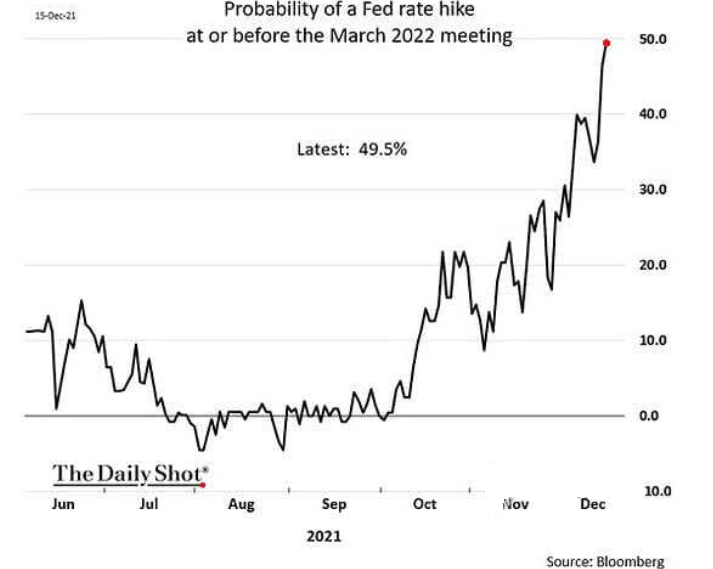
In addition, I noted on Dec. 21 that the Fed should turn up the hawkish temperature in 2022. And with market participants finally acknowledging the reality of non-transitory inflation, the death of QE should have a material impact on the PMs. I wrote:
The market-implied probability of a Fed rate hike by March 2022 has risen to nearly 50%. For context, in November, investors expected the Fed to raise rates in September 2022. Then, the expectation was pulled forward to July, June, and then May. And now, March is creeping up. Thus, while ~50% may seem immaterial, it’s hawkish within the context of where we were in November.
Please see below:
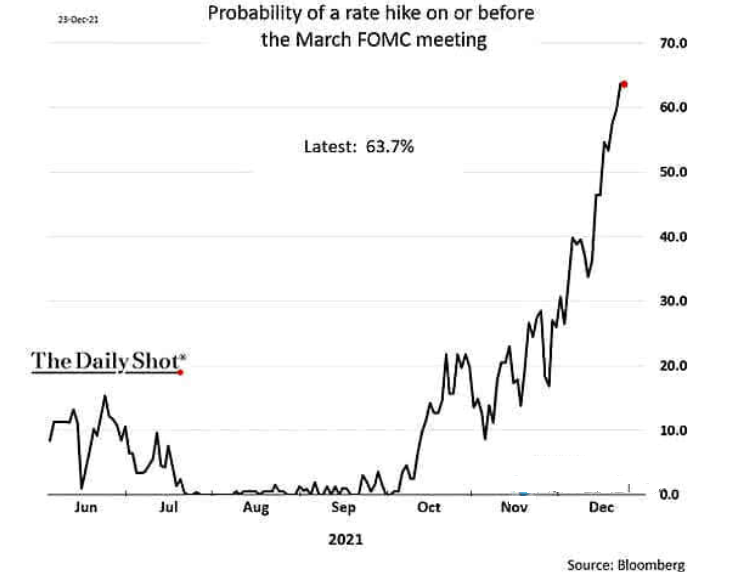
To that point, with investors ratcheting up their hawkish expectations in recent days, the market-implied probability of a Fed rate hike by March 2022 is now nearly 64%.
Please see below:
What’s more, while investors await the Fed’s hawkish hammer, Goldman Sachs believes that they’ll be surprised at how quickly the Fed has to move.
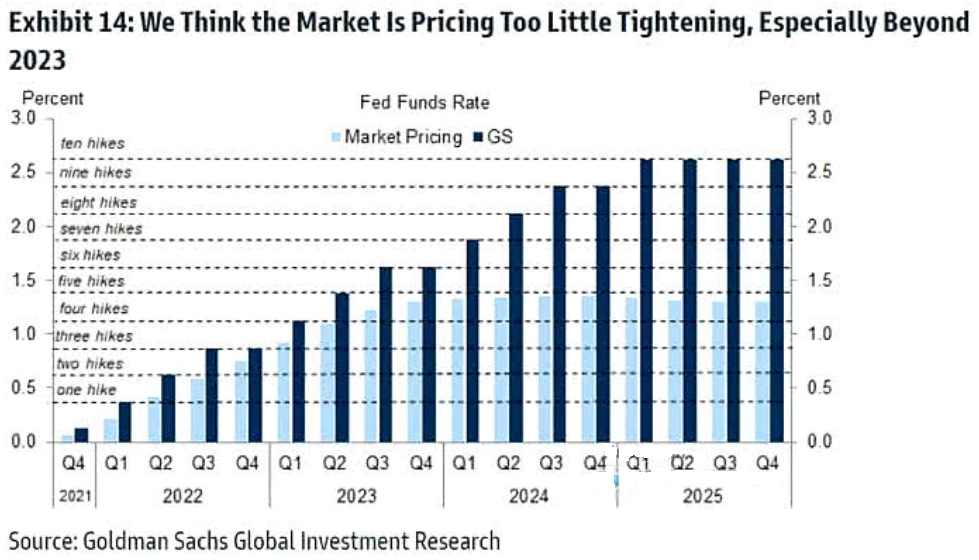
To explain, the light blue bars above track investors’ expectations for the U.S. Federal Funds Rate over the next four years, while the dark blue bars above track Goldman Sachs’ forecasts. If you analyze the Q3 label within the 2022 section, you can see that investors expect slightly less than two rate hikes by the Fed by the third quarter of 2022. Conversely, Goldman Sachs expects three rate hikes by the Fed by Q3 2021.
On top of that, the U.S. investment bank sees liftoff accelerating in 2023 and beyond. For example, Goldman Sachs expects six rate hikes by the Fed by Q3 2023, while market participants are positioned for slightly more than four. Moreover, the forecast increases to nine rate hikes by the Fed by Q3 2024, while market participants are positioned for slightly less than five. As a result, if investors’ expectations merge with Goldman Sachs’ projections, the PMs could suffer mightily amid the repositioning.
Furthermore, while inflation will likely show signs of deceleration in 2022, it’s important to remember that pricing pressures are nowhere near the Fed’s 2% annual target. As a result, all talk and no action won’t cut it in 2022. Since it’s a long way down from 6.9% to 2%, the Fed’s war on inflation will likely increase volatility across several asset classes in 2022.
To explain, the Dallas Fed released its Texas Manufacturing Outlook Survey on Dec. 27. While the headline index was fairly constant at 26.7 in December, inflationary pressures remained elevated. The report revealed:
“Prices and wages continued to increase strongly in December. The raw materials prices index remained highly elevated but dropped from its series high to 66.2. The finished goods prices index held steady at 42.3, far exceeding its historical average of 7.7. The wages and benefits index remained near its own series high, at 45.5.”
Moreover, please have a look at the comments made by survey respondents in the nonmetallic minerals and fabricated metals industries:
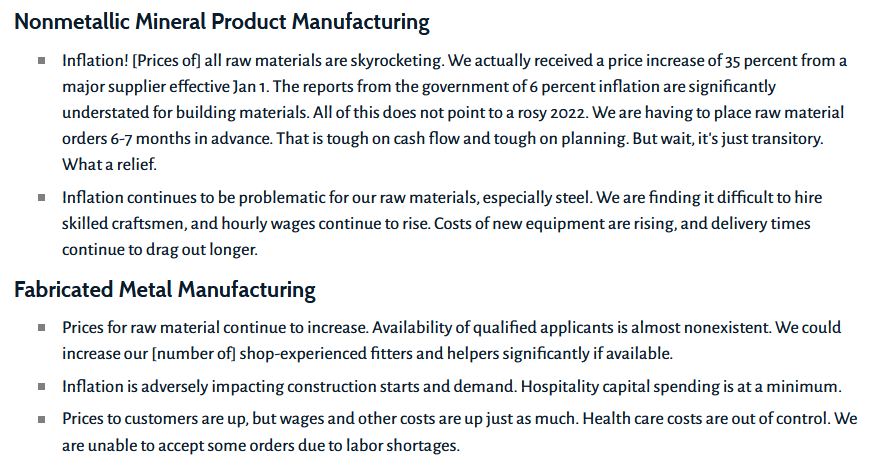 Source: Dallas Fed
Singing a similar tune, the Richmond Fed released its Fifth District Survey of Manufacturing Activity on Dec. 28. While the headline index increased from 12 in November to 16 in December, “the average growth rate of prices paid and prices received by survey participants increased” as well.
Please see below:
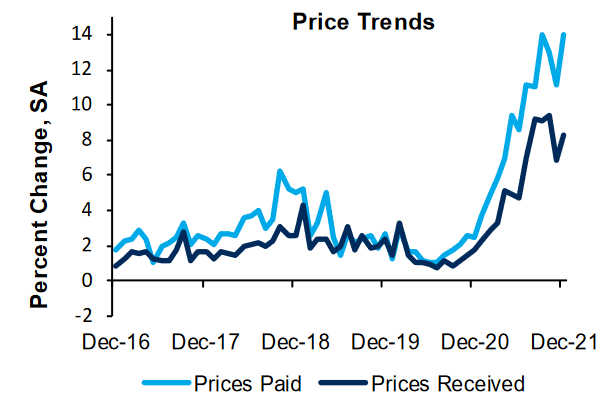 Source: Richmond Fed
Furthermore, the report revealed:
“More manufacturing firms reported increasing employment than decreasing in December.
Respondents continued to report difficulty finding workers with the necessary skills and
are expecting this difficulty to continue. Many firms increased wages in December and are
planning to keep increasing wages. Our expected wage index reached a record high of 74 in December.”
To that point, with the expected availability of skilled workers declining from -5 to -16 from October to December, while expected future wages increased from 70 to 74 during that same timeframe, employees' control over the labor market is extremely inflationary.
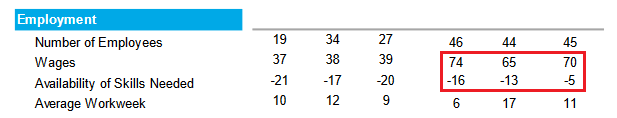 Source: Richmond Fed
Likewise, while the U.S. economy attempts to sidestep the Omicron variant, Morgan Stanley’s “US Cycle Indicator” shows that growth remains resilient.
Please see below:
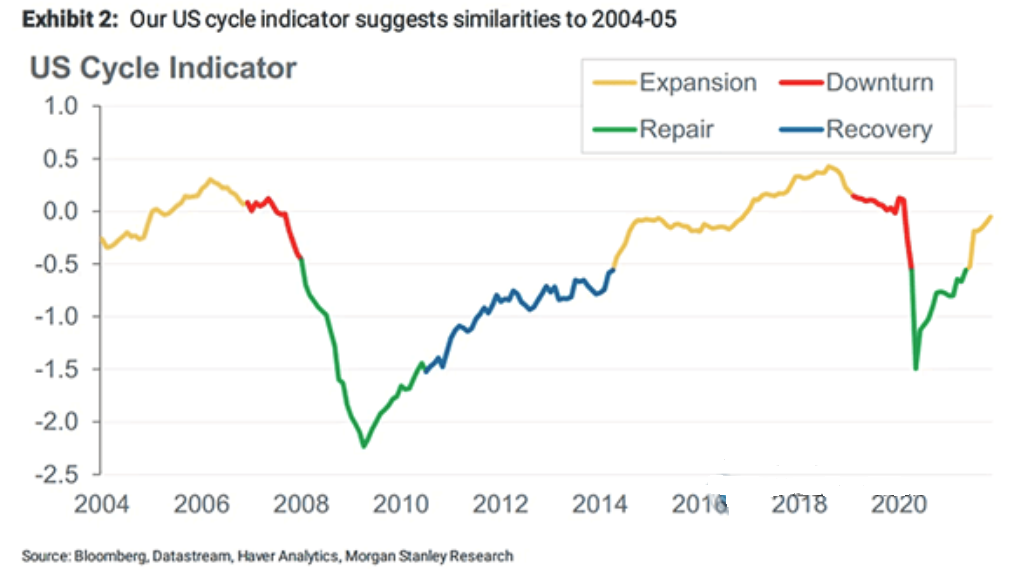
To explain, the yellow (expansion), red (downturn), green (repair), and blue (recovery) lines above track the health, or lack thereof, of the U.S. economy. If you analyze the right side of the chart, you can see that the yellow line signals that the U.S. economy is still expanding. As a result, the Fed has few reasons not to tighten monetary policy over the next few months.
Finally, while gold’s underperformance in 2021 may seem like a recipe for mean reversion in 2022, the reality is that precious metals aren’t all that cheap. Thus, more downside should materialize before bargain prices re-emerge once again.
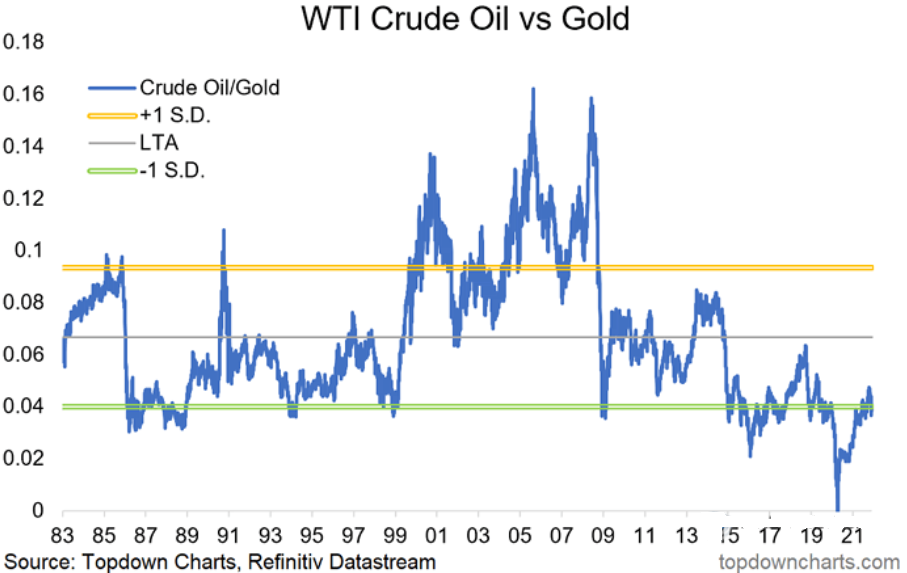
To explain, the blue line above tracks the crude oil/gold ratio, while the yellow/green horizontal lines represent one standard deviation above/below the average. For context, when the blue line rises, it means that crude is outperforming gold. Conversely, when the blue line falls, it means that gold is outperforming crude. In addition, the ratio’s 2020 plunge occurred when oil prices went negative.
However, if you analyze the right side of the chart, you can see that gold is still historically expensive relative to crude (excluding the 2020 drop). Moreover, with a stronger U.S. dollar and the Fed’s tightening cycles often deterrents to higher oil prices, the only way for the ratio to normalize is for gold prices to fall. In the absence of that, $100+ oil would have to materialize for the ratio to approach its long-term average.
The bottom line? With hawkish rhetoric in 2021 poised to morph into hawkish policy in 2022, the PMs confront a treacherous fundamental environment. While they may seem like bargains after their 2021 lull, interest rates have been depressed for so long that the PMs are essentially priced for perfection. As a result, there are several fundamental factors that could lead to more negativity in 2022.
In conclusion, while the PMs participated in the Santa Claus rally, their Christmas spirit will likely fade in the coming months. Moreover, with the USD Index and U.S. Treasury yields poised to continue their outperformance in 2022, the PMs will likely continue their underperformance. As a result, we still expect the GDXJ ETF to confront lower lows over the medium term.
Overview of the Upcoming Part of the Decline
- It seems to me that while the corrective upswing might still continue, it might not be significant in case of junior mining stocks. After the corrective upswing is over, I think that gold will decline once again taking silver and mining stocks lower as well.
- It seems that the first stop for gold will be close to its previous 2021 lows, slightly below $1,700. Then it will likely correct a bit, but it’s unclear if I want to exit or reverse the current short position based on that – it depends on the number and the nature of the bullish indications that we get at that time.
- After the above-mentioned correction, we’re likely to see a powerful slide, perhaps close to the 2020 low ($1,450 - $1,500).
- If we see a situation where miners slide in a meaningful and volatile way while silver doesn’t (it just declines moderately), I plan to – once again – switch from short positions in miners to short positions in silver. At this time, it’s too early to say at what price levels this could take place, and if we get this kind of opportunity at all – perhaps with gold close to $1,600.
- I plan to exit all remaining short positions once gold shows substantial strength relative to the USD Index while the latter is still rallying. This may be the case with gold close to $1,350 - $1,400. I expect silver to fall the hardest in the final part of the move. This moment (when gold performs very strongly against the rallying USD and miners are strong relative to gold after its substantial decline) is likely to be the best entry point for long-term investments, in my view. This can also happen with gold close to $1,375, but at the moment it’s too early to say with certainty. I expect the final bottom to take place near the end of the year, perhaps in mid-December. It is not set in stone that PMs have to bottom at that time. If not then, then early 2022 would become a likely time target.
- As a confirmation for the above, I will use the (upcoming or perhaps we have already seen it?) top in the general stock market as the starting point for the three-month countdown. The reason is that after the 1929 top, gold miners declined for about three months after the general stock market started to slide. We also saw some confirmations of this theory based on the analogy to 2008. All in all, the precious metals sector is likely to bottom about three months after the general stock market tops. The additional confirmation will come from the tapering schedule, as markets are likely to move on the rumor and reverse on the fact as they tend to do in general.
- The above is based on the information available today, and it might change in the following days/weeks.
You will find my general overview of the outlook for gold on the chart below:
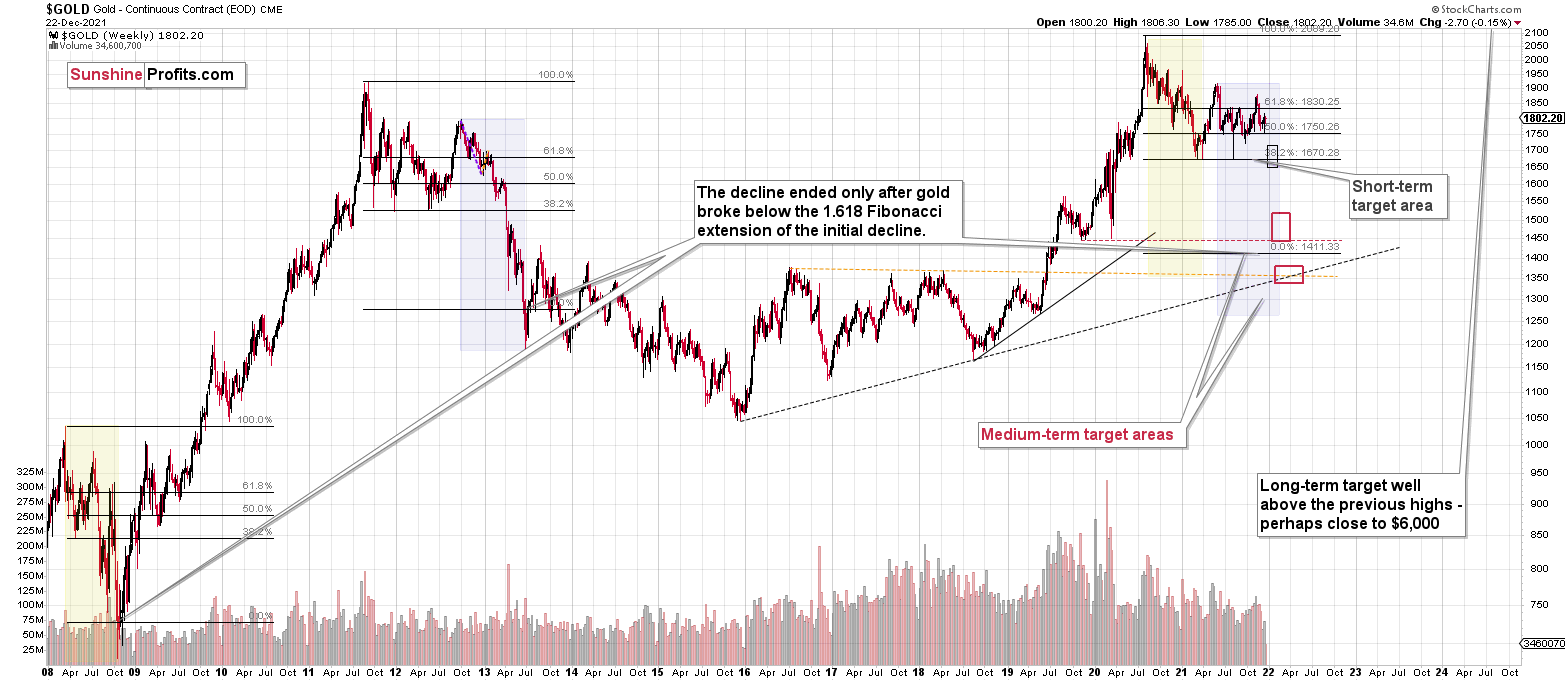
Please note that the above timing details are relatively broad and “for general overview only” – so that you know more or less what I think and how volatile I think the moves are likely to be – on an approximate basis. These time targets are not binding or clear enough for me to think that they should be used for purchasing options, warrants or similar instruments.
Summary
Summing up, it seems to me that while the corrective upswing might still continue, it might not be significant in the case of junior mining stocks. After the corrective upswing is over, I think that gold will decline once again, taking silver and mining stocks lower as well.
From the medium-term point of view, the key two long-term factors remain the analogy to 2013 in gold and the broad head and shoulders pattern in the HUI Index. They both suggest much lower prices ahead.
It seems that our profits from the short positions are going to become truly epic in the following months.
After the sell-off (that takes gold to about $1,350 - $1,500), I expect the precious metals to rally significantly. The final part of the decline might take as little as 1-5 weeks, so it's important to stay alert to any changes.
Most importantly, please stay healthy and safe. We made a lot of money last March and this March, and it seems that we’re about to make much more on the upcoming decline, but you have to be healthy to enjoy the results.
As always, we'll keep you - our subscribers - informed.
To summarize:
Trading capital (supplementary part of the portfolio; our opinion): Full speculative short positions (300% of the full position) in junior mining stocks are justified from the risk to reward point of view with the following binding exit profit-take price levels:
Mining stocks (price levels for the GDXJ ETF): binding profit-take exit price: $35.73; stop-loss: none (the volatility is too big to justify a stop-loss order in case of this particular trade)
Alternatively, if one seeks leverage, we’re providing the binding profit-take levels for the JDST (2x leveraged) and GDXD (3x leveraged – which is not suggested for most traders/investors due to the significant leverage). The binding profit-take level for the JDST: $16.18; stop-loss for the JDST: none (the volatility is too big to justify a SL order in case of this particular trade); binding profit-take level for the GDXD: $32.08; stop-loss for the GDXD: none (the volatility is too big to justify a SL order in case of this particular trade).
For-your-information targets (our opinion; we continue to think that mining stocks are the preferred way of taking advantage of the upcoming price move, but if for whatever reason one wants / has to use silver or gold for this trade, we are providing the details anyway.):
Silver futures downside profit-take exit price: $19.12
SLV profit-take exit price: $17.72
ZSL profit-take exit price: $41.38
Gold futures downside profit-take exit price: $1,683
HGD.TO – alternative (Canadian) inverse 2x leveraged gold stocks ETF – the upside profit-take exit price: $12.48
HZD.TO – alternative (Canadian) inverse 2x leveraged silver ETF – the upside profit-take exit price: $30.48
Long-term capital (core part of the portfolio; our opinion): No positions (in other words: cash
Insurance capital (core part of the portfolio; our opinion): Full position
Whether you already subscribed or not, we encourage you to find out how to make the most of our alerts and read our replies to the most common alert-and-gold-trading-related-questions.
Please note that we describe the situation for the day that the alert is posted in the trading section. In other words, if we are writing about a speculative position, it means that it is up-to-date on the day it was posted. We are also featuring the initial target prices to decide whether keeping a position on a given day is in tune with your approach (some moves are too small for medium-term traders, and some might appear too big for day-traders).
Additionally, you might want to read why our stop-loss orders are usually relatively far from the current price.
Please note that a full position doesn't mean using all of the capital for a given trade. You will find details on our thoughts on gold portfolio structuring in the Key Insights section on our website.
As a reminder - "initial target price" means exactly that - an "initial" one. It's not a price level at which we suggest closing positions. If this becomes the case (like it did in the previous trade), we will refer to these levels as levels of exit orders (exactly as we've done previously). Stop-loss levels, however, are naturally not "initial", but something that, in our opinion, might be entered as an order.
Since it is impossible to synchronize target prices and stop-loss levels for all the ETFs and ETNs with the main markets that we provide these levels for (gold, silver and mining stocks - the GDX ETF), the stop-loss levels and target prices for other ETNs and ETF (among other: UGL, GLL, AGQ, ZSL, NUGT, DUST, JNUG, JDST) are provided as supplementary, and not as "final". This means that if a stop-loss or a target level is reached for any of the "additional instruments" (GLL for instance), but not for the "main instrument" (gold in this case), we will view positions in both gold and GLL as still open and the stop-loss for GLL would have to be moved lower. On the other hand, if gold moves to a stop-loss level but GLL doesn't, then we will view both positions (in gold and GLL) as closed. In other words, since it's not possible to be 100% certain that each related instrument moves to a given level when the underlying instrument does, we can't provide levels that would be binding. The levels that we do provide are our best estimate of the levels that will correspond to the levels in the underlying assets, but it will be the underlying assets that one will need to focus on regarding the signs pointing to closing a given position or keeping it open. We might adjust the levels in the "additional instruments" without adjusting the levels in the "main instruments", which will simply mean that we have improved our estimation of these levels, not that we changed our outlook on the markets. We are already working on a tool that would update these levels daily for the most popular ETFs, ETNs and individual mining stocks.
Our preferred ways to invest in and to trade gold along with the reasoning can be found in the how to buy gold section. Furthermore, our preferred ETFs and ETNs can be found in our Gold & Silver ETF Ranking.
As a reminder, Gold & Silver Trading Alerts are posted before or on each trading day (we usually post them before the opening bell, but we don't promise doing that each day). If there's anything urgent, we will send you an additional small alert before posting the main one.
Thank you.
Przemyslaw Radomski, CFA
Founder, Editor-in-chief

