

Briefly: in our opinion, full (250% of the regular size of the position) speculative short positions in gold, silver and mining stocks are justified from the risk/reward perspective at the moment of publishing this alert.
Not much happened yesterday in case of gold and silver, but mining stocks declined, thus invalidating Friday’s daily show of strength. In our previous analysis, we explained that just as one swallow doesn’t make a summer, a one day of strength in the mining stocks doesn’t change the overall tendency for them to underperform gold. Yesterday’s session served as a perfect confirmation. What’s next?
The decline in the precious metals sector is likely to continue. We wrote about it many times before and we’ll probably write about it for at least several more days or (more likely) weeks. Just because the pause in the USD Index is taking a bit longer, it doesn’t mean that it’s any less likely to take place. The opposite is the case of the precious metals sector. In yesterday’s analysis we featured numerous signs pointing to lower PM prices in the following weeks. The only somewhat bullish sign was Friday’s strength of mining stocks relative to gold. And this signal was just clearly invalidated yesterday. Let’s take a closer look at the chart below (charts courtesy of http://stockcharts.com/).
Miners’ Relative Weakness
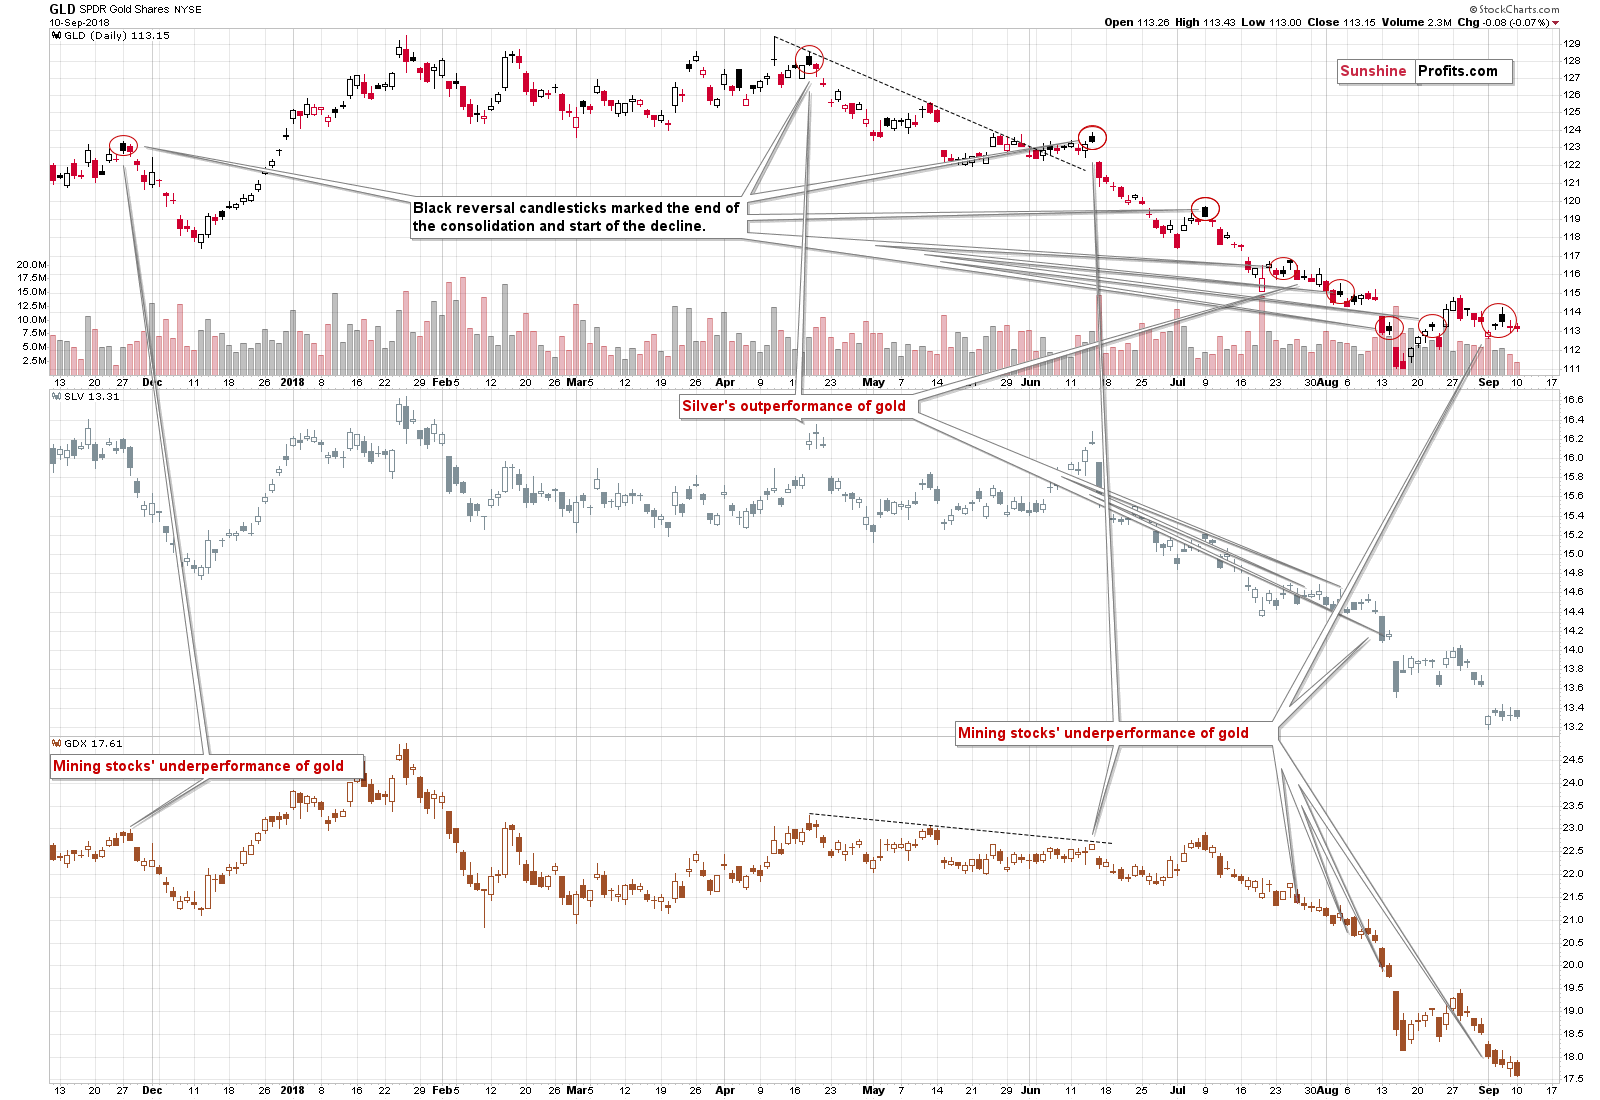
Looking at the last few days, it’s not even visible that there was any strength at all. Miners closed at a new 2018 low, while gold and silver didn’t. The miners’ weakness simply continues, just like it relentlessly continued in 2013 before the biggest part of the price slide.
With all the previously-discussed bearish factors in place and given the above, the outlook remains clearly bearish. There’s not much more we can add based on what happened yesterday.
Before summarizing, however, we would like to discuss the miners’ performance relative to gold in greater detail. We were asked to explain whether the mining stocks relative valuations can be trusted at all times (it didn’t seem to work very well at the end of 2015 and in early 2016). That was a very good question and we will be happy to elaborate.
Is Miners’ Under- and Outperformance Always Right?
First of all, the mining stocks’ performance is something that’s quite useful as a very short-term reversal sign, especially when it is accompanied by specific movement in silver. It’s most useful in case of detecting local tops. The technique is to look for days, when mining stocks underperform gold (the clearer the underperformance is, the stronger the signal becomes) and during which silver outperforms. The white metal’s outperformance could be just a few hours of very strong intraday or overnight rally – that’s usually enough.
If there is no confirmation from silver, then we’d prefer to have other reversal signs as well, before acting on this signal. The daily lack of reaction in the mining stocks relative to gold’s movement is one of the more reliable short-term signals, but it’s not perfect.
The question that we received wasn’t really about the short-term trades, though. It was about the usefulness of the major signals. For instance, the ones that could confirm or invalidate the final bottom for this decline in the precious metals sector.
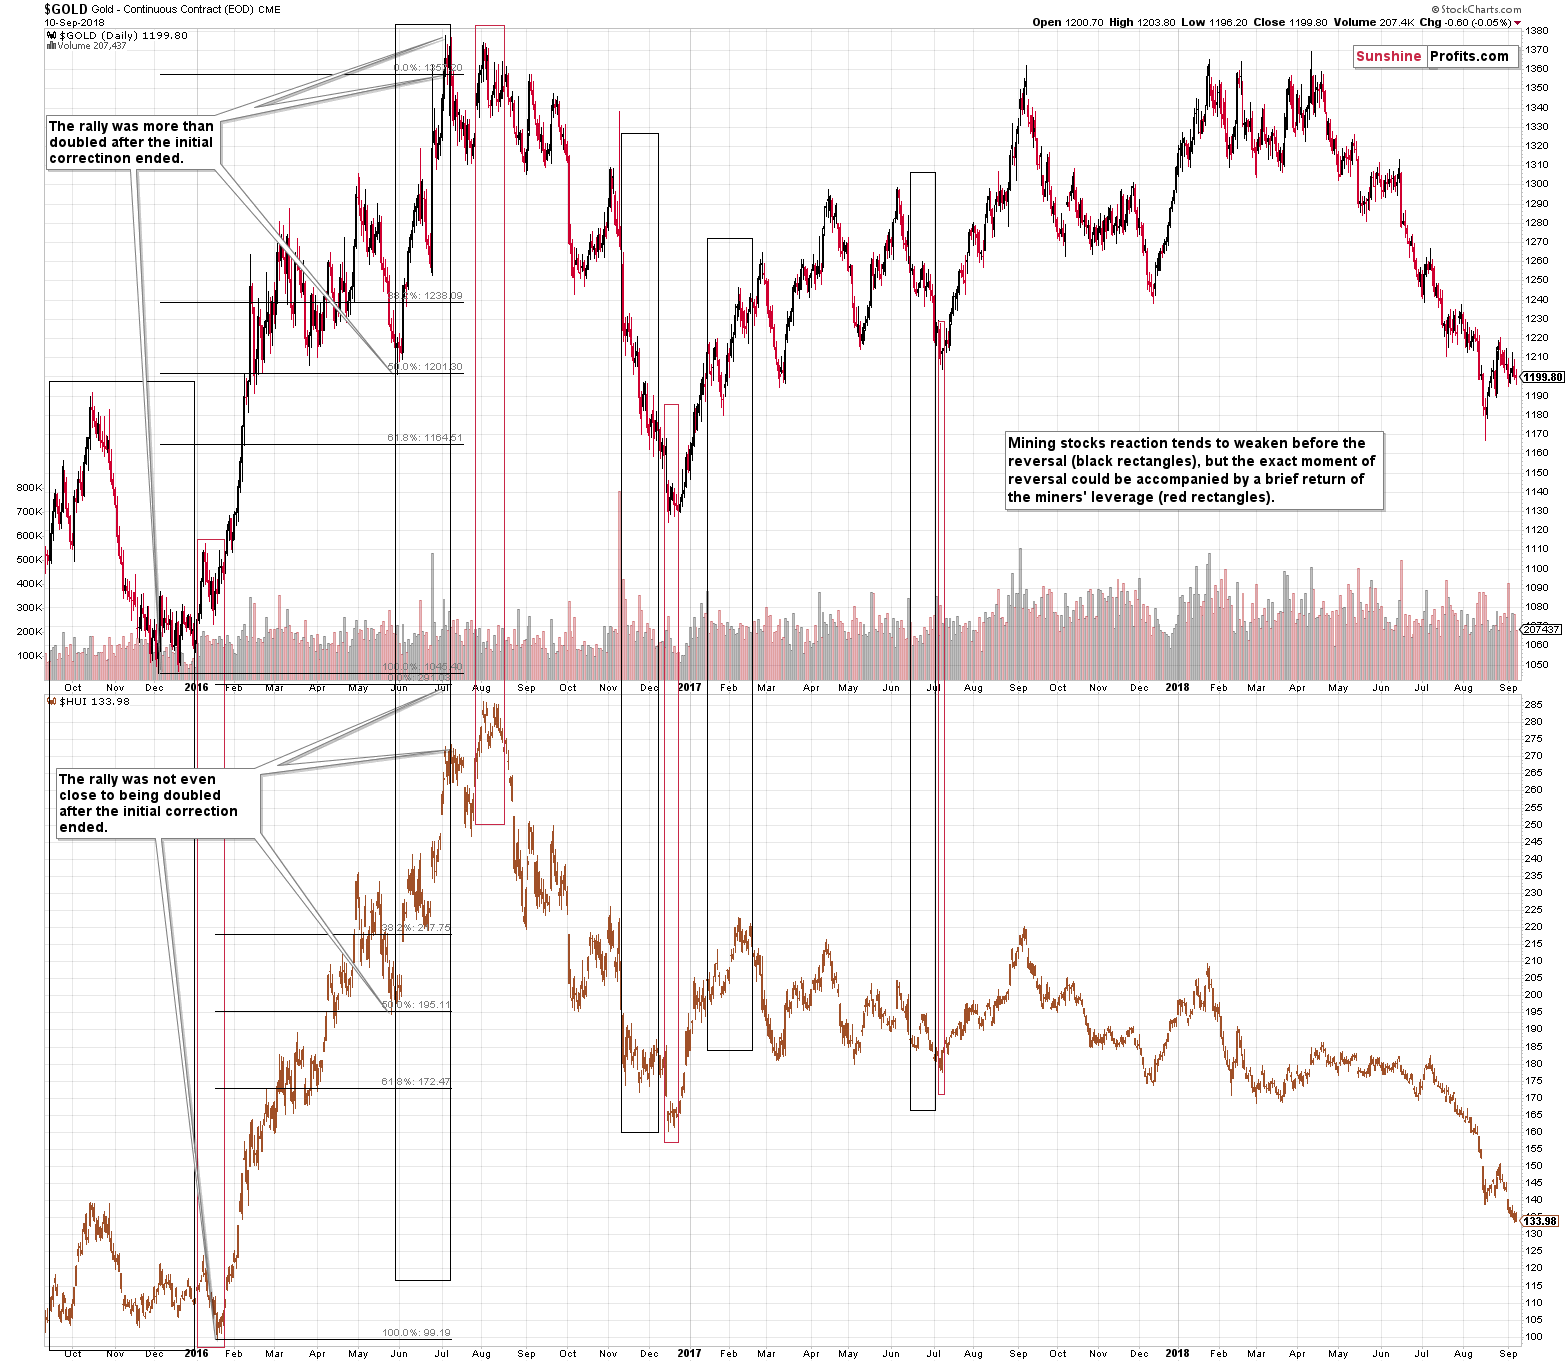
It turns out that those who are saying that mining stocks often lose their leverage to gold before the reversal (refusing to decline much while gold continues to decline, or rallying just a bit, while gold is rallying strongly), and those who say that miners are often wrong at the extremes are both correct.
And it’s not contradictory.
You see, the mining stocks first tend to lose their leverage in advance and it persists for some time. Then, at times, there is a fake leverage right at the price extreme.
We marked this specific situation on the above chart. The black rectangles represent the times, when gold stocks’ leverage to gold declined (late 2015, June 2016, November 2016, January-February 2017, and June 2017) and the red rectangles (early 2016, late July and early August 2016, mid-December 2016, early July 2017) show when the leverage returned.
It’s important to note that this happened during both: rallies and declines.
What does it mean for us in the current situation? It means that we shouldn’t be surprised by action that’s similar to what we saw in the late 2015 and early 2016. Mining stocks could continue to show weakness for some time and then start to show strength for days (perhaps even weeks if the final bottom takes place later than in October) while gold declines, thus flashing the final warning signs for those, who haven’t prepared for THE bottom yet. But, the exact bottom, could be accompanied by the comeback of mining stocks’ weakness.
In other words, while the mining stocks strength can be viewed as “the bottom is coming!” sign (and some investors may prefer to start accumulating the long-term investments in the PM sector at that time), other techniques should be applied in order to determine the exact bottoming time and price.
Important Analyses
Before summarizing, we would like to emphasize that we have recently posted several analyses that are very important and that one should keep in mind, especially in the next several weeks. If you haven’t had the chance of reading them previously, we encourage you to do so today:
- Dear Gold Investor - Letters from 2013 - Analogy to 2013, which should make it easier to trade the upcoming sizable upswing (if enough factors point to it, that is) and to enter the market close to the final bottom.
- Gold to Soar Above $6,000 - discussion of gold’s long-term upside target of $6,000.
- Preparing for THE Bottom in Gold: Part 6 – What to Buy - extremely important analysis of the portfolio structure for the next huge, multi-year rally in the precious metals.
- Preparing for THE Bottom in Gold: Part 7 – Buy-and-hold on Steroids – description of a strategy dedicated to significantly boosting one’s long-term investment returns while staying invested in the PM sector.
- Gold’s Downside Target, Upcoming Rebound, and Miners’ Buy Plan - details regarding the shape of the following price moves, a buying plan for mining stocks, and a brief discussion of the final price targets for the current decline.
- Gold: What Happened vs. What Changed – discussion of the latest extreme readings from gold’s CoT report
- Key Factors for Gold & Silver Investors - discussion of key, long-term factors that support the bearish outlook for PMs. We are often asked what makes us so bearish – this article is a reply to this question.
- The Upcoming Silver Surprise – two sets of price targets for gold, silver and mining stocks: the initial and the final one.
Summary
Summing up, it’s very likely that the pause in the precious metals market is over and the next big move down is already underway. The move is likely to be sharp and the profits on the current short position are likely to change from being huge to being enormous and then finally to being ridiculous.
As always, we’ll keep you – our subscribers – informed.
To summarize:
Trading capital (supplementary part of the portfolio; our opinion): Full short positions (250% of the full position) in gold, silver and mining stocks are justified from the risk/reward perspective with the following stop-loss orders and exit profit-take price levels:
- Gold: profit-take exit price: $1,062; stop-loss: $1,226; initial target price for the DGLD ETN: $82.96; stop-loss for the DGLD ETN $53.67
- Silver: profit-take exit price: $12.72; stop-loss: $15.16; initial target price for the DSLV ETN: $46.97; stop-loss for the DSLV ETN $31.37
- Mining stocks (price levels for the GDX ETF): profit-take exit price: $13.12; stop-loss: $19.61; initial target price for the DUST ETF: $80.97; stop-loss for the DUST ETF $33.37
Note: the above is a specific preparation for a possible sudden price drop, it does not reflect the most likely outcome. You will find a more detailed explanation in our August 1 Alert. In case one wants to bet on junior mining stocks’ prices (we do not suggest doing so – we think senior mining stocks are more predictable in the case of short-term trades – if one wants to do it anyway, we provide the details), here are the stop-loss details and target prices:
- GDXJ ETF: profit-take exit price: $17.52; stop-loss: $29.43
- JDST ETF: initial target price: $154.97 stop-loss: $64.88
Long-term capital (core part of the portfolio; our opinion): No positions (in other words: cash)
Insurance capital (core part of the portfolio; our opinion): Full position
Important Details for New Subscribers
Whether you already subscribed or not, we encourage you to find out how to make the most of our alerts and read our replies to the most common alert-and-gold-trading-related-questions.
Please note that the in the trading section we describe the situation for the day that the alert is posted. In other words, it we are writing about a speculative position, it means that it is up-to-date on the day it was posted. We are also featuring the initial target prices, so that you can decide whether keeping a position on a given day is something that is in tune with your approach (some moves are too small for medium-term traders and some might appear too big for day-traders).
Plus, you might want to read why our stop-loss orders are usually relatively far from the current price.
Please note that a full position doesn’t mean using all of the capital for a given trade. You will find details on our thoughts on gold portfolio structuring in the Key Insights section on our website.
As a reminder – “initial target price” means exactly that – an “initial” one, it’s not a price level at which we suggest closing positions. If this becomes the case (like it did in the previous trade) we will refer to these levels as levels of exit orders (exactly as we’ve done previously). Stop-loss levels, however, are naturally not “initial”, but something that, in our opinion, might be entered as an order.
Since it is impossible to synchronize target prices and stop-loss levels for all the ETFs and ETNs with the main markets that we provide these levels for (gold, silver and mining stocks – the GDX ETF), the stop-loss levels and target prices for other ETNs and ETF (among other: UGLD, DGLD, USLV, DSLV, NUGT, DUST, JNUG, JDST) are provided as supplementary, and not as “final”. This means that if a stop-loss or a target level is reached for any of the “additional instruments” (DGLD for instance), but not for the “main instrument” (gold in this case), we will view positions in both gold and DGLD as still open and the stop-loss for DGLD would have to be moved lower. On the other hand, if gold moves to a stop-loss level but DGLD doesn’t, then we will view both positions (in gold and DGLD) as closed. In other words, since it’s not possible to be 100% certain that each related instrument moves to a given level when the underlying instrument does, we can’t provide levels that would be binding. The levels that we do provide are our best estimate of the levels that will correspond to the levels in the underlying assets, but it will be the underlying assets that one will need to focus on regarding the signs pointing to closing a given position or keeping it open. We might adjust the levels in the “additional instruments” without adjusting the levels in the “main instruments”, which will simply mean that we have improved our estimation of these levels, not that we changed our outlook on the markets. We are already working on a tool that would update these levels on a daily basis for the most popular ETFs, ETNs and individual mining stocks.
Our preferred ways to invest in and to trade gold along with the reasoning can be found in the how to buy gold section. Additionally, our preferred ETFs and ETNs can be found in our Gold & Silver ETF Ranking.
As a reminder, Gold & Silver Trading Alerts are posted before or on each trading day (we usually post them before the opening bell, but we don't promise doing that each day). If there's anything urgent, we will send you an additional small alert before posting the main one.
=====
Latest Free Trading Alerts:
No, we are not in Wyoming. But we have carefully followed the Fed’s key conference in Jackson Hole. What does the recent central bankers’ meeting in Wyoming imply for the gold market?
Is There Any Gold in Jackson Hole?
=====
Hand-picked precious-metals-related links:
PRECIOUS-Gold slips, pressured by strong dollar outlook
Highest-grade gold mines in 2017
=====
In other news:
Emerging Markets Hear the Mighty Dollar Roar
Emerging-Markets in Moment of Calm Before Central-Bank Meetings
Battered From All Sides, Hong Kong Stocks Fall Into Bear Market
Lehman Brothers collapse: where are the key figures now?
Oil rises as U.S. sanctions on Iran squeeze supply
Winklevoss Twins Win Regulatory Approval for State Street-Backed, Dollar-Pegged Cryptocurrency
=====
Thank you.
Sincerely,
Przemyslaw Radomski, CFA
Founder, Editor-in-chief, Gold & Silver Fund Manager
Gold & Silver Trading Alerts
Forex Trading Alerts
Oil Investment Updates
Oil Trading Alerts

