

Briefly: in our opinion, full (250% of the regular size of the position) speculative short positions in gold, silver and mining stocks are justified from the risk/reward perspective at the moment of publishing this alert.
In the previous analyses, we wrote about the underperformance in mining stocks compared to gold’s price movement. Last Friday, we saw exactly the opposite. Gold moved lower, while mining stocks ended the session in the green. Since miners’ weakness indicated lower prices for many days, should Friday’s strength be viewed as an indication that the bottom is in and that the prices are going higher shortly?
No. One swallow doesn’t make a summer. Let’s take a closer look at the chart (charts courtesy of http://stockcharts.com).
Mining Stocks’ Performance
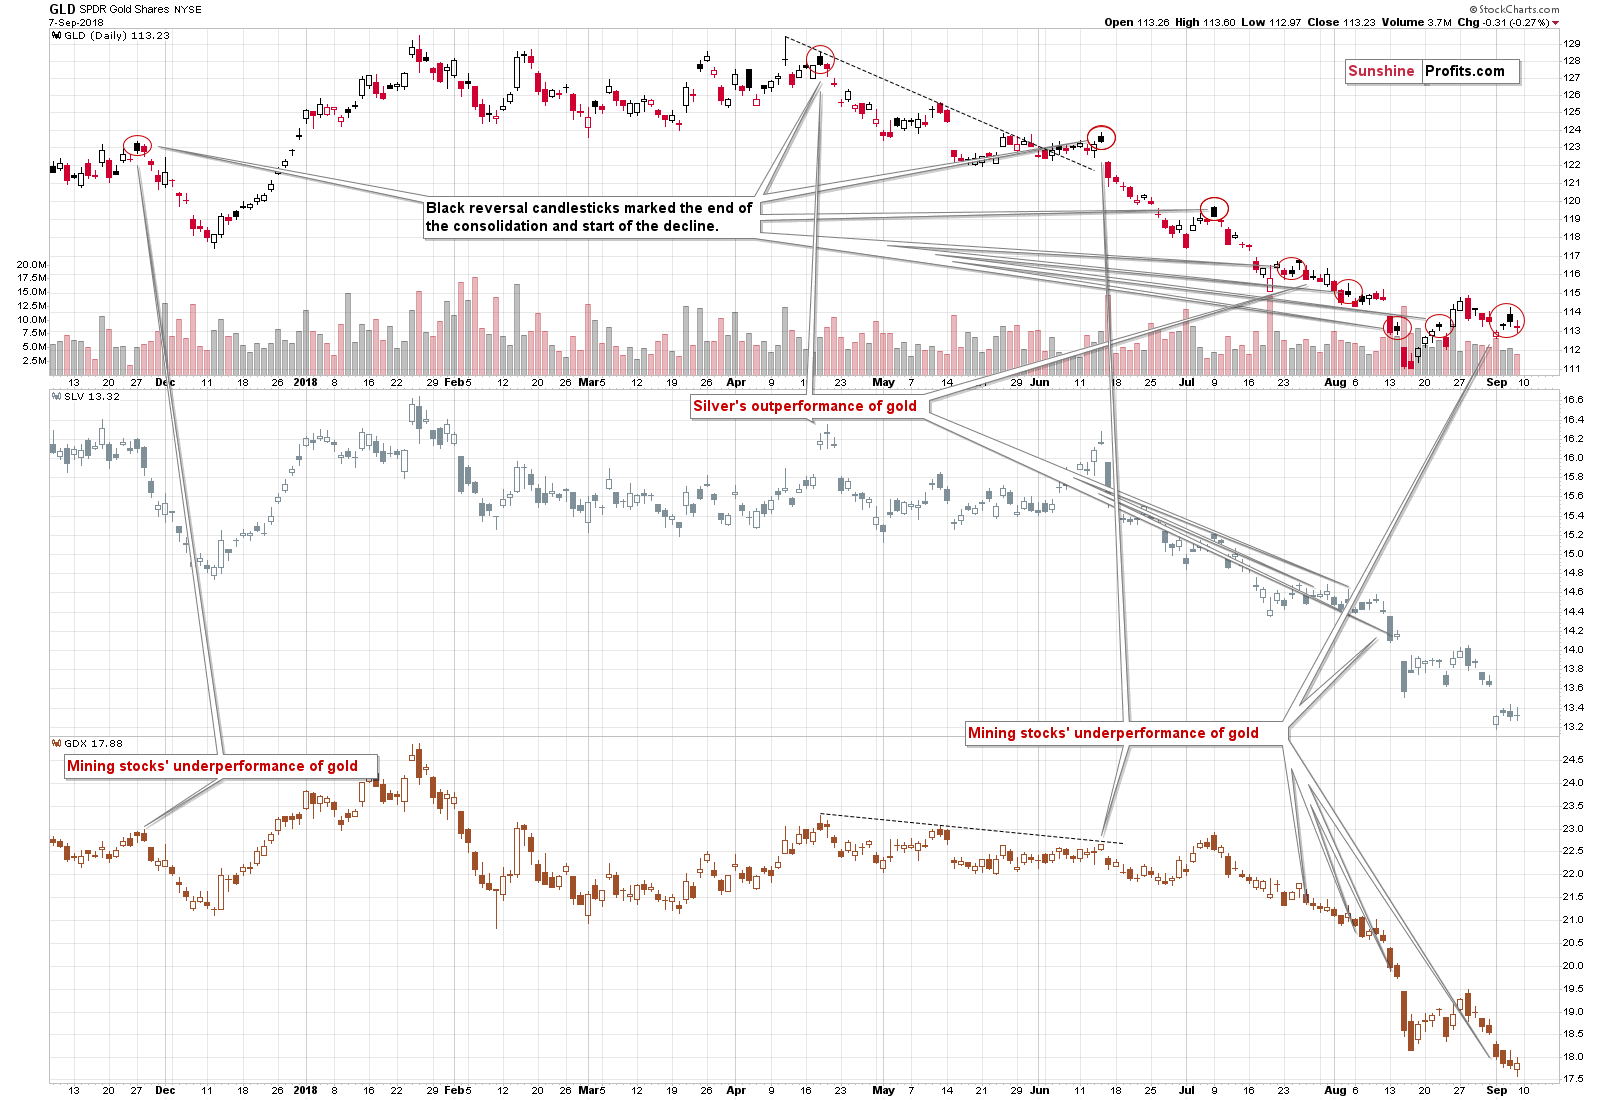
The underperformance of mining stocks was repeated many times and one day of something opposite doesn’t indicate anything. It might have simply been accidental. If we see more signs of strength and/or a repeat of what we saw on Friday, the outlook will likely change. But it hasn’t changed so far.
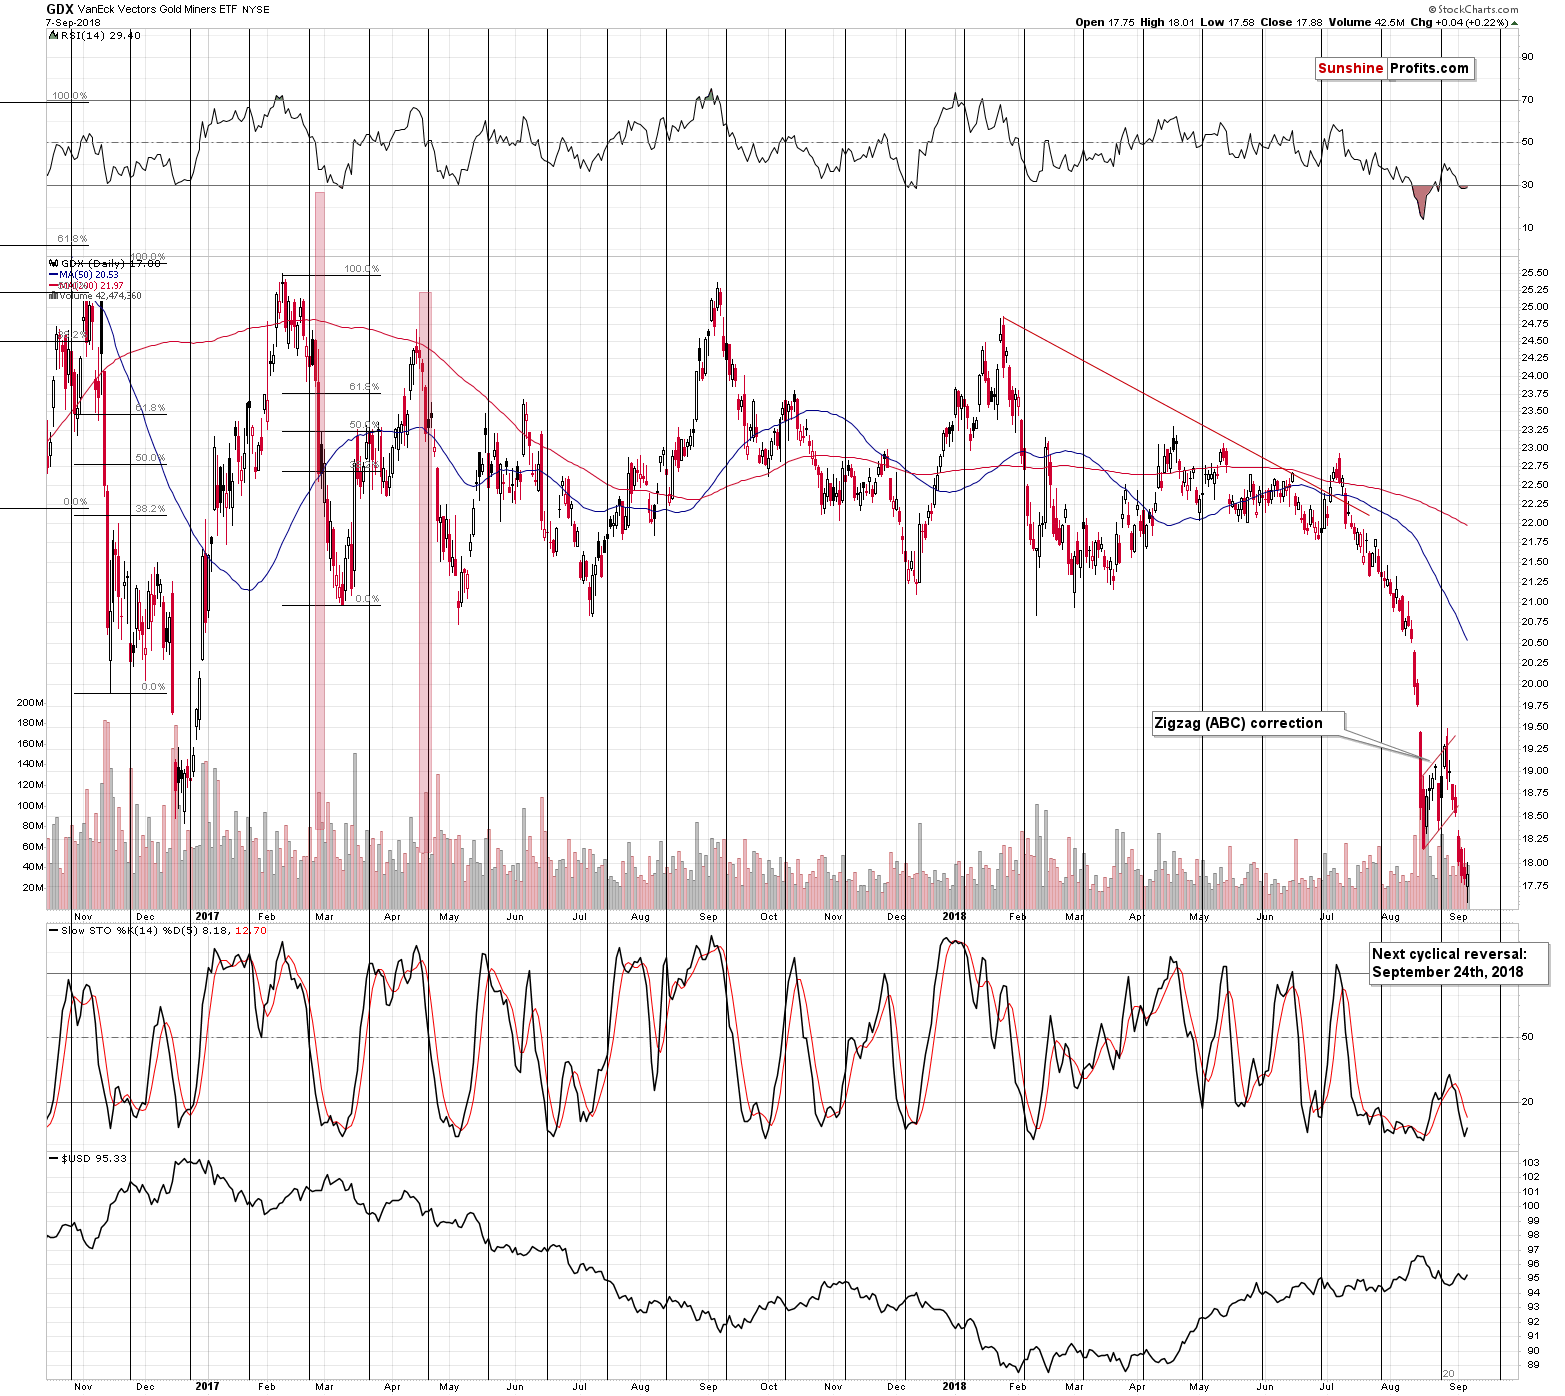
Besides the GDX ETF didn’t even manage to move above the mid-August bottom. Consequently, what seems to be mining stocks’ strength, was actually nothing more than just a verification of the breakdown.
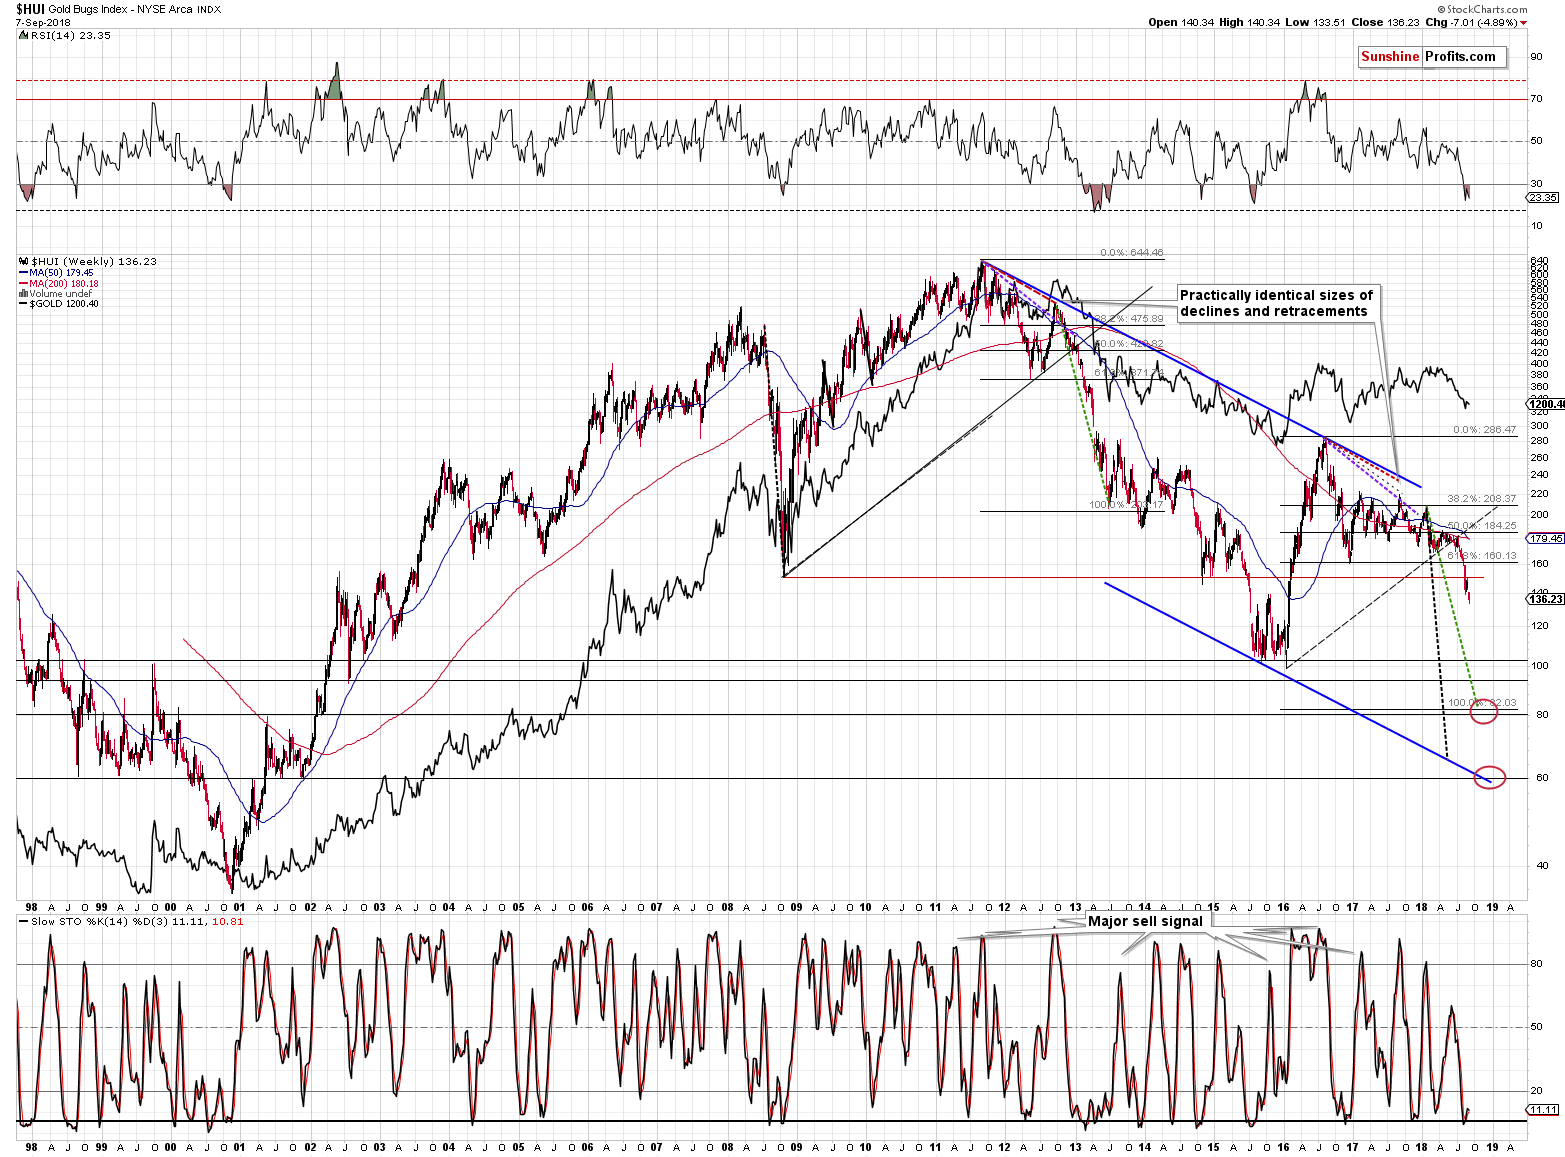
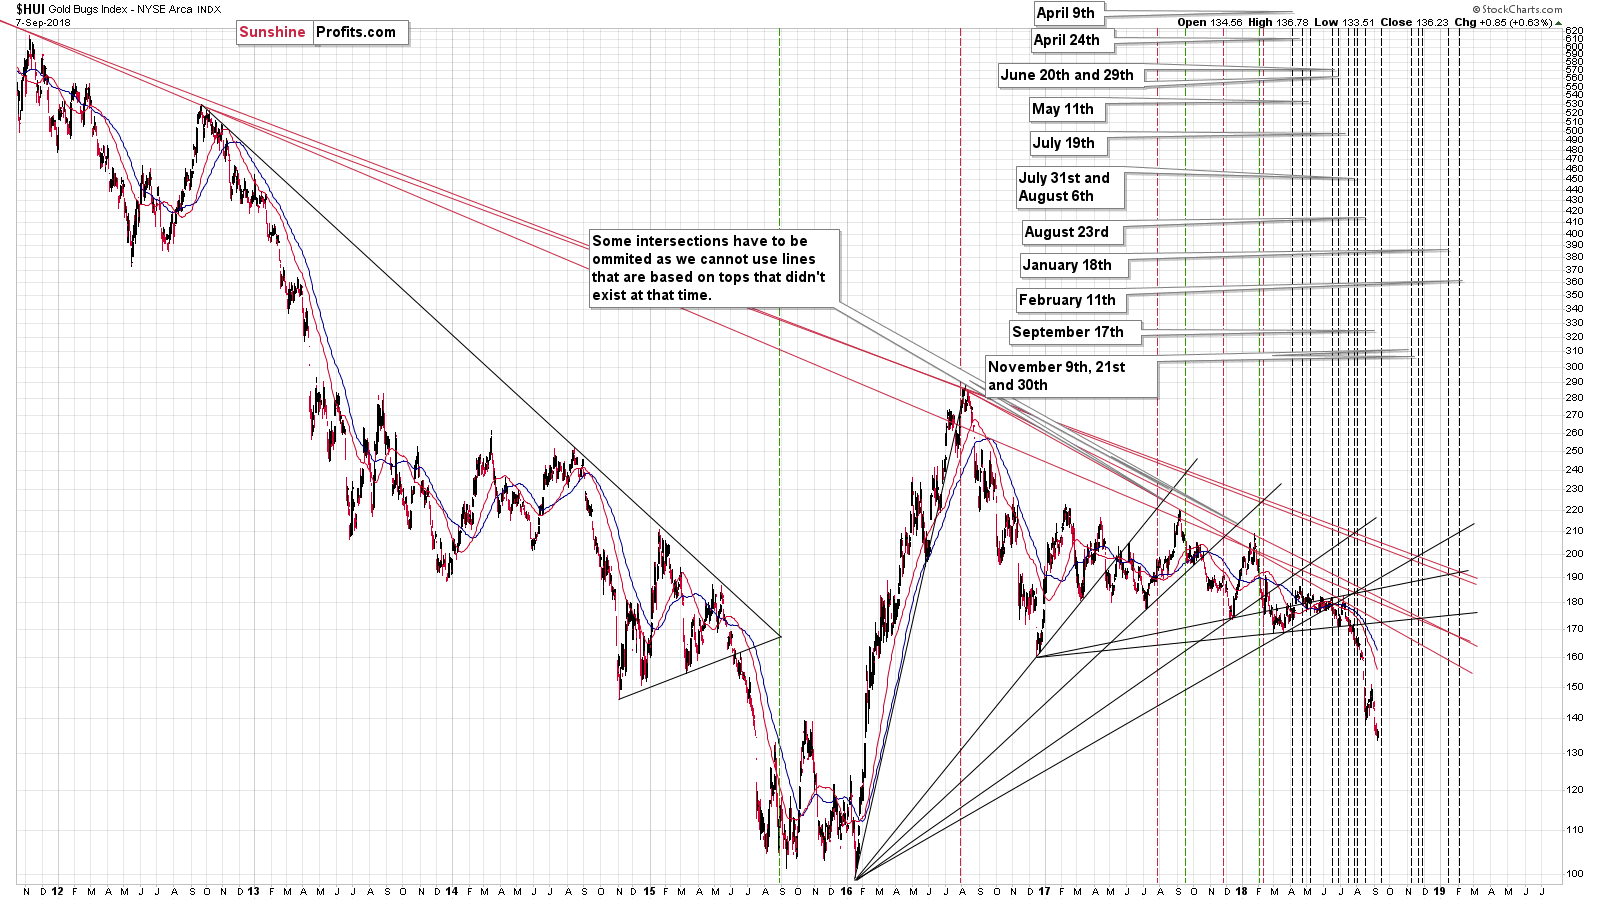
From the long-term point of view Friday’s rally is not even visible. All that we can see is that gold stocks took a breather after breaking below the 2008 low and that they once again declined, sliding almost 5% last week.
The outlook is clearly bearish. Moreover, since there is no significant support all the way down to the 100 level in the HUI Index, the near-term decline is likely to be volatile.
We can say something similar about silver.
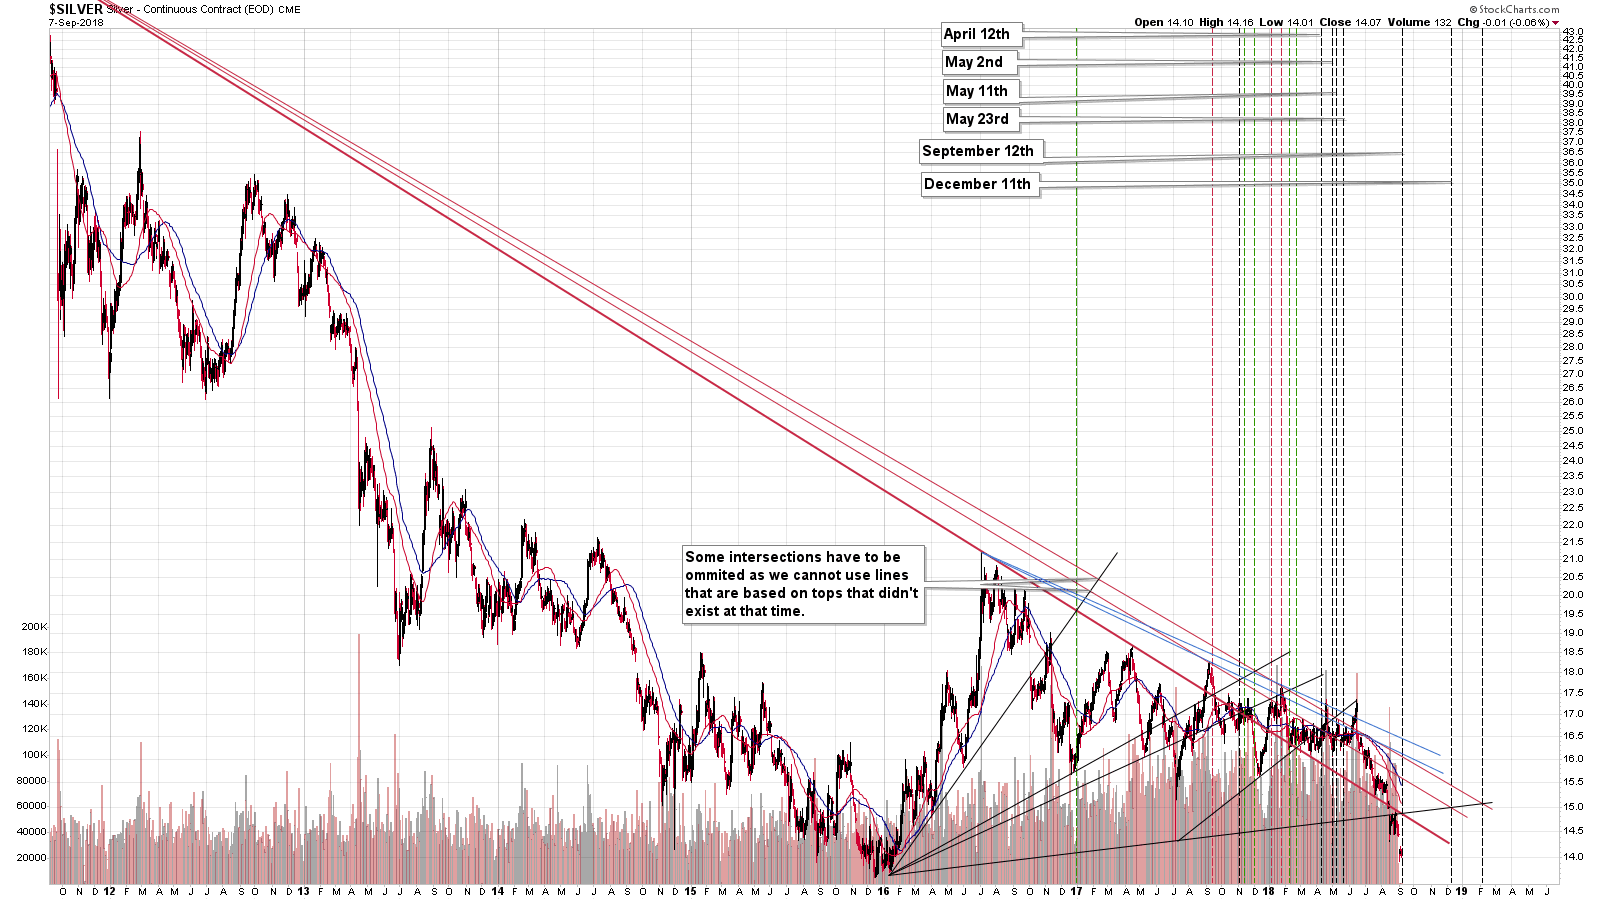
The Silver Breakdown
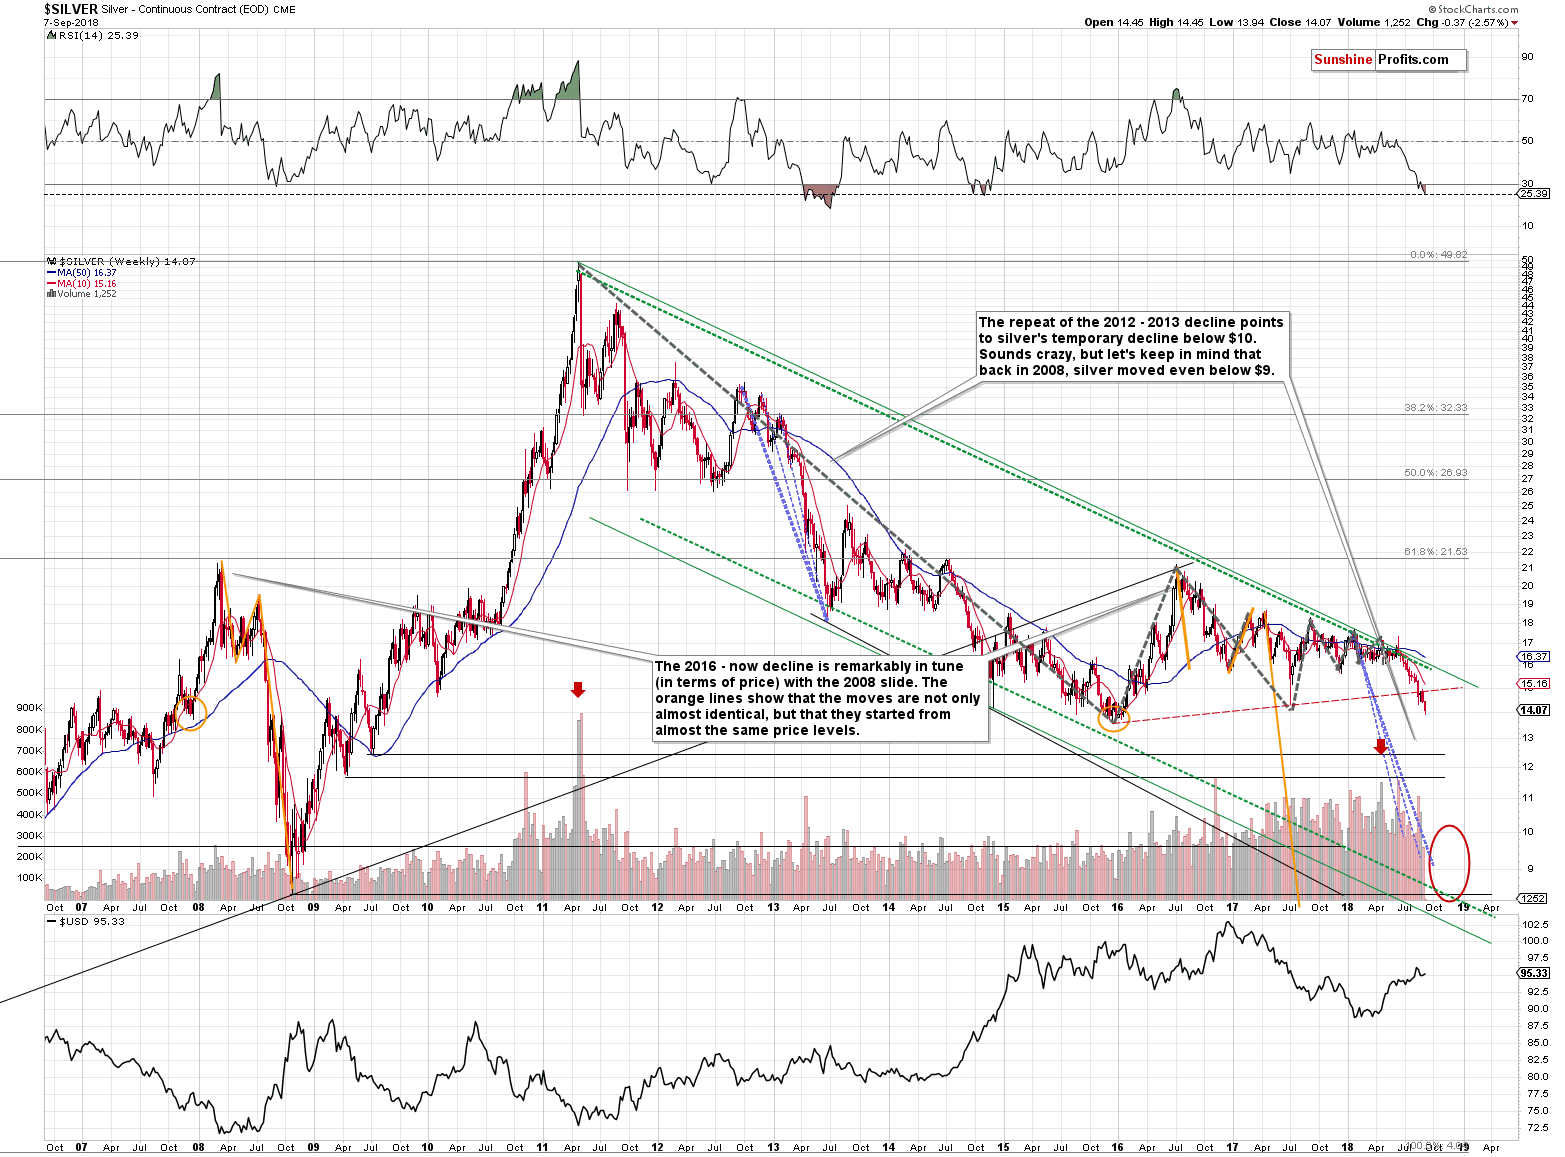
Namely, just like the HUI Index, the white metal is after a major breakdown that was followed by a short-term consolidation. The decline can now resume.
In case of silver, we have a nearby support in the form of the late 2015 lows. The problem, however, is that the support is very close and since the potential for the decline is significant in case of gold and mining stocks, we can expect silver to move below the above-mentioned lows before starting a bigger corrective rally.
Also, please keep in mind that silver tends to catch up with vengeance in the final part of the move. Consequently, since it’s not the beginning of the decline, it’s highly unlikely that silver would start showing strength by not declining when gold and miners move lower.
Having said that, let’s take a look at gold.
Gold’s Confirmation
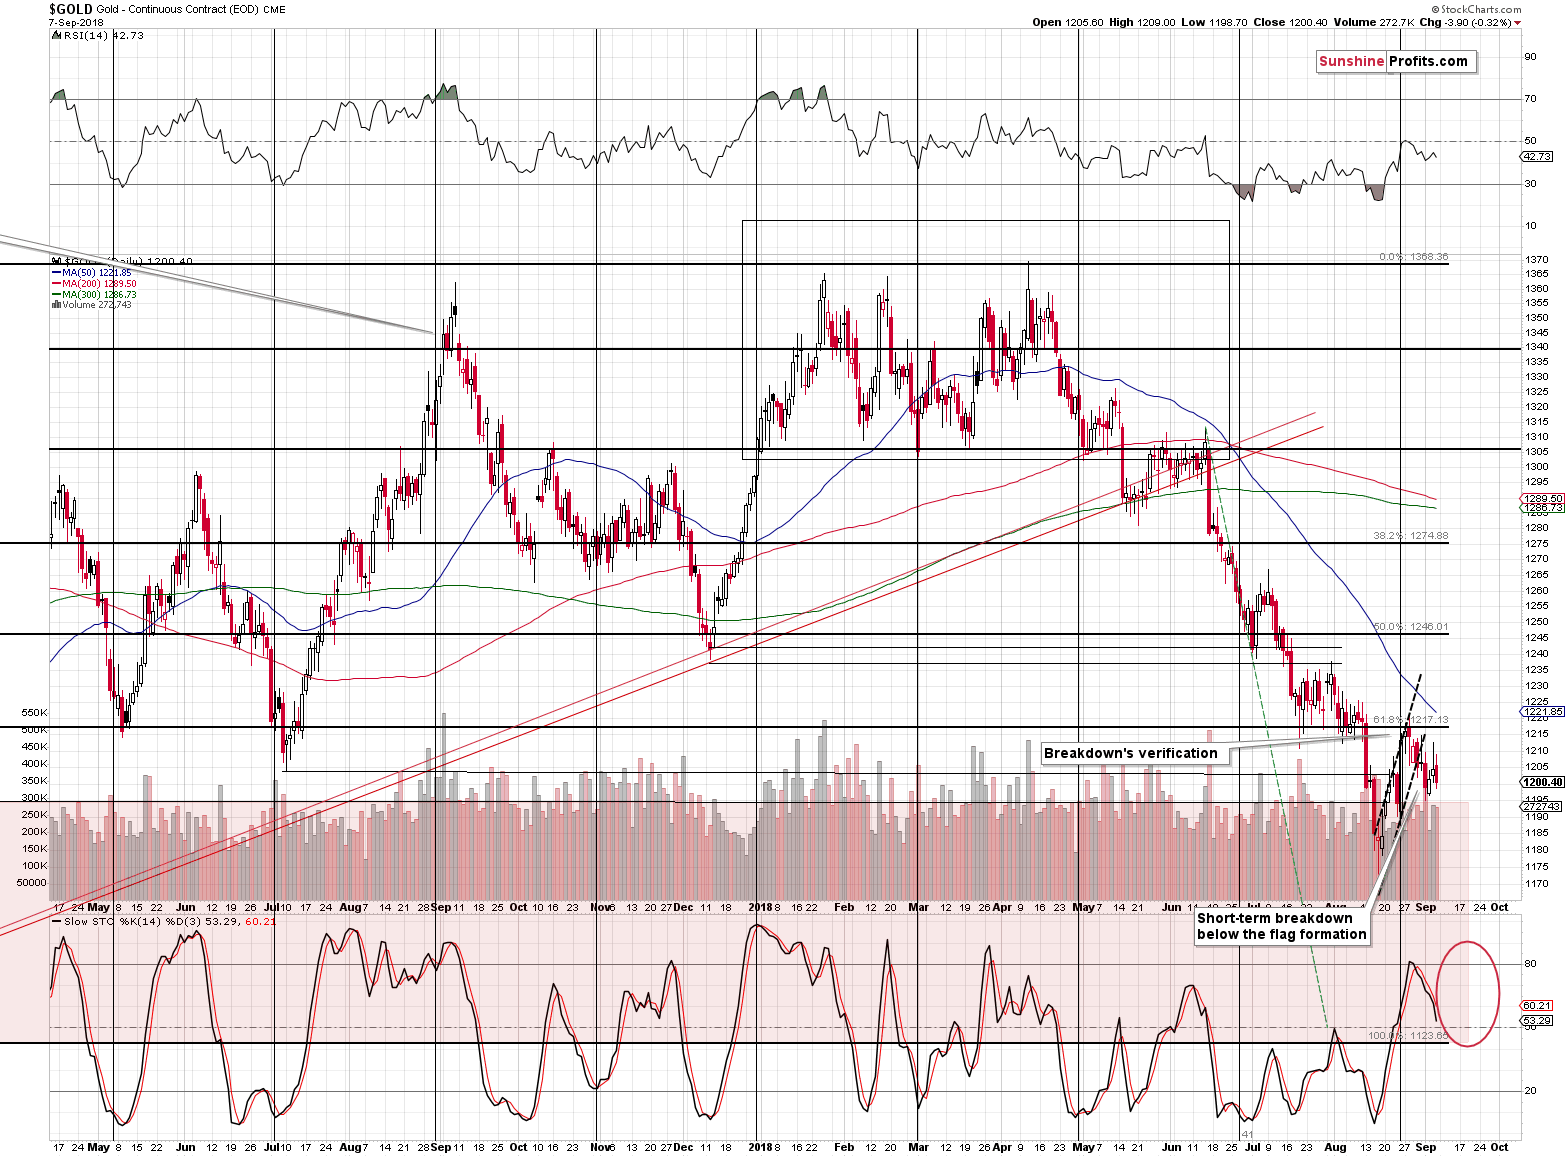
At the first sight, gold hasn’t done much last week. It just moved back and forth. But the reality is very different. Gold completed the flag formation, broke below it and verified the breakdown.
This is not a neutral development. It’s very bearish. As a reminder, the moves that follow the flag patterns are usually similar to the ones that preceded them. Gold declined quite significantly before consolidating, so it’s likely to decline profoundly from here as well.
The same goes for the price of platinum.
Platinum’s Breakdown
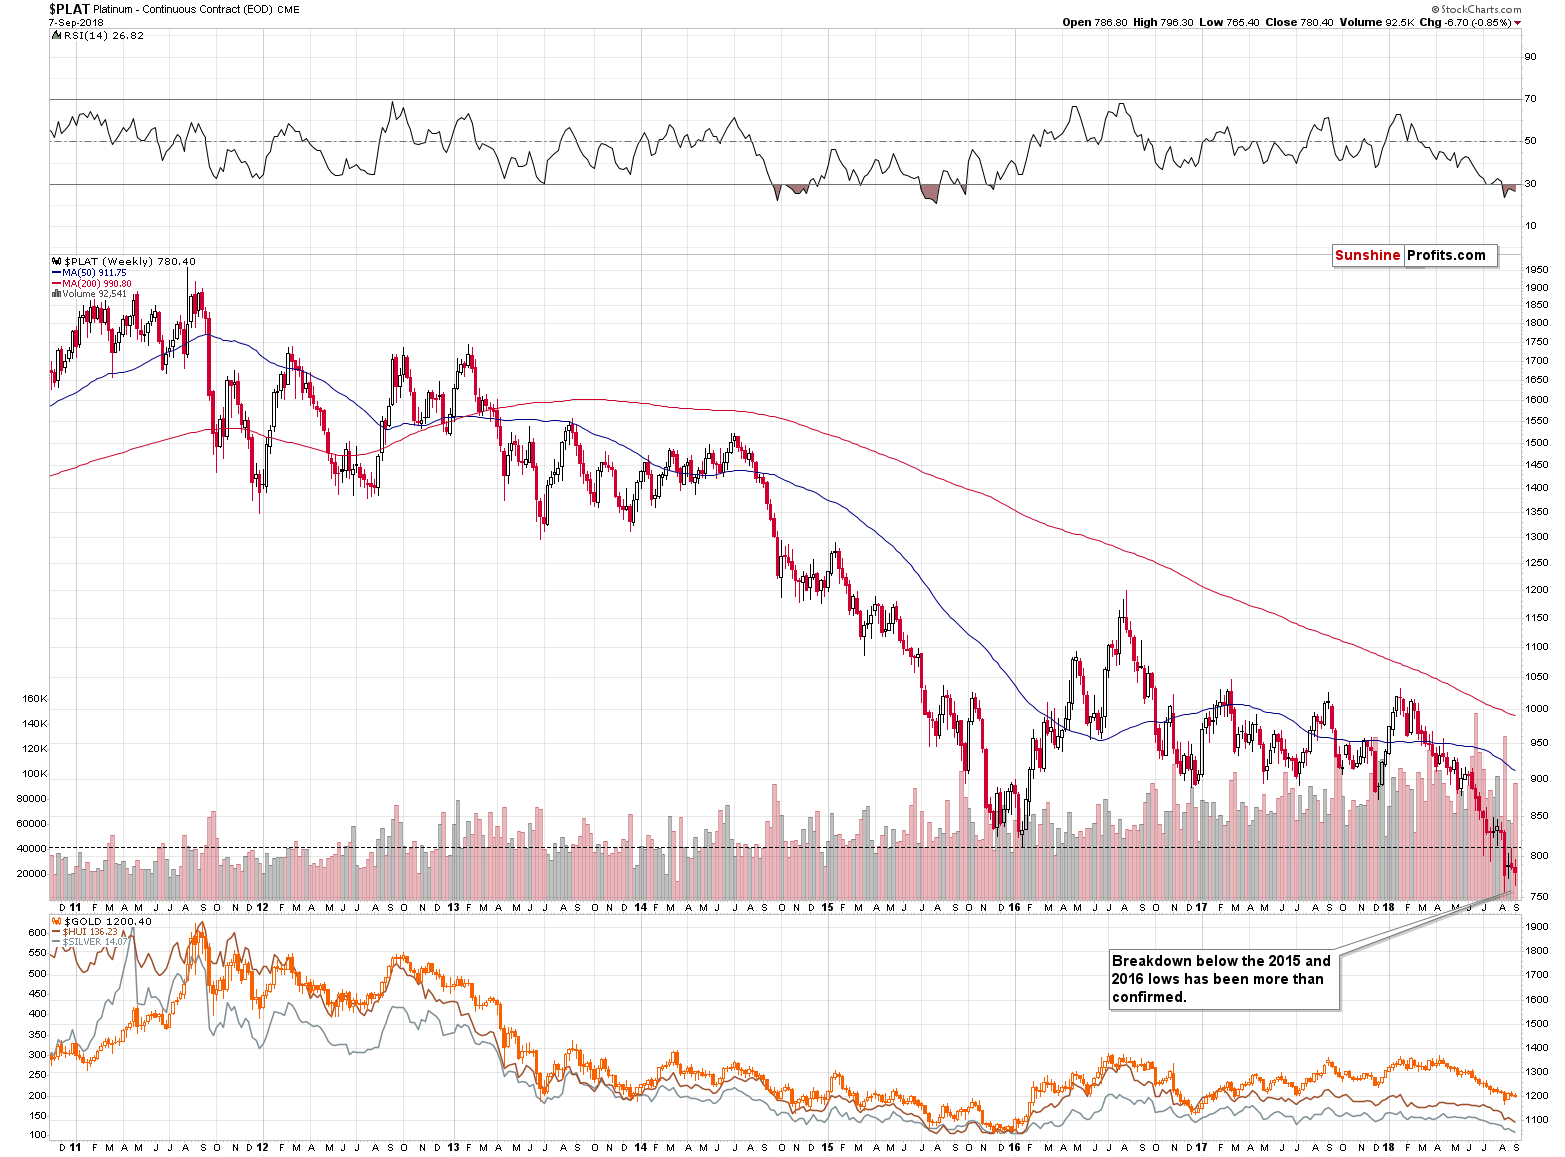
Platinum broke below its early 2016 bottom and it’s been trading below it for a few weeks now. We just saw fourth consecutive weekly close below the 2016 low. We also saw a temporary move back to the above-mentioned low. That was a classic verification of a breakdown and at this time the breakdown is fully completed and verified. The implications are extremely bearish for the following weeks. Since the PMs tend to move together, the above is also bearish for the rest of the precious metals sector.
The USD Tension
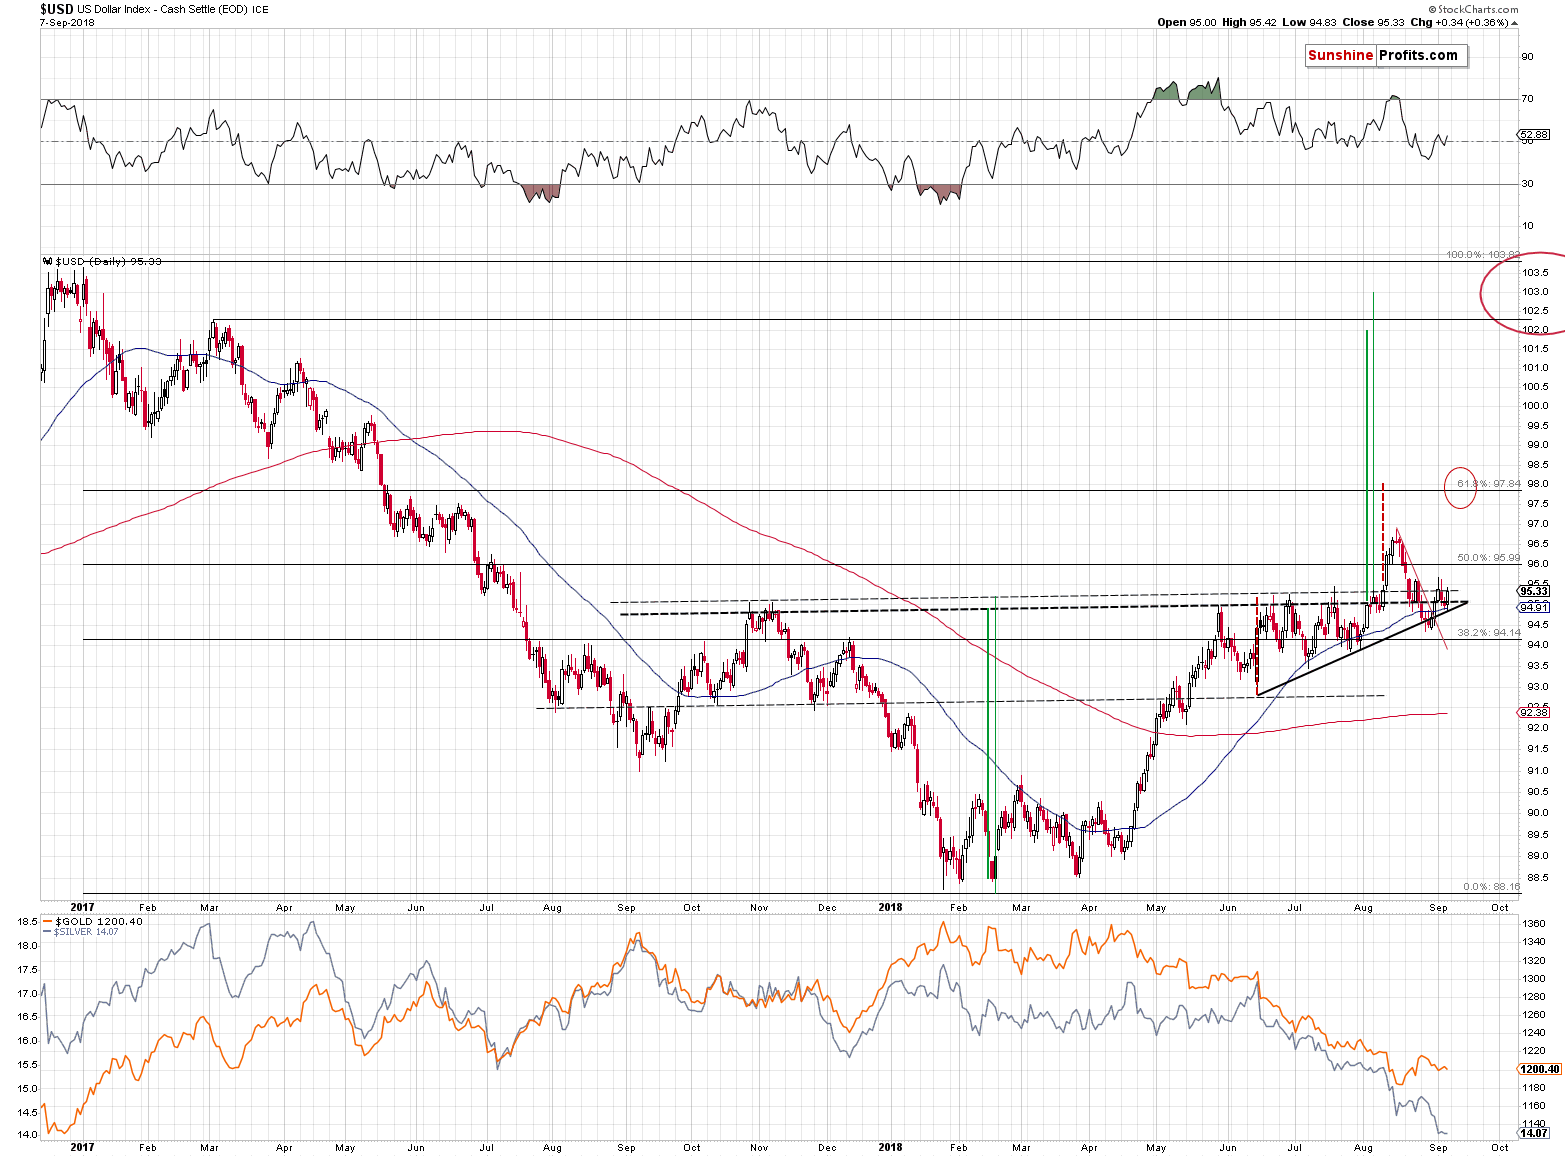
The USD Index has broken above the neck level of the reverse head-and-shoulders pattern and then it moved back to it (temporarily moving a bit below it). It closed the week above 95, so the formation and its very bullish implications remain in place. This means that the USDX is very likely to soar very soon. Just because not much happened in the last few weeks it doesn’t mean that the implications changed. Conversely, they remain strongly bullish for the USDX and bearish for the precious metals sector.
The Important Ratios
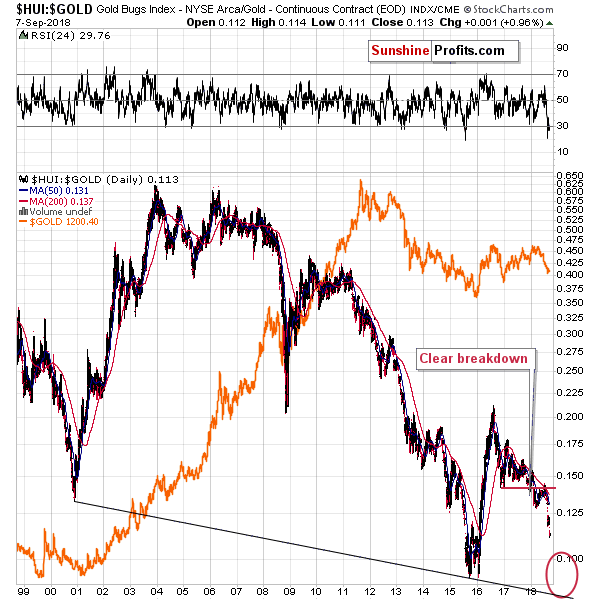
The gold stocks to gold ratio is in a freefall, just like we expected it to be. After the breakdown below the late-2016 lows in the early part of this year and the very visible verification of the move, there is no strong support to prevent this ratio’s demise.
The next target are the 2015 and 2016 lows, but it’s not guaranteed that a move to these levels will mark the end of the decline. After all, the very long-term support provided by the 2000 bottom was only able to generate a temporary correction in late 2014 and early 2015 – it wasn’t the final bottom. Consequently, the 2015/2016 bottom may not prevent the decline either.
Consequently, if gold is to decline to $890 or so, then both targets for the HUI Index that we featured previously: 60 and 80 seem to be in tune with the above.
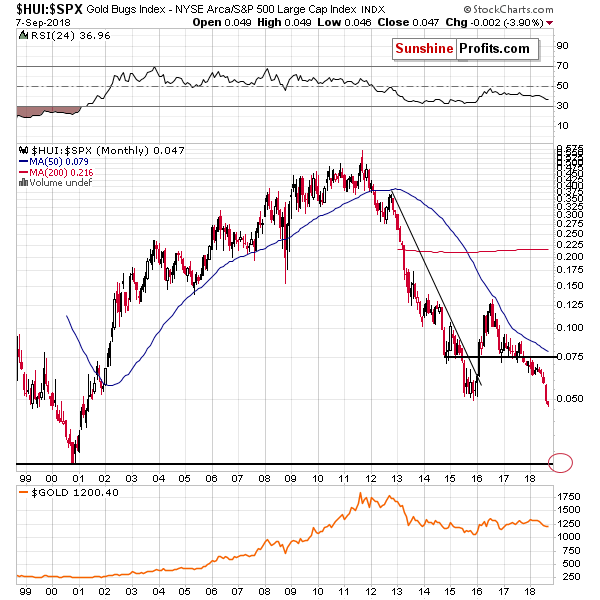
Comparing gold stocks’ performance to the one of the general stock market, we simply see that there was a major breakdown and thus the gold miners are likely to slide further.
There is also a breakout.
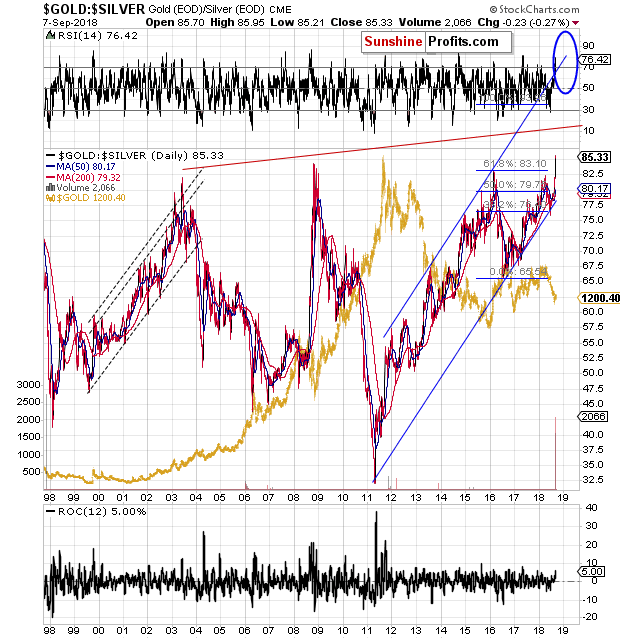
The gold to silver ratio just closed the week above the extremes that we saw in 2003, 2008, and 2016. That’s a shocking piece of news for most investors and analysts, but not for you as you knew that the real very long-term resistance is much higher – at about 100. The breakout shows that the “surprising” part of the move has just begun.
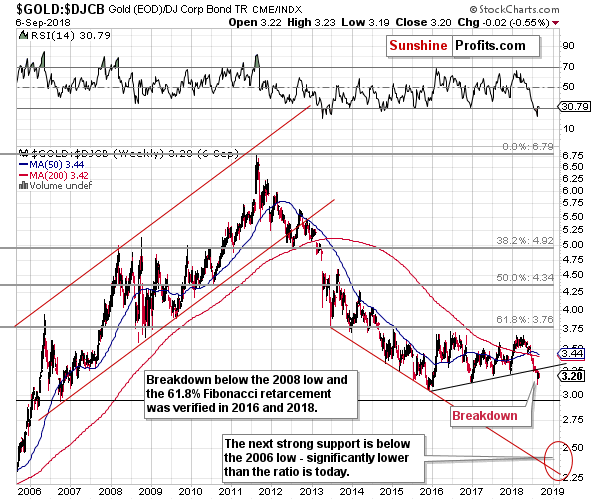
Finally, we would like to show you the ratio between gold and (corporate) bonds. This ratio is also a result of a major breakdown. There was no comeback above the broken line – we only saw a pause. Since the ratio closed below the previous support for a few weeks, it seems safe to say that the breakdown was verified, which means that the implications are bearish.
The ratio does a very good job at indicating the major price moves in the PM sector, so the implications are very bearish for the next several weeks.
Before summarizing, we would like to discuss the triangle-vertex-based reversals and the current True Seasonal patterns as we were asked to do so. Let’s start with the latter.
True Seasonals for September
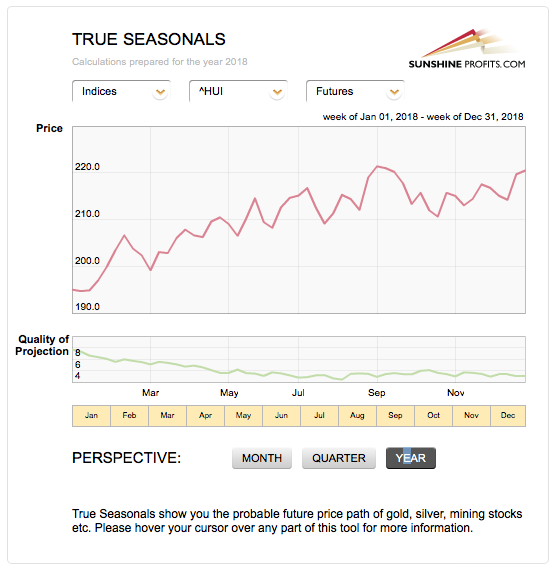
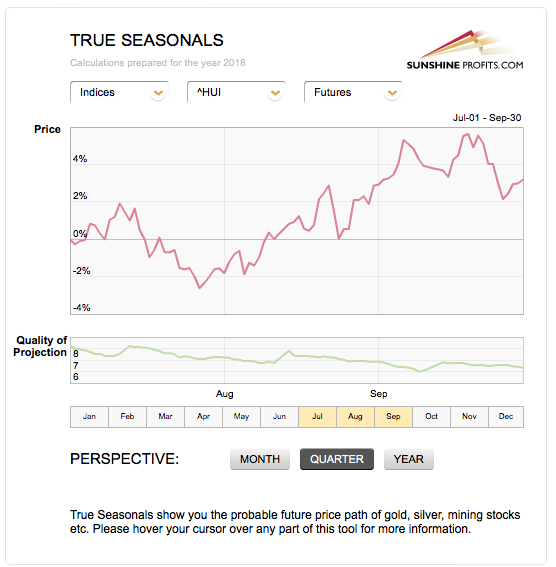
The early part of the month tends to be positive for the precious metals, but we are likely to see a decline later on. Please note that earlier today, when we featured the GDX ETF chart, we wrote (on the chart) that the next cyclical turning point is on September 24th. This is in tune with the above – we might see a short-term bottom close to September 24th.
Based on what we see on the other charts, it seems that this could be the start of the final corrective upswing before the final slide to THE bottom. In this scenario THE bottom would take place in about a month – in the first half of October.
Triangles and Reversals
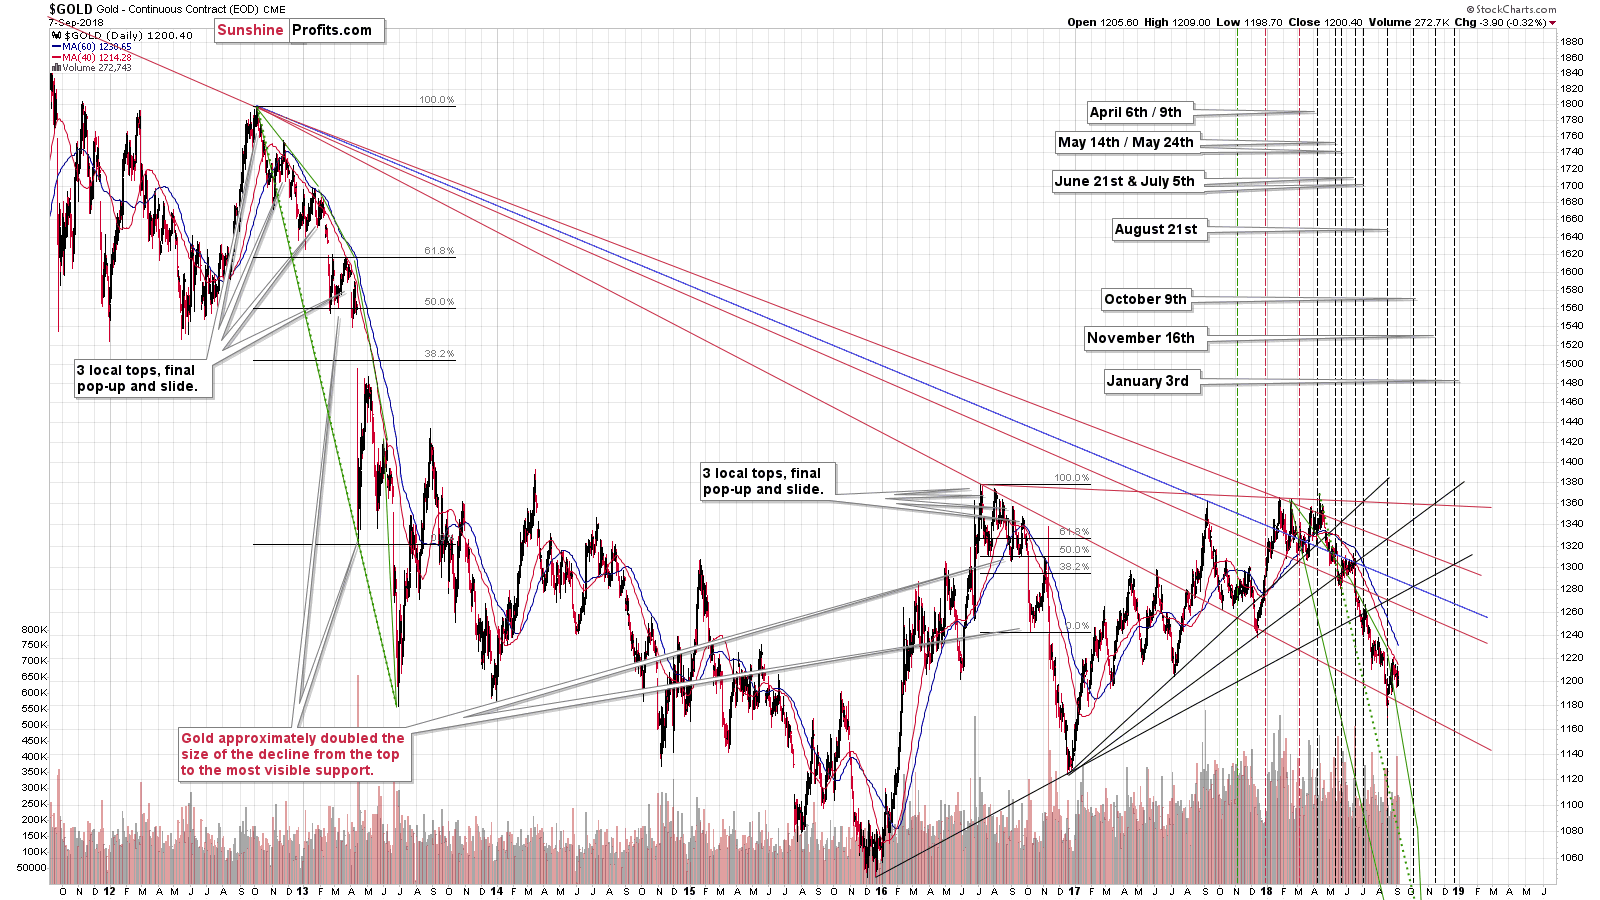
In case of the gold chart, we have a triangle-vertex-based reversal on October the 9th, which is in tune with what we wrote earlier today.
In case of the silver chart, we have a triangle-vertex-based reversal on Wednesday, September the 12th, but it might be the case that the reversal actually describes the end of the current consolidation. Perhaps we’ll see a very brief move higher that is followed by bigger declines. Silver tends to outperform on a very short-term basis right before sliding, so we might see something similar this week.
In case of the HUI Index chart, we have the next triangle-vertex-based reversal on September the 17th. It’s right between today and the September the 24th – the date of the cyclical turning point for the mining stocks.
Consequently, it might be the case that we see a powerful decline for a week, then a correction starts on September the 17th and it ends a week later – on September the 24th. It’s a tough call to say which scenario will take place. At this time both seem quite possible. How to approach the market given this uncertainty? The same way we normally approach it. We will be on a lookout for bullish signs and if we see a combination of them close to one of the reversal dates, we will likely adjust the current short position, taking all or some of the profits off the table. If we don’t see the bearish signs, we’ll probably stick to the “trend is your friend” approach.
Important Analyses
Before summarizing, we would like to emphasize that we have recently posted several analyses that are very important and that one should keep in mind, especially in the next several weeks. If you haven’t had the chance of reading them previously, we encourage you to do so today:
- Dear Gold Investor - Letters from 2013 - Analogy to 2013, which should make it easier to trade the upcoming sizable upswing (if enough factors point to it, that is) and to enter the market close to the final bottom.
- Gold to Soar Above $6,000 - discussion of gold’s long-term upside target of $6,000.
- Preparing for THE Bottom in Gold: Part 6 – What to Buy - extremely important analysis of the portfolio structure for the next huge, multi-year rally in the precious metals.
- Preparing for THE Bottom in Gold: Part 7 – Buy-and-hold on Steroids – description of a strategy dedicated to significantly boosting one’s long-term investment returns while staying invested in the PM sector.
- Gold’s Downside Target, Upcoming Rebound, and Miners’ Buy Plan - details regarding the shape of the following price moves, a buying plan for mining stocks, and a brief discussion of the final price targets for the current decline.
- Gold: What Happened vs. What Changed – discussion of the latest extreme readings from gold’s CoT report
- Key Factors for Gold & Silver Investors - discussion of key, long-term factors that support the bearish outlook for PMs. We are often asked what makes us so bearish – this article is a reply to this question.
Summary
Summing up, we have multiple signs for the precious metals sector that are very strongly bearish, and we have just one day of relative strength in the mining stocks. It’s multiple times more likely than not that the latter was rather accidental and that the overall trend remains bearish. In fact, it’s very likely that the pause in the precious metals market is over and the next big move down is already underway. The move is likely to be sharp and the profits on the current short position are likely to change from being huge to being enormous and then finally to being ridiculous.
As always, we’ll keep you – our subscribers – informed.
To summarize:
Trading capital (supplementary part of the portfolio; our opinion): Full short positions (250% of the full position) in gold, silver and mining stocks are justified from the risk/reward perspective with the following stop-loss orders and exit profit-take price levels:
- Gold: profit-take exit price: $1,062; stop-loss: $1,226; initial target price for the DGLD ETN: $82.96; stop-loss for the DGLD ETN $53.67
- Silver: profit-take exit price: $12.72; stop-loss: $15.16; initial target price for the DSLV ETN: $46.97; stop-loss for the DSLV ETN $31.37
- Mining stocks (price levels for the GDX ETF): profit-take exit price: $13.12; stop-loss: $19.61; initial target price for the DUST ETF: $80.97; stop-loss for the DUST ETF $33.37
Note: the above is a specific preparation for a possible sudden price drop, it does not reflect the most likely outcome. You will find a more detailed explanation in our August 1 Alert. In case one wants to bet on junior mining stocks’ prices (we do not suggest doing so – we think senior mining stocks are more predictable in the case of short-term trades – if one wants to do it anyway, we provide the details), here are the stop-loss details and target prices:
- GDXJ ETF: profit-take exit price: $17.52; stop-loss: $29.43
- JDST ETF: initial target price: $154.97 stop-loss: $64.88
Long-term capital (core part of the portfolio; our opinion): No positions (in other words: cash)
Insurance capital (core part of the portfolio; our opinion): Full position
Important Details for New Subscribers
Whether you already subscribed or not, we encourage you to find out how to make the most of our alerts and read our replies to the most common alert-and-gold-trading-related-questions.
Please note that the in the trading section we describe the situation for the day that the alert is posted. In other words, it we are writing about a speculative position, it means that it is up-to-date on the day it was posted. We are also featuring the initial target prices, so that you can decide whether keeping a position on a given day is something that is in tune with your approach (some moves are too small for medium-term traders and some might appear too big for day-traders).
Plus, you might want to read why our stop-loss orders are usually relatively far from the current price.
Please note that a full position doesn’t mean using all of the capital for a given trade. You will find details on our thoughts on gold portfolio structuring in the Key Insights section on our website.
As a reminder – “initial target price” means exactly that – an “initial” one, it’s not a price level at which we suggest closing positions. If this becomes the case (like it did in the previous trade) we will refer to these levels as levels of exit orders (exactly as we’ve done previously). Stop-loss levels, however, are naturally not “initial”, but something that, in our opinion, might be entered as an order.
Since it is impossible to synchronize target prices and stop-loss levels for all the ETFs and ETNs with the main markets that we provide these levels for (gold, silver and mining stocks – the GDX ETF), the stop-loss levels and target prices for other ETNs and ETF (among other: UGLD, DGLD, USLV, DSLV, NUGT, DUST, JNUG, JDST) are provided as supplementary, and not as “final”. This means that if a stop-loss or a target level is reached for any of the “additional instruments” (DGLD for instance), but not for the “main instrument” (gold in this case), we will view positions in both gold and DGLD as still open and the stop-loss for DGLD would have to be moved lower. On the other hand, if gold moves to a stop-loss level but DGLD doesn’t, then we will view both positions (in gold and DGLD) as closed. In other words, since it’s not possible to be 100% certain that each related instrument moves to a given level when the underlying instrument does, we can’t provide levels that would be binding. The levels that we do provide are our best estimate of the levels that will correspond to the levels in the underlying assets, but it will be the underlying assets that one will need to focus on regarding the signs pointing to closing a given position or keeping it open. We might adjust the levels in the “additional instruments” without adjusting the levels in the “main instruments”, which will simply mean that we have improved our estimation of these levels, not that we changed our outlook on the markets. We are already working on a tool that would update these levels on a daily basis for the most popular ETFs, ETNs and individual mining stocks.
Our preferred ways to invest in and to trade gold along with the reasoning can be found in the how to buy gold section. Additionally, our preferred ETFs and ETNs can be found in our Gold & Silver ETF Ranking.
As a reminder, Gold & Silver Trading Alerts are posted before or on each trading day (we usually post them before the opening bell, but we don't promise doing that each day). If there's anything urgent, we will send you an additional small alert before posting the main one.
=====
Latest Free Trading Alerts:
The broad stock market slightly extended its short-term downtrend on Friday, as investors continued taking profits off the table after the recent record-breaking rally. However, the S&P 500 index remains relatively close to its record high. Is this a topping pattern or just pause before another leg up?
Upward Reversal or Just Rebound?
=====
Hand-picked precious-metals-related links:
PRECIOUS-Gold falls further as rate hike views, trade war worries buoy dollar
'Will I Come Back Dead?' Human Costs of South African Gold
Funds Resume Gold Bear Bet Before Jobs Dent `Worst Is Over' View
India's Gold imports shoot up in August
Iran gives permission to exchange offices to import gold, currency banknotes
Congressmen Introduce Bill to End Taxation of Gold and Silver
Perth Mint unveils Australia's most expensive gold-diamond coin
Roman Gold Coins That Could Be Worth Millions Unearthed In Northern Italy
=====
In other news:
World shares face longest losing streak since January 2016
A stock-market bear signal is at a more-than-4-decade high, says Goldman
Swiss franc drops as Italian optimism dents safety bid
Turkish economic growth dips, lira crisis darkens outlook
ETF Brings Credit Derivatives Loved by Hedge Funds to the Masses
Oil up as U.S. drilling stalls, Iranian sanctions bite
Lightyear buys U.S. blockchain start-up Chain; to move business to Stellar
Crypto Wipeout Deepens to $640 Billion as Ether Leads Declines
Joseph Stiglitz on artificial intelligence: 'We’re going towards a more divided society'
=====
Thank you.
Sincerely,
Przemyslaw Radomski, CFA
Founder, Editor-in-chief, Gold & Silver Fund Manager
Gold & Silver Trading Alerts
Forex Trading Alerts
Oil Investment Updates
Oil Trading Alerts

