

Briefly: In our opinion, small (100% of the regular size of the position) speculative long positions in gold, silver and mining stocks are justified from the risk/reward perspective at the moment of publishing this alert. In other words, we are doubling the size of the current long position.
In the previous alerts, we emphasized that a lot changed from the short-term point of view, even though price changes themselves were small and we argued that closing our short position on Tuesday had been justified. Mining stocks soared by over 3% making yesterday’s session the biggest daily rally since August. A lot has changed indeed. Will the rally continue for much longer?
Let’s take a look at the chart to find out, starting with the chart that was the first to indicate that the decline is ending – platinum (chart courtesy of http://stockcharts.com).
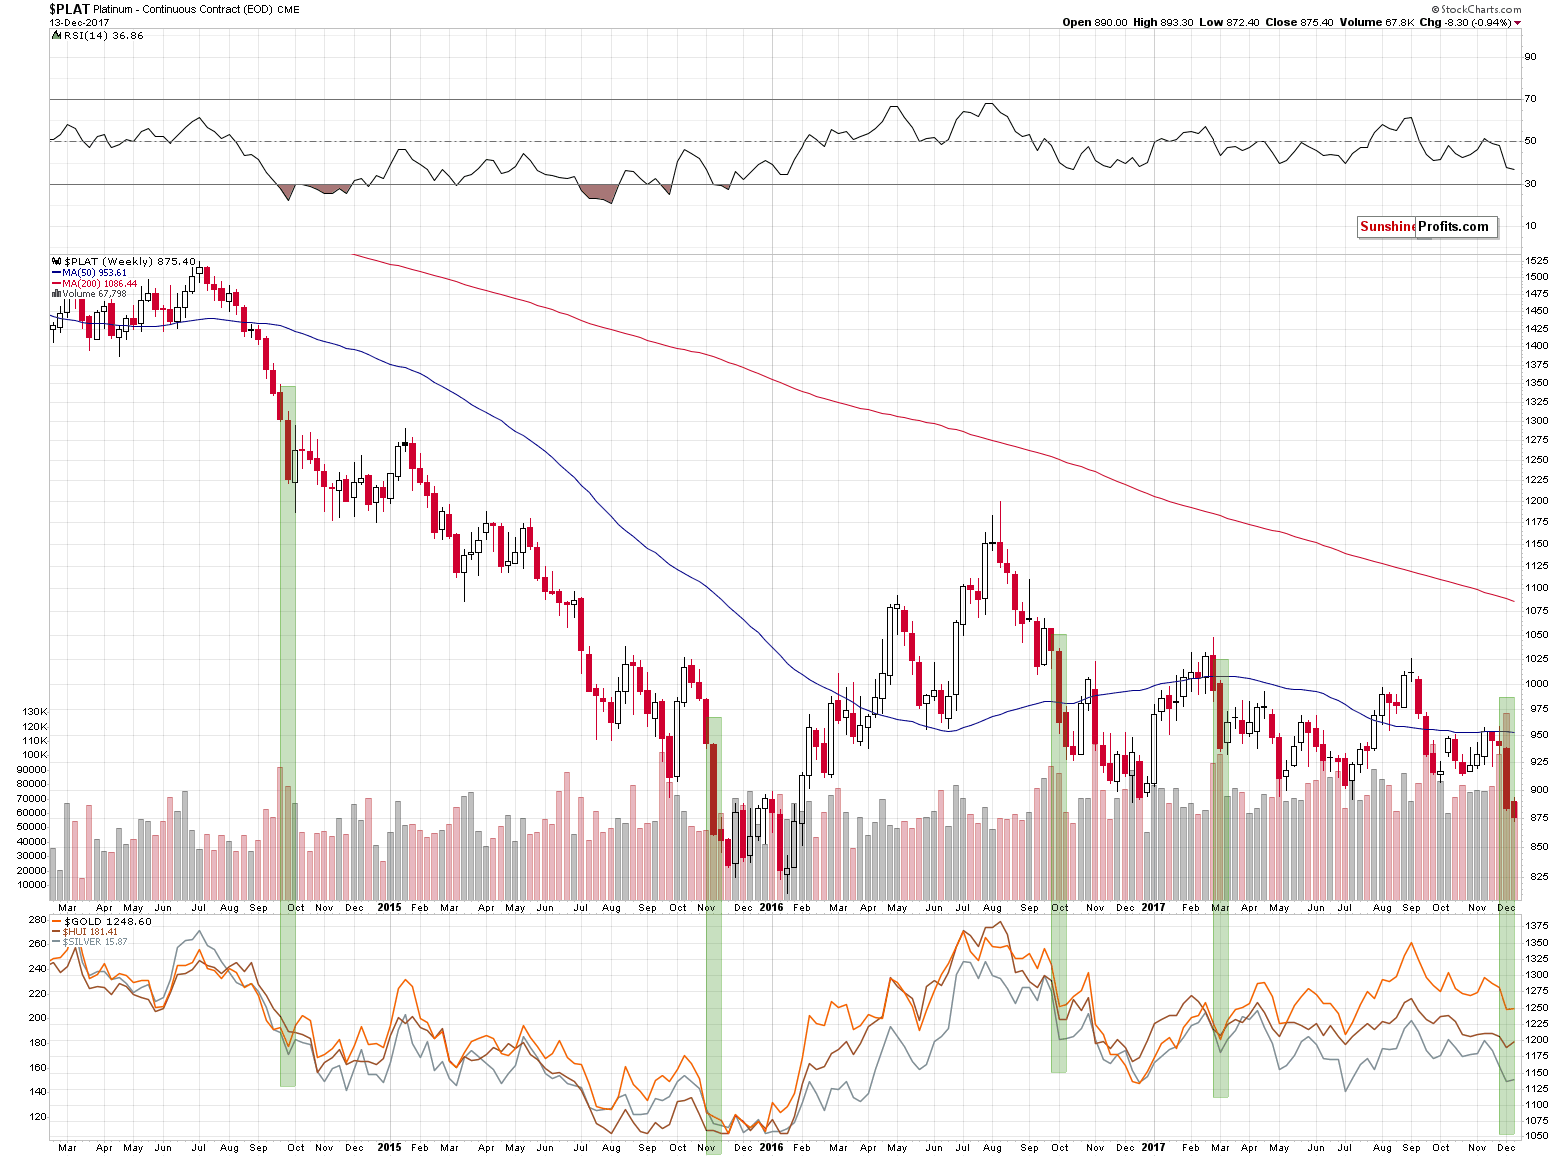
On Monday, we wrote the following based on the previous week’s price changes in platinum:
As odd as it may sound, whenever platinum declined in a very profound way (about 5% in a week), it meant that either a corrective upswing was about to start in the following week (2014, 2016) or that a decline had just ended (2015, March 2017). We’ve seen this phenomenon 4 times in the recent years and in each case, it had bullish implications. 4 out of 4, meaning 100% efficiency is not something that should be ignored.
Does it mean that the precious metals sector will soar immediately? No. The above chart is based on weekly candlesticks in the case of platinum and weekly closing prices in the case of gold, silver and the HUI Index that are visible in the lower part of the above chart. Consequently, whatever implications the above chart has, they are in terms of the next week’s closing prices. So, gold, silver and mining stock are likely to end the next week higher, but not necessarily rally in its first part.
We previously mentioned that the Fed interest rate decision day could mark a turning point or we could see the interim bottom very close to it. The above chart supports this outlook and it suggests that we should be prepared to either exit the short positions or to switch to long ones. We are considering both options and which decision we take will depend on the confirmations that we get in the meantime.
The above does not only tell us that the precious metals market was about to bottom (we can already see that it did), but it also shows what kind of move we can expect.
Back in September 2014, gold rallied about $50, in 2016 it soared by about $80 (but about $50 in terms of weekly closing prices) and earlier this year gold moved higher by about $90. The 2015 bottom resulted in much bigger temporary gains.
The difference between the above cases is quite significant. The reason could be that in two cases, the big weekly decline in platinum took place during bigger declines and in two cases it took place either at the end of the big decline or within a bigger rally.
Since there are multiple reasons to believe that the precious metals sector is in a bigger decline, it seems that we should focus on the analogy to the 2014 and 2016 analogies.
As we wrote earlier, in the first case gold rallied about $65 in terms of intraday highs and about $50 in weekly closing prices. In the second case, it rallied by $80 or $50, using analogous measures. What does it tell us? It’s gives a hint that gold is likely to rally $50 - $80 from the bottom and that the lower part of this range is more likely.
But, before moving further, let’s consider how much we can trust the above technique, given that there are only two very similar cases. Based on our experience, it seems that we should use it as a general guideline only. In other words, it makes us think that the upswing is not a one-day event, but also that it’s not something that is about to trigger a $100+ rally. In other words, we plan to use it as a confirmation of other techniques rather than a tool for setting the profit-take levels for our long trading positions.
Ok, so how high can gold rally then?
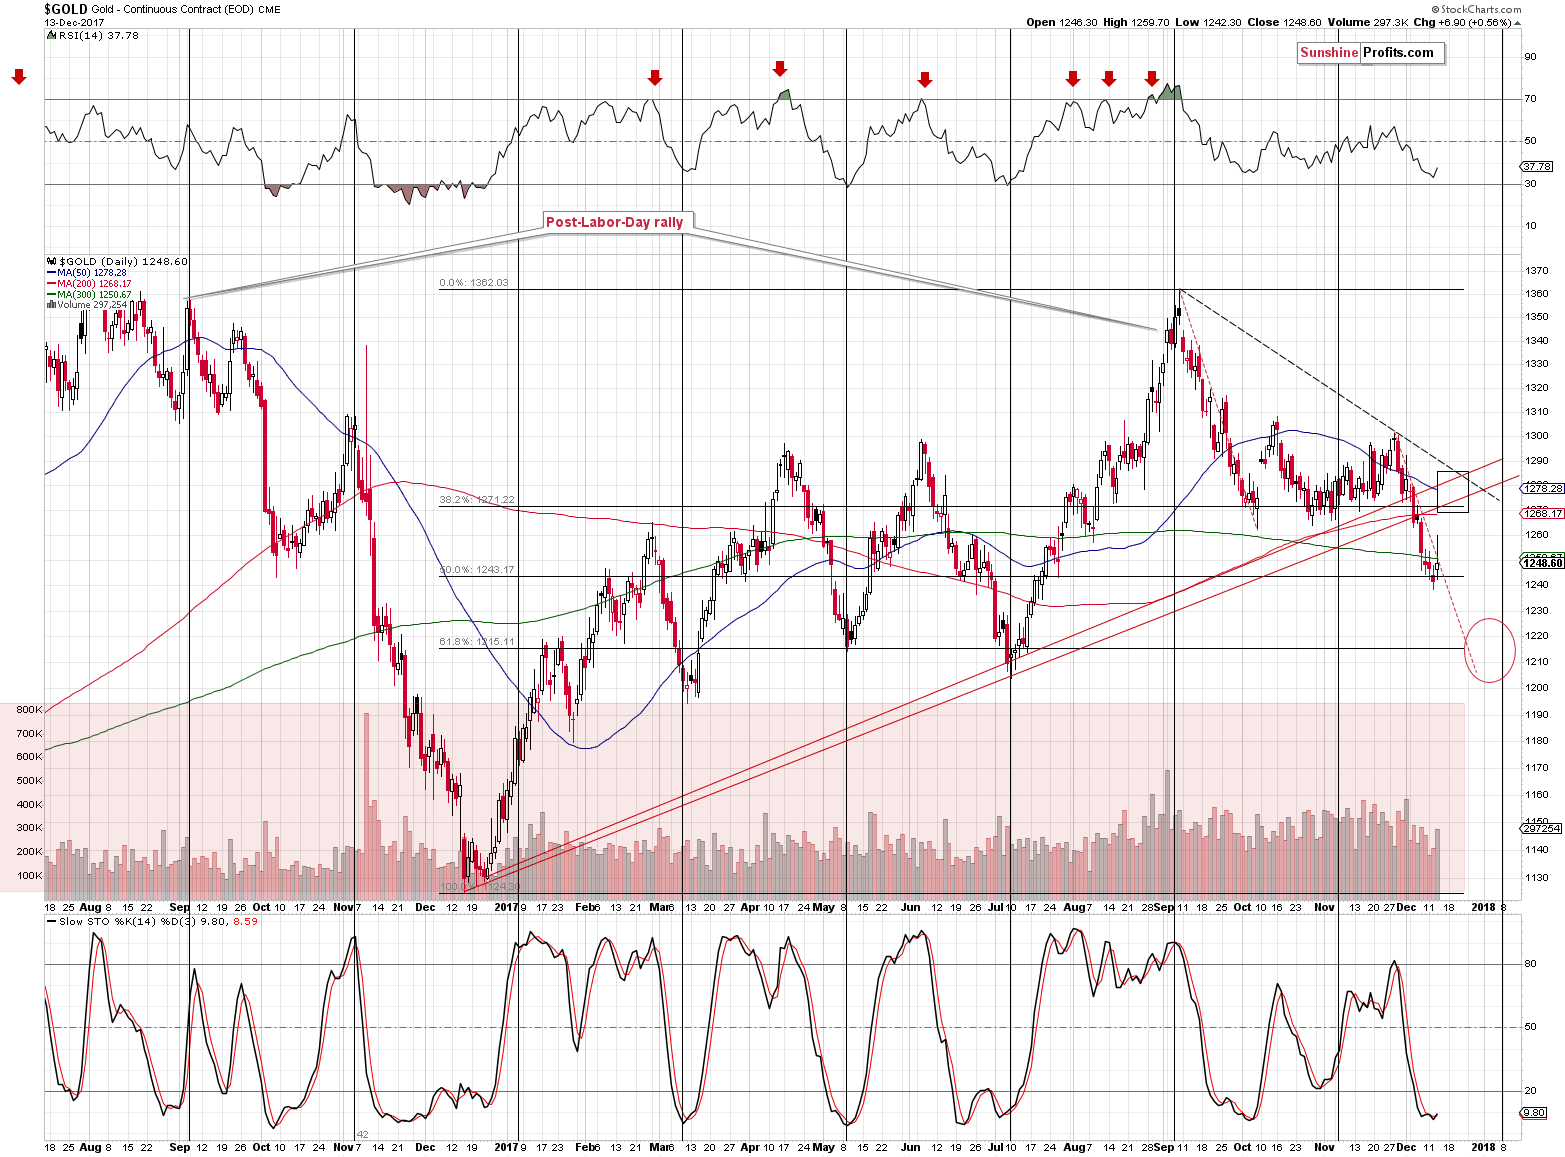
To $1,270 - $1,290. That’s the target price range that includes most of the nearby resistance levels: the October and November lows in terms of the closing prices, the rising red support lines that were recently broken, the declining dashed resistance line, and the 50-day moving average.
The interesting thing about the 50-day MA is that the last two times when the price of gold moved to it, it actually broke it insignificantly and then started another downswing. If the history is to rhyme, we’re likely to see gold temporarily above $1,280 and then another slide.
The volume during yesterday’s upswing was sizable, which confirms the bullish outlook. The price change that’s visible on the above chart is likely incorrect – gold ended the session without the reversal that the above chart shows (and at the moment of writing these words, gold is trading at $1,255).
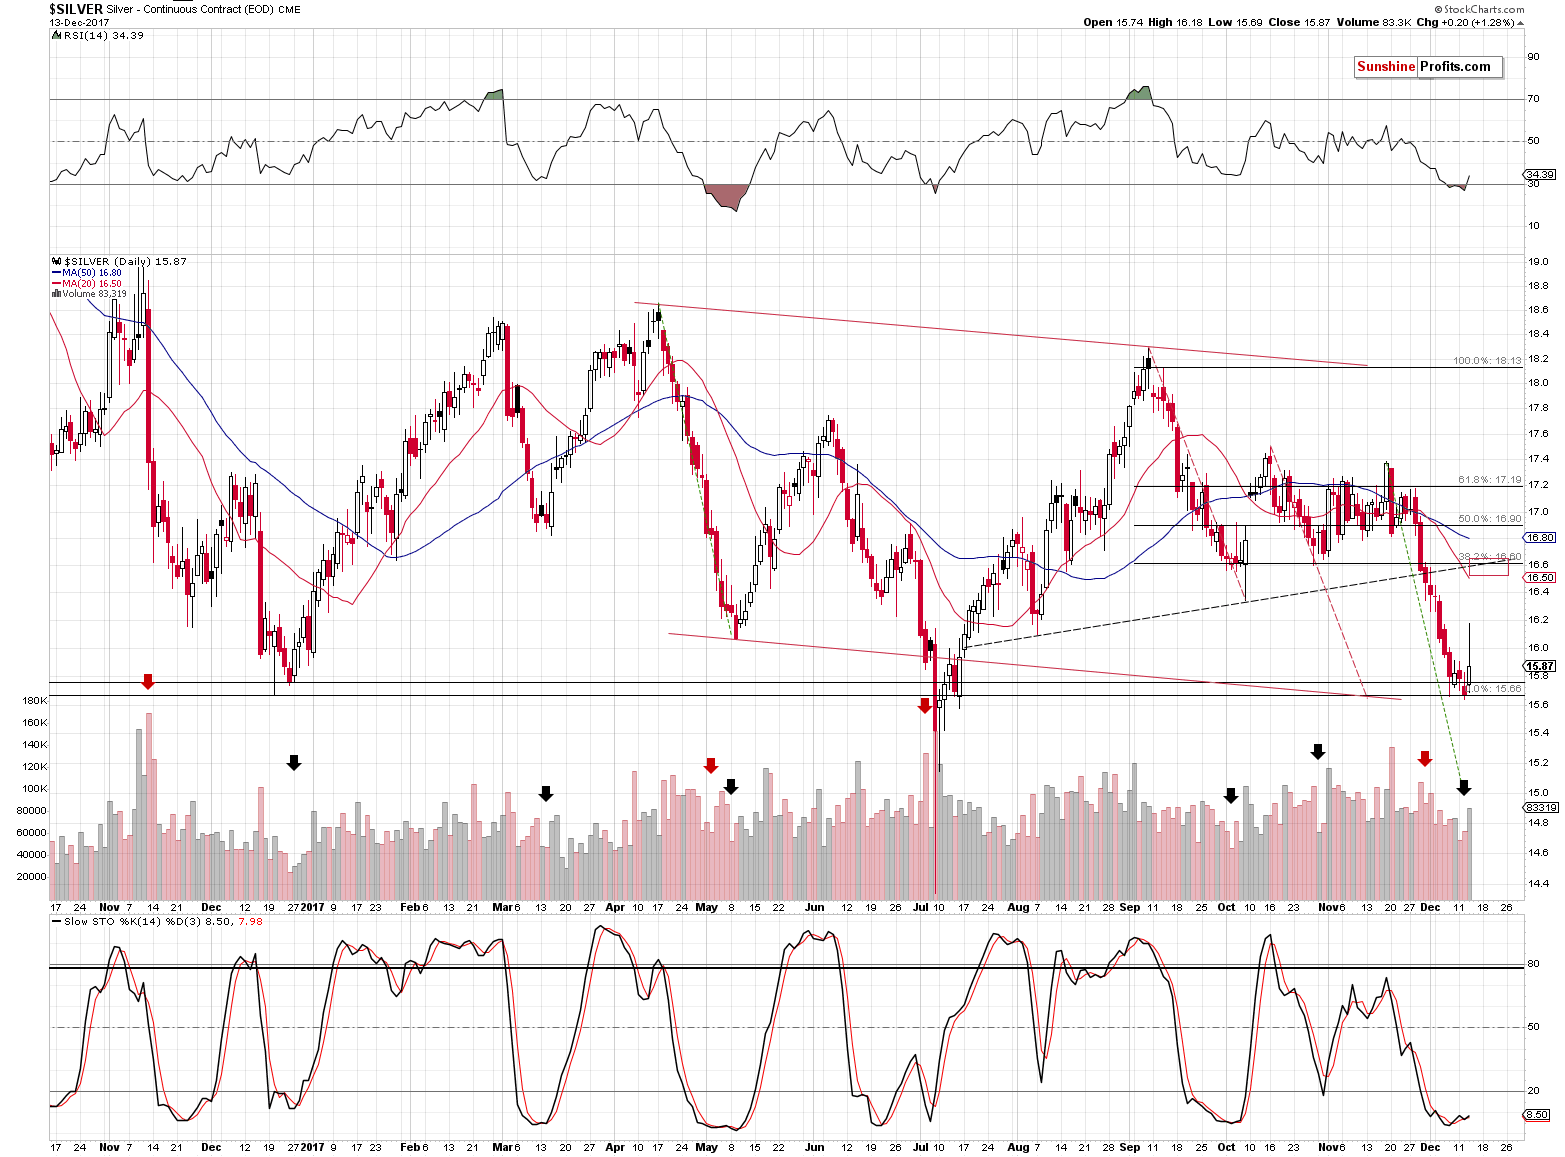
The note regarding the price applies also to the silver chart – silver is trading above $16, not well below it. It’s not after a major reversal.
There are also a few techniques that we used to provide the upside target for the white metal at about $16.60. Similarly to the situation in gold, we have silver’s rising dashed resistance line and the October and November lows. However, instead of a moving average that worked a few times in the past, we have the first Fibonacci retracement level.
Interestingly, we first applied the Fibonacci retracement on the above chart without knowing for certain where the bottom was going to form – that was one of the tools used to predict it. Back in October, we explained the target for silver in the following way:
The first technique that we used is to apply the size of the decline that’s analogous to the previous (September – October) one. Why? Because that’s what appears likely to be seen in gold. Both metals don’t have to move in tandem, but they often do, so that’s one way to detect the upcoming target. By the way, based on our experience, using relative valuations (applying analogous price moves to analogous moments) is in most cases superior to assuming that the gold:silver ratio remains unchanged as the former also assumes a continuation in the most recent trend in the ratio. A trend’s continuation is usually more likely than a sudden stop in it.
The second technique is to apply the Phi number. It’s usually applied through Fibonacci retracement levels, but it can work also in a different way. By connecting the previous extremes, one can apply the Fibonacci extensions to arrive at a target level. In this case, we used the September and October lows in terms of the daily closing prices.
The size of the September – October decline is about $1.50 and multiplying this by 1.618 gives $2.427. Deducting that from $18.12 provides us with $15.69 as the target. We illustrated the above with red Fibonacci lines.
The third technique is applying the April – May decline to the September high (red declining lines illustrate it).
The fourth technique is using the December 2016 lows (intraday and the closing price) as support levels. Naturally, there also the July extremes, but they are not as aligned with other price levels.
All the above techniques point to the target range between $15.65 and $15.75. In order to increase the odds of completing the transaction it seems that the exit price should be set a little above it and that’s why we set it at $15.82.
It turned out that the target set almost 2 months ago was hit in a very precise way and we managed to exit the short positions even lower than we aimed at that time.
Moving back to the current upside target, the important thing to keep in mind is that silver tends to outperform gold in a profound way right before the top. This is something that we are monitoring the market for right now, but it’s not important just because it’s an invaluable confirmation tool. It’s also important because it means that silver’s upside targets should not be viewed as carved in stone. If gold doesn’t reach its target, but silver moves very close to it without very short-term outperformance, then it will mean that silver is likely to rally even higher before the final top is in.
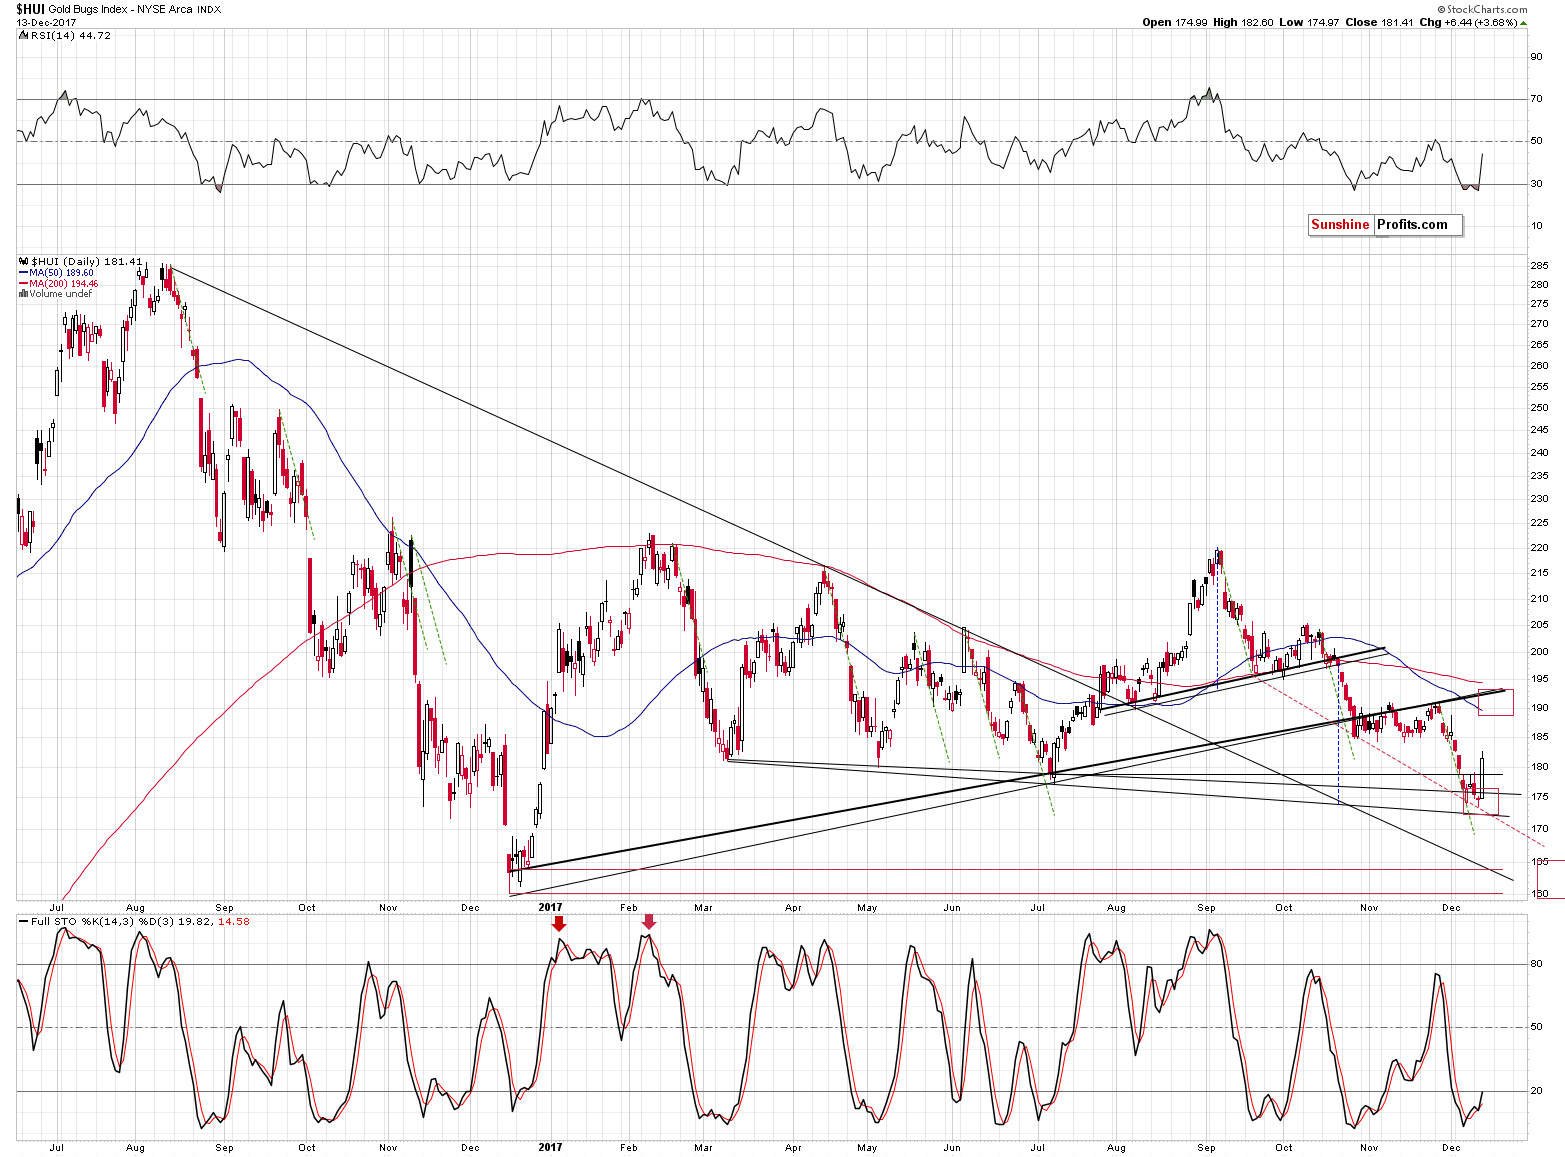
Gold stocks bottomed at the target indicated by the head-and-shoulders pattern (the blue, dashed lines) and they soared substantially yesterday.
How high can they go? The breakdown below the rising black support/resistance lines was verified by almost a month of back-and-forth trading right below it, so it seems that this line should also keep the current rally in check. This line is strong enough on its own, but it’s additionally strengthened by the November highs and the proximity of the 200-day moving average.
The 200-day MA is something that stopped rallies several times this year, so it shouldn’t be ignored. At this time, it’s above the rising support line, but since the latter is moving higher and the MA is declining, they are likely to converge in a few days.
The above provides us with the 190 - 195 target area, with the 194 level being the most likely level.
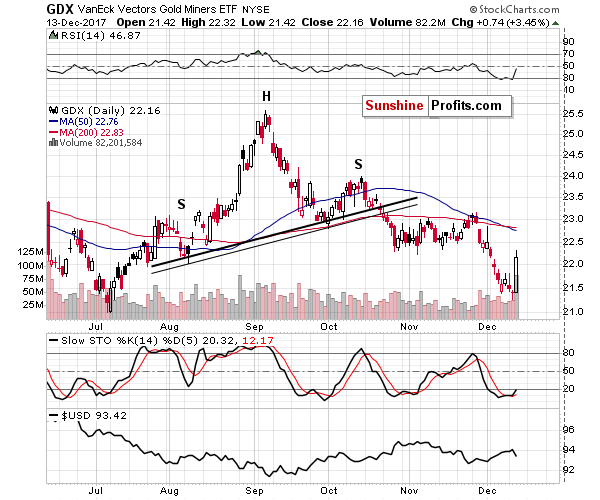
In the case of the GDX ETF, the above translates into a move slightly above the $23 level – above the November highs.
But doesn’t the short-term rally invalidate the bearish outlook and all the long-term analogies that you guys previously featured?
No.
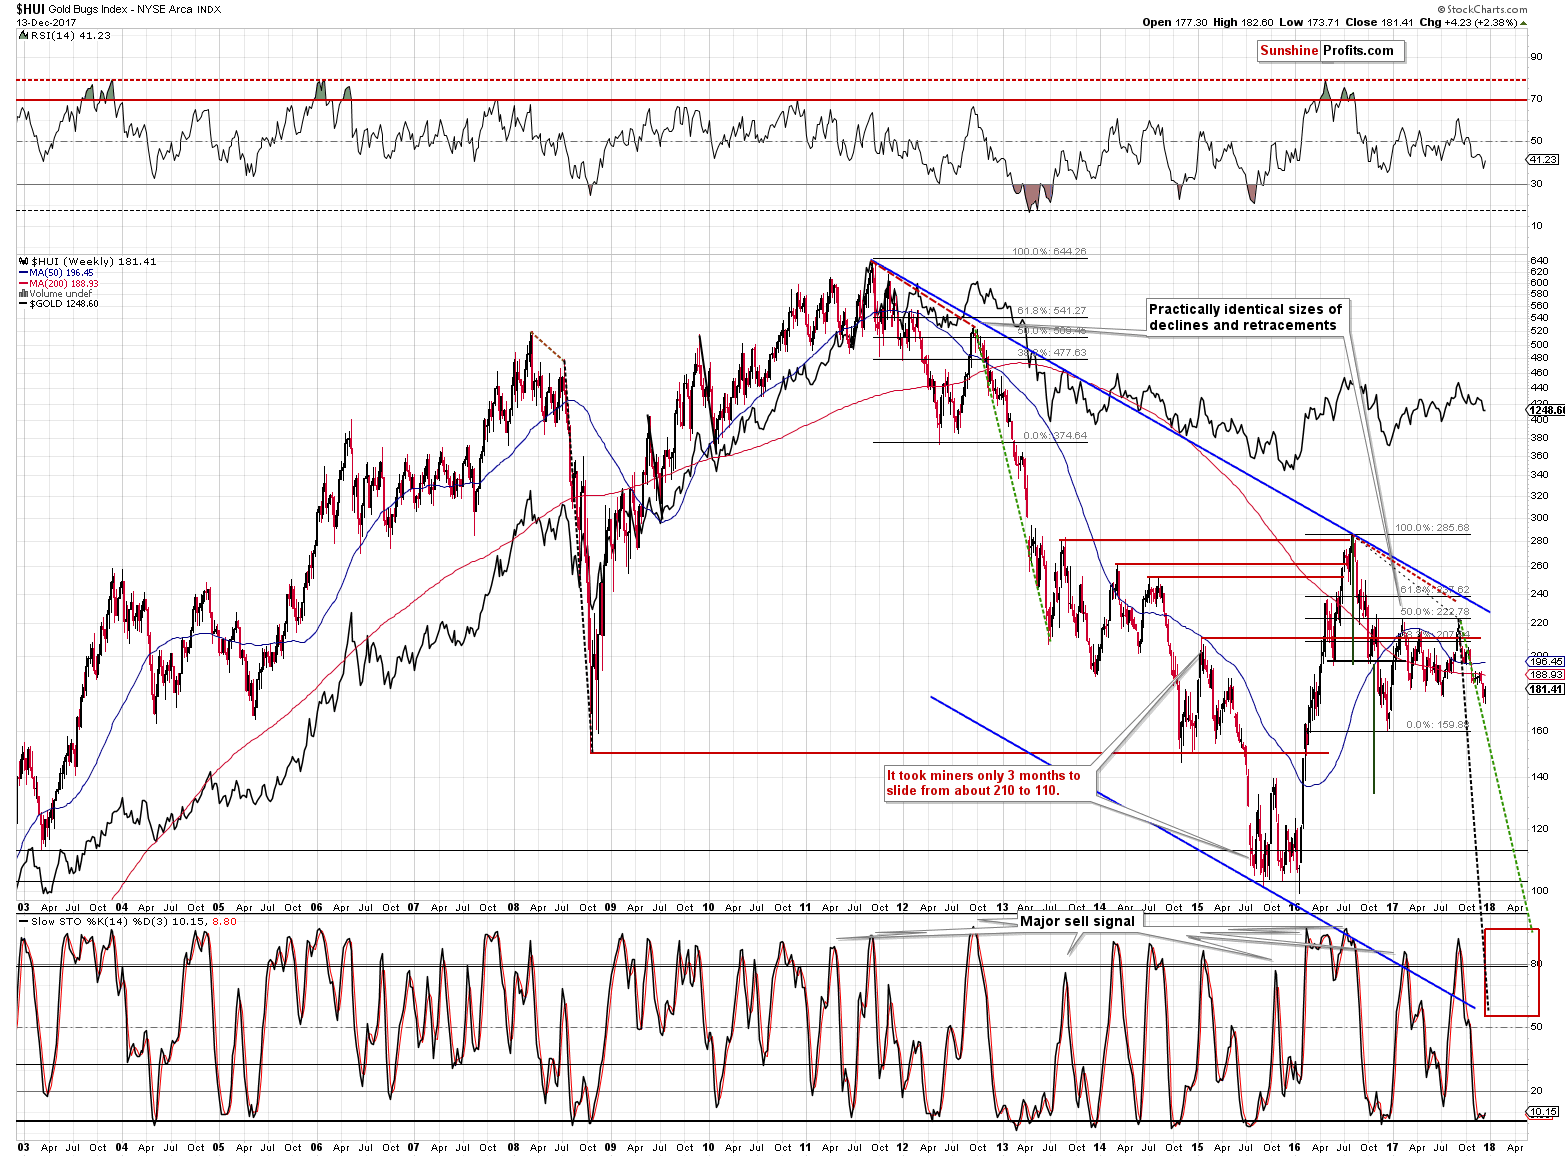
From the long-term point of view, the HUI Index is declining very much in tune with the way it declined in late 2012 and in early 2013. It’s sliding decisively but remains above the declining dashed, green line. The analogy remains intact.
Moreover, even if we see a quick (1-2 weeks) rally, which appears quite likely, the decline will still be similar to what happened about 5 years ago as back then gold stocks also corrected a few times.
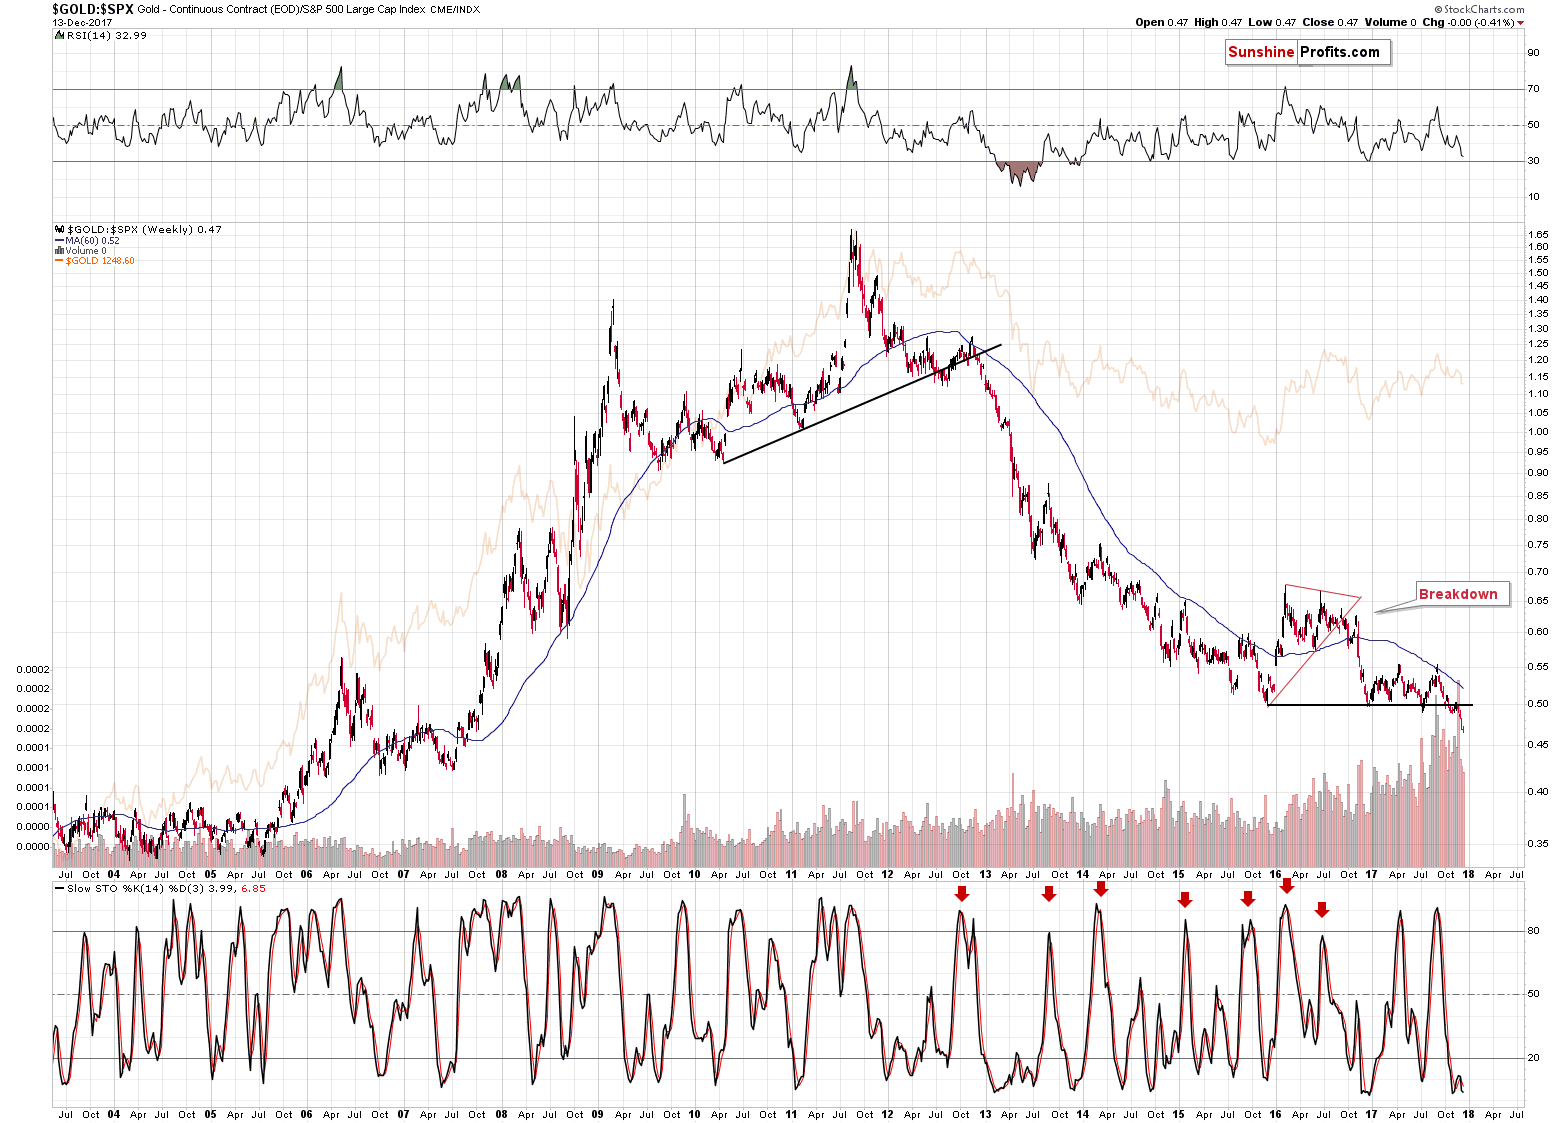
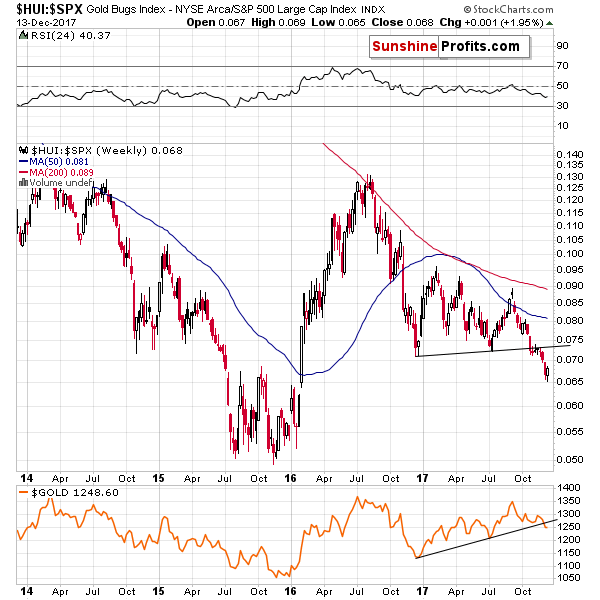
Additionally, let’s not forget that gold’s and gold stocks’ ratios with the general stock market have recently broken below major long-term support levels. Corrections after breakdowns are not invalidating them – in fact, they are quite natural. Unless the breakdowns are invalidated, the outlook will most likely not change.
Summing up, the medium-term outlook for the precious metals market didn’t change based on this and last week’s developments and it remains bearish, but the short-term outlook improved significantly. Before the end of yesterday’s session, it was not certain if mining stocks would really close it higher, outperforming gold to a great extent, but it’s clear now. With the short-term outlook being more bullish, we are increasing the size of the current speculative long position to 100%. Naturally, it doesn’t mean using one’s all capital for a given trade, but rather to use the standard size of capital that is normally used. We are also moving the initial target level for gold and UGLD higher – to levels that are more in line with today’s analysis.
Also, please note that the “initial target levels” are… initial. These are not set to be binding exit prices just yet – we might turn them into final profit-take prices in the future, but for now it seems that waiting for individual signs and confirmations (such as silver’s sudden outperformance) for closing the position is a better idea.
As always, we will keep you – our subscribers – informed.
To summarize:
Trading capital (supplementary part of the portfolio; our opinion): Long positions (100% of the full position) in gold, silver and mining stocks are justified from the risk/reward perspective with the following stop-loss orders and initial targets:
- Gold: initial target level: $1,279; stop-loss: $1,236; initial target level for the UGLD ETN: $10.58; stop-loss for the UGLD ETN $9.38
- Silver: initial target level: $16.48; stop-loss: $15.58; initial target level for the USLV ETN: $11.18; stop-loss for the USLV ETN $8.88
- Mining stocks (price levels for the GDX ETF): initial target level: $22.97; stop-loss: $21.08; initial target level for the NUGT ETF: $30.18; stop-loss for the NUGT ETF $23.78
In case one wants to bet on junior mining stocks' prices (we do not suggest doing so – we think senior mining stocks are more predictable in the case of short-term trades – if one wants to do it anyway, we provide the details), here are the stop-loss details and exit prices:
- GDXJ ETF: initial target level: $33.48; stop-loss: $29.78
- JNUG ETF: initial target level: $17.38; stop-loss: $11.78
Long-term capital (core part of the portfolio; our opinion): No positions (in other words: cash)
Insurance capital (core part of the portfolio; our opinion): Full position
Important Details for New Subscribers
Whether you already subscribed or not, we encourage you to find out how to make the most of our alerts and read our replies to the most common alert-and-gold-trading-related-questions.
Please note that the in the trading section we describe the situation for the day that the alert is posted. In other words, it we are writing about a speculative position, it means that it is up-to-date on the day it was posted. We are also featuring the initial target prices, so that you can decide whether keeping a position on a given day is something that is in tune with your approach (some moves are too small for medium-term traders and some might appear too big for day-traders).
Plus, you might want to read why our stop-loss orders are usually relatively far from the current price.
Please note that a full position doesn’t mean using all of the capital for a given trade. You will find details on our thoughts on gold portfolio structuring in the Key Insights section on our website.
As a reminder – “initial target price” means exactly that – an “initial” one, it’s not a price level at which we suggest closing positions. If this becomes the case (like it did in the previous trade) we will refer to these levels as levels of exit orders (exactly as we’ve done previously). Stop-loss levels, however, are naturally not “initial”, but something that, in our opinion, might be entered as an order.
Since it is impossible to synchronize target prices and stop-loss levels for all the ETFs and ETNs with the main markets that we provide these levels for (gold, silver and mining stocks – the GDX ETF), the stop-loss levels and target prices for other ETNs and ETF (among other: UGLD, DGLD, USLV, DSLV, NUGT, DUST, JNUG, JDST) are provided as supplementary, and not as “final”. This means that if a stop-loss or a target level is reached for any of the “additional instruments” (DGLD for instance), but not for the “main instrument” (gold in this case), we will view positions in both gold and DGLD as still open and the stop-loss for DGLD would have to be moved lower. On the other hand, if gold moves to a stop-loss level but DGLD doesn’t, then we will view both positions (in gold and DGLD) as closed. In other words, since it’s not possible to be 100% certain that each related instrument moves to a given level when the underlying instrument does, we can’t provide levels that would be binding. The levels that we do provide are our best estimate of the levels that will correspond to the levels in the underlying assets, but it will be the underlying assets that one will need to focus on regarding the signs pointing to closing a given position or keeping it open. We might adjust the levels in the “additional instruments” without adjusting the levels in the “main instruments”, which will simply mean that we have improved our estimation of these levels, not that we changed our outlook on the markets. We are already working on a tool that would update these levels on a daily basis for the most popular ETFs, ETNs and individual mining stocks.
Our preferred ways to invest in and to trade gold along with the reasoning can be found in the how to buy gold section. Additionally, our preferred ETFs and ETNs can be found in our Gold & Silver ETF Ranking.
As a reminder, Gold & Silver Trading Alerts are posted before or on each trading day (we usually post them before the opening bell, but we don't promise doing that each day). If there's anything urgent, we will send you an additional small alert before posting the main one.
=====
Latest Free Trading Alerts:
Yesterday, the Fed released its most recent monetary policy statement. How can it affect the financial markets?
December 2017 FOMC Meeting and Gold
S&P 500 index lost 0.05% on Wednesday, following move to new record high, as investors reacted to the Fed's interest rate hike. Will uptrend continue? Or is this a topping pattern ahead of downward correction?
Fed Takes Action, Stock Market Topping?
=====
Hand-picked precious-metals-related links:
PRECIOUS-Gold edges back from 1-week high as dollar recovers
Lonmin agrees to £285m takeover by Sibanye-Stillwater
=====
In other news:
European Stocks Fall Before ECB; Dollar Steady: Markets Wrap
SNB signals potential policy shift by raising inflation outlook
Bitcoin futures could reportedly be coming to Germany soon
Gibraltar launches financial services license for blockchain
Federal Communications Commission set to reverse net neutrality rules
=====
Thank you.
Sincerely,
Przemyslaw Radomski, CFA
Founder, Editor-in-chief, Gold & Silver Fund Manager
Gold & Silver Trading Alerts
Forex Trading Alerts
Oil Investment Updates
Oil Trading Alerts

