

Briefly: In our opinion, full (150% of the regular full position) speculative short positions in gold, silver and mining stocks are justified from the risk/reward perspective at the moment of publishing this alert.
During yesterday’s week, we saw breakdowns and major declines in all parts of the precious metals sector. Even the HUI to gold ratio broke below the key low. Yet, there is something that we saw based on last week’s closing prices that had 100% bullish efficiency in the past few years. What is it and how we can use this knowledge?
Before moving to the details of the above bullish sign, let’s check what changed in gold, silver and mining stocks. There’s a lot of charts that we would like to cover today, so let’s move right to them (chart courtesy of http://stockcharts.com).
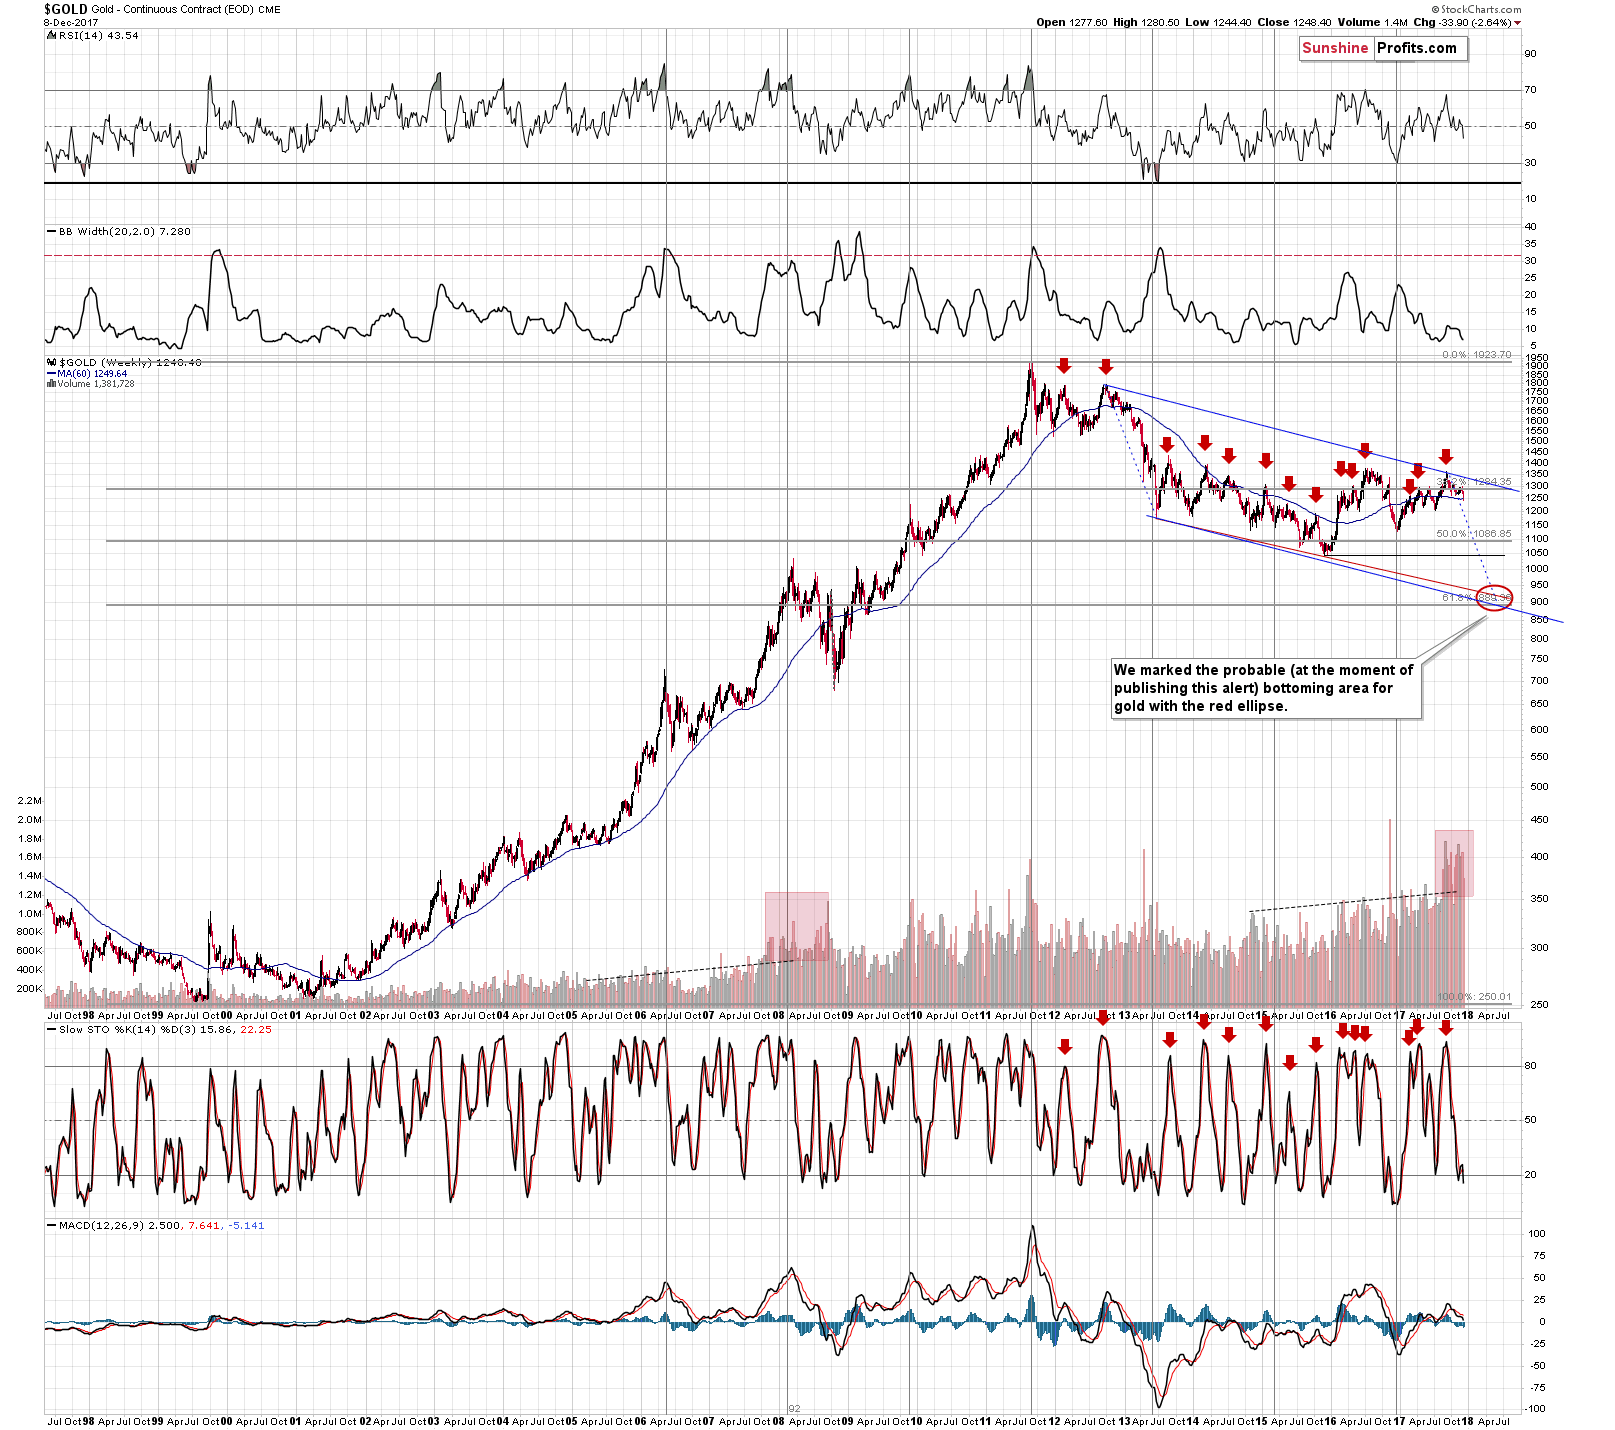
First of all, we would like to emphasize that the analogy to what we saw in 2008 before the big slide remains in place as the weekly volume levels continue to be exceptionally high. In other words, what we wrote about the above last week, remains up-to-date:
Yes, the volume has been growing almost constantly, but the 2008 and 2017 buildups in volume still stand out. The growth is much sharper than in other years and no other period is comparable to those years. Since the 2008 volume buildup was followed by a sharp decline in the precious metals sector, it seems that we might see something similar also this and/or the next year.
The thing that we would additionally like to point out on the above chart is that gold moved to (and closed the week below) the 60-week moving average. It had already moved close to this level in early October, but corrected shortly thereafter. Why do we mention this while discussing the long-term gold chart? Because on the above chart you can see something very similar in late 2012 and early 2013. Back then, gold’s final top was followed by a move to the 60-week MA, then we saw a correction, and then a move below the previous low and the 60-week MA. After that low we saw another corrective upswing that was a bit smaller than the previous one.
The implication here is that we could see even lower gold prices on a very short-term basis, then a correction that would not be very significant and then another big wave down. That’s in tune with what we’ve been expecting to see based on other factors, so the above simply serves as a confirmation.
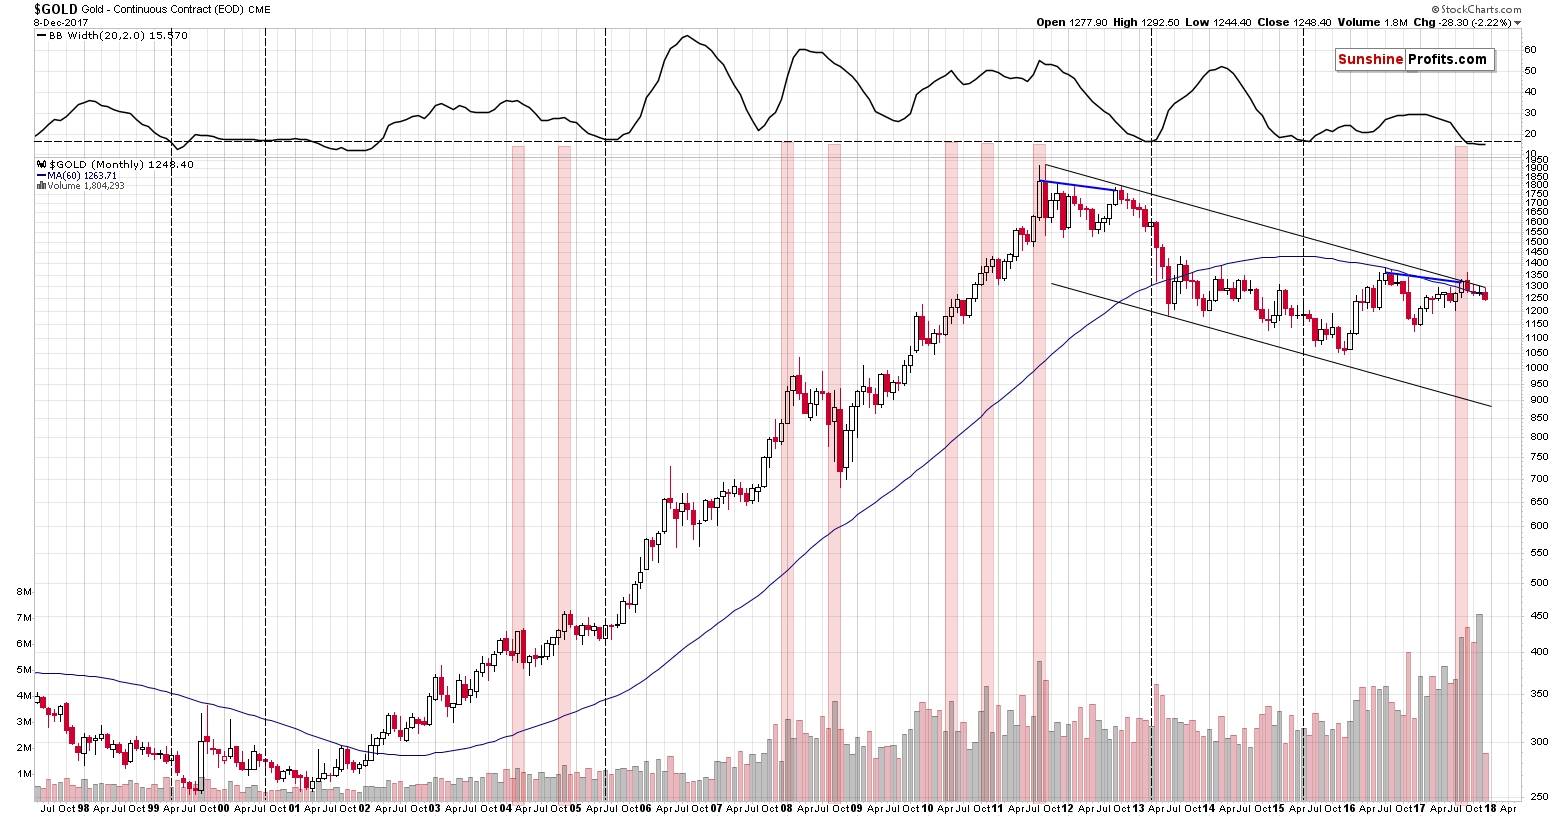
On gold’s monthly chart we can already see this month’s decline very visibly. The month is not over yet, so the implications are not clear, but we are featuring it because it shows that we were most likely correct about gold’s willingness to decline in the final part of November – it was unable to do so based on external factors, but it already caught up early this month.
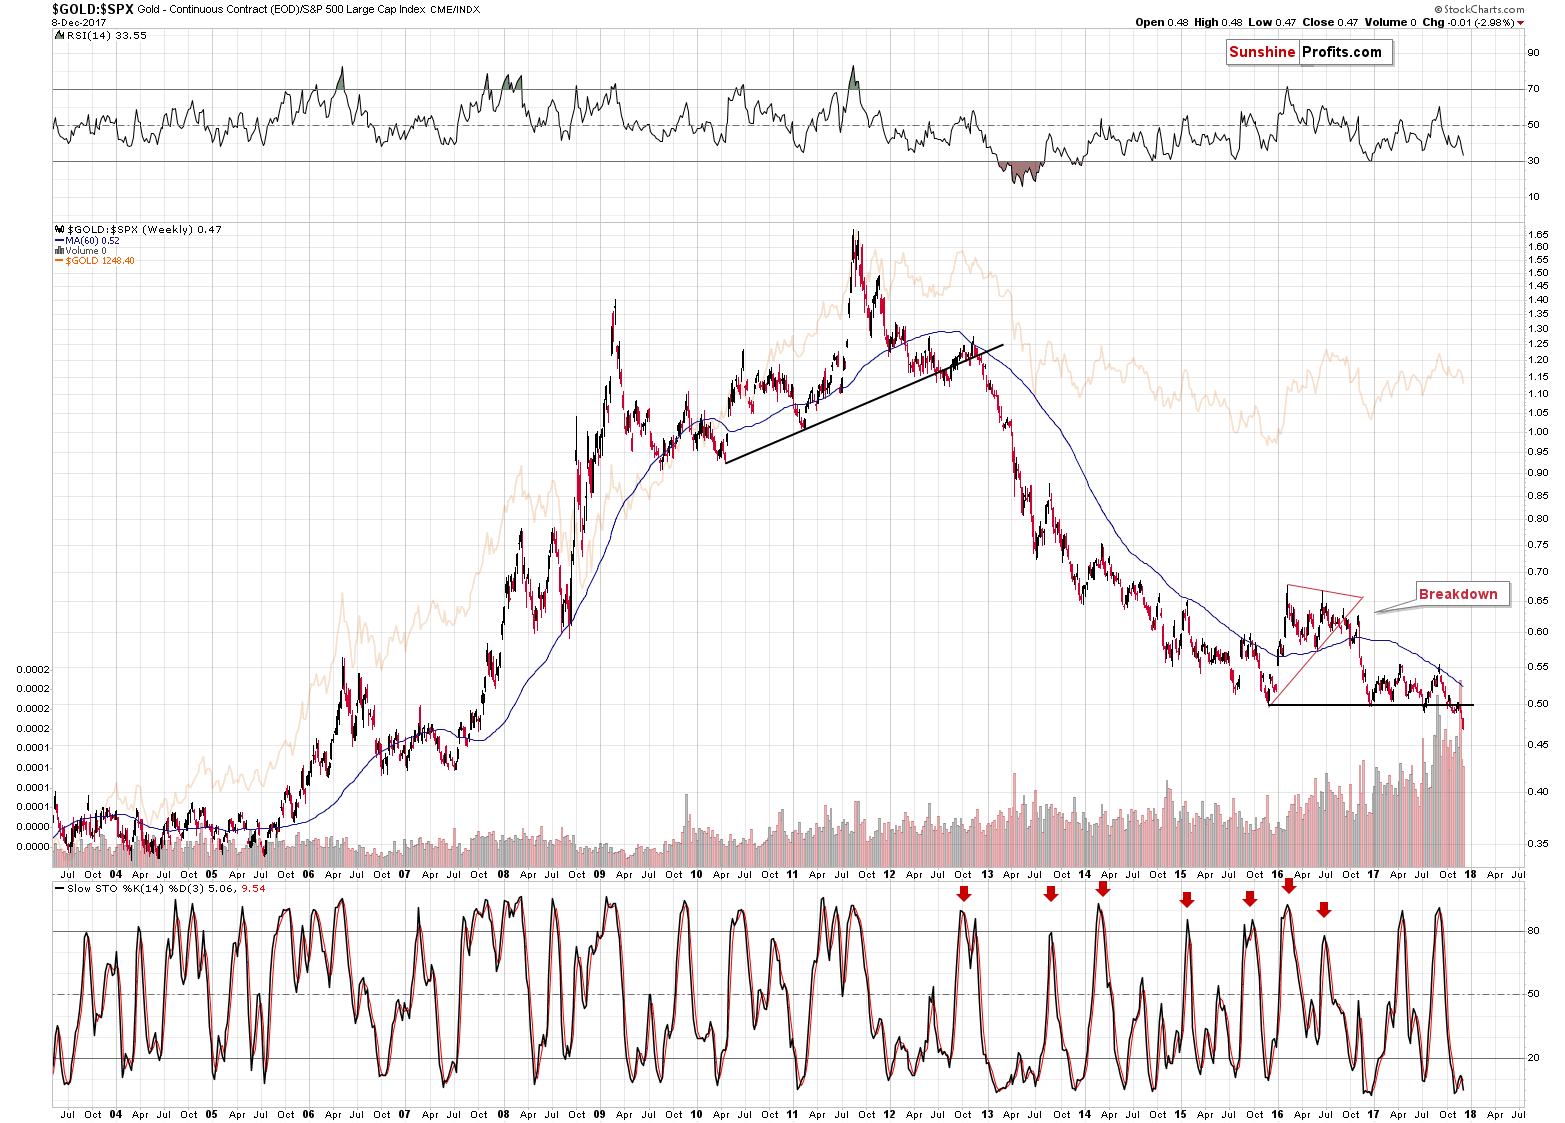
The gold to S&P 500 ratio is after a major, clearly visible breakdown and the implications are also major and clear – and bearish. While the short-term price swings may differ, the big moves are almost always aligned in the case of the above ratio and gold price itself. Consequently, the bearish implications for the following months are now even more significant.
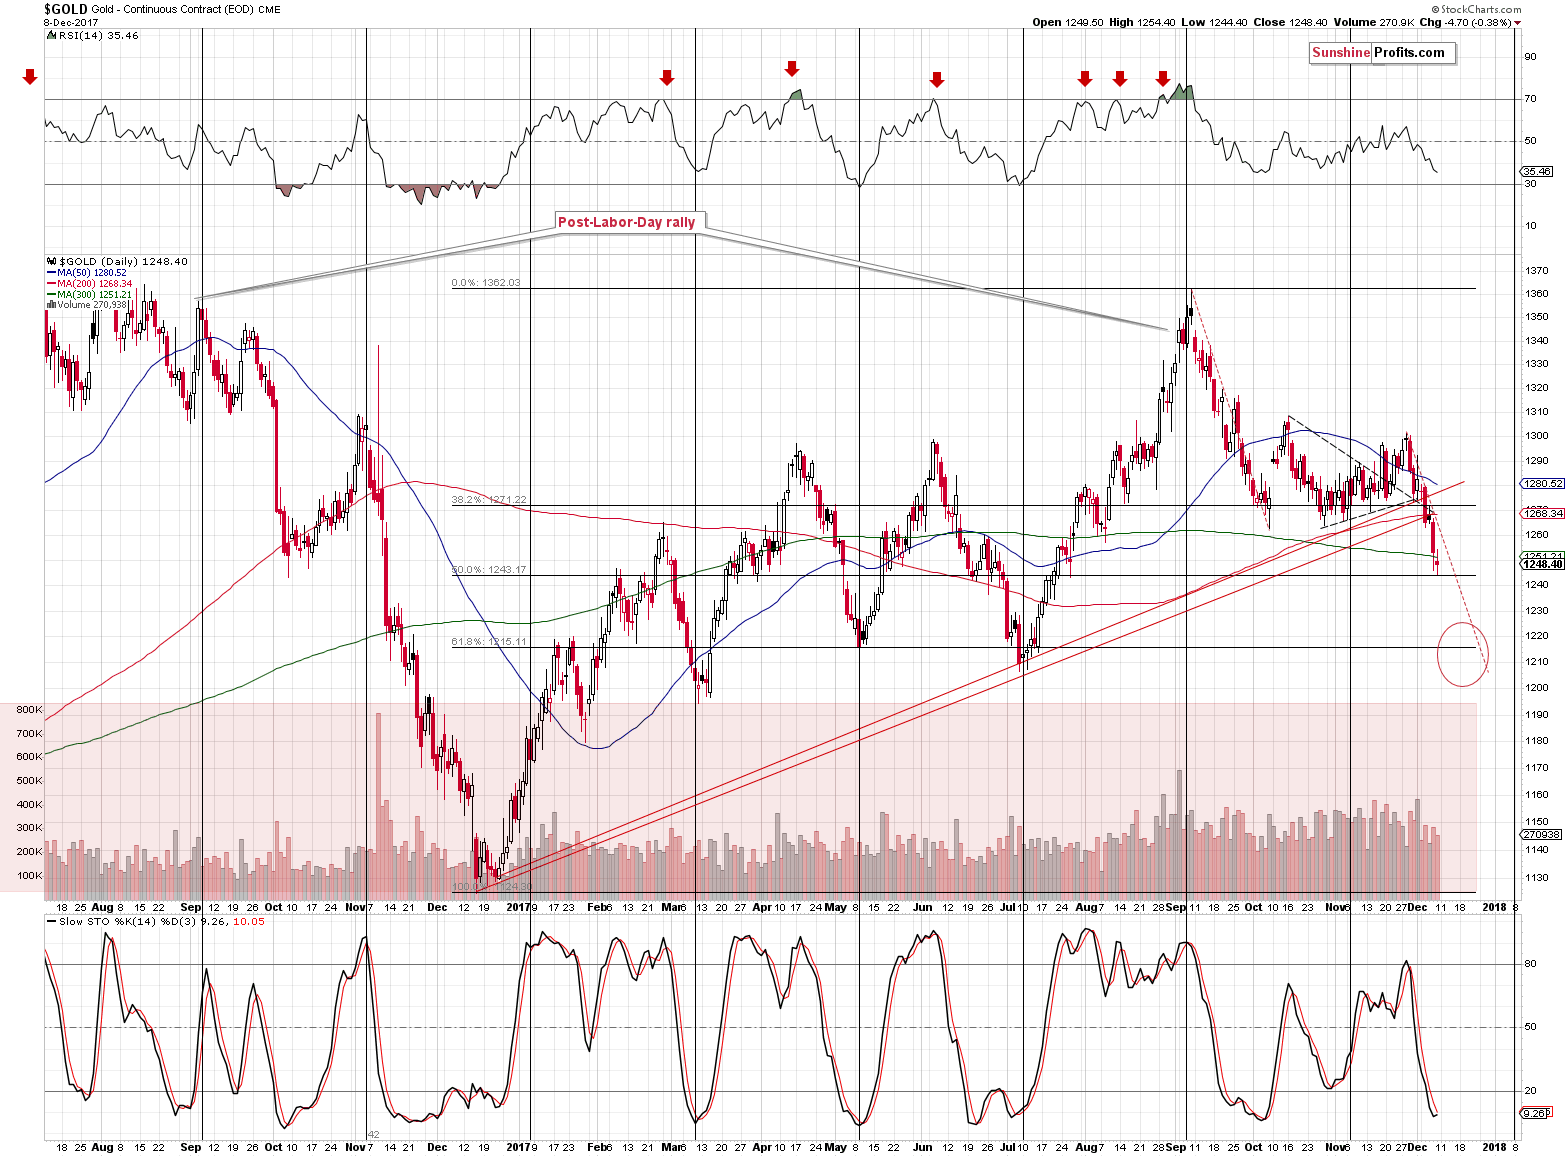
On the above short-term chart, little changed based on Friday’s session and our previous comments on it remain up-to-date:
Gold moved to about $1,250 and the proximity of this level caused pauses several times this year, but it was never anything more than that – no major top or bottom formed very close to this level. The late February 2017 top could be viewed as exception, but it formed almost at $1,260 and since gold was about $15 below this level (temporarily, but still) yesterday, it doesn’t seem that the above is an important support anymore. Since gold didn’t use to bottom at the current levels, there’s little reason to think that it did so this time.
Gold almost reached the 50% Fibonacci retracement level yesterday, but this level is not strengthened by other important bottoms, so it’s not likely to trigger a major reversal. Slide to the 61.8% Fibonacci retracement or the March – May bottoms still appears more likely than an immediate rebound.
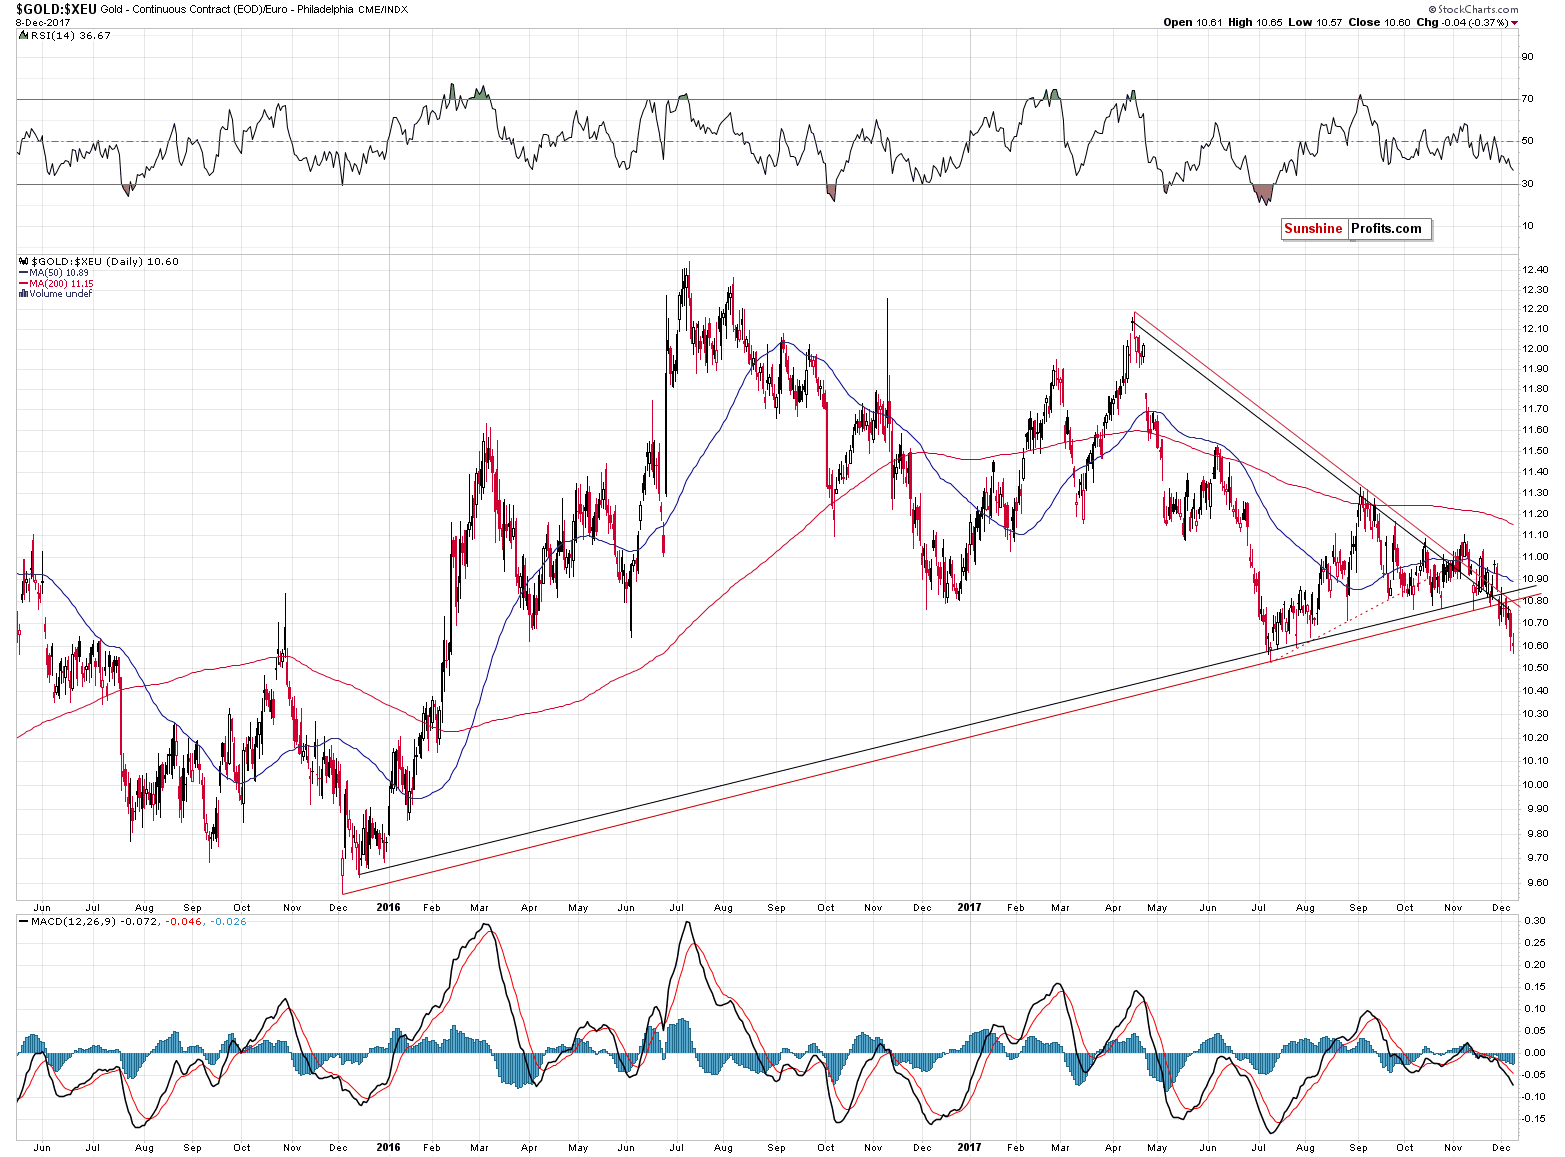
In terms of the euro, gold’s price is also after an important breakdown and the implications remain bearish for the following weeks.
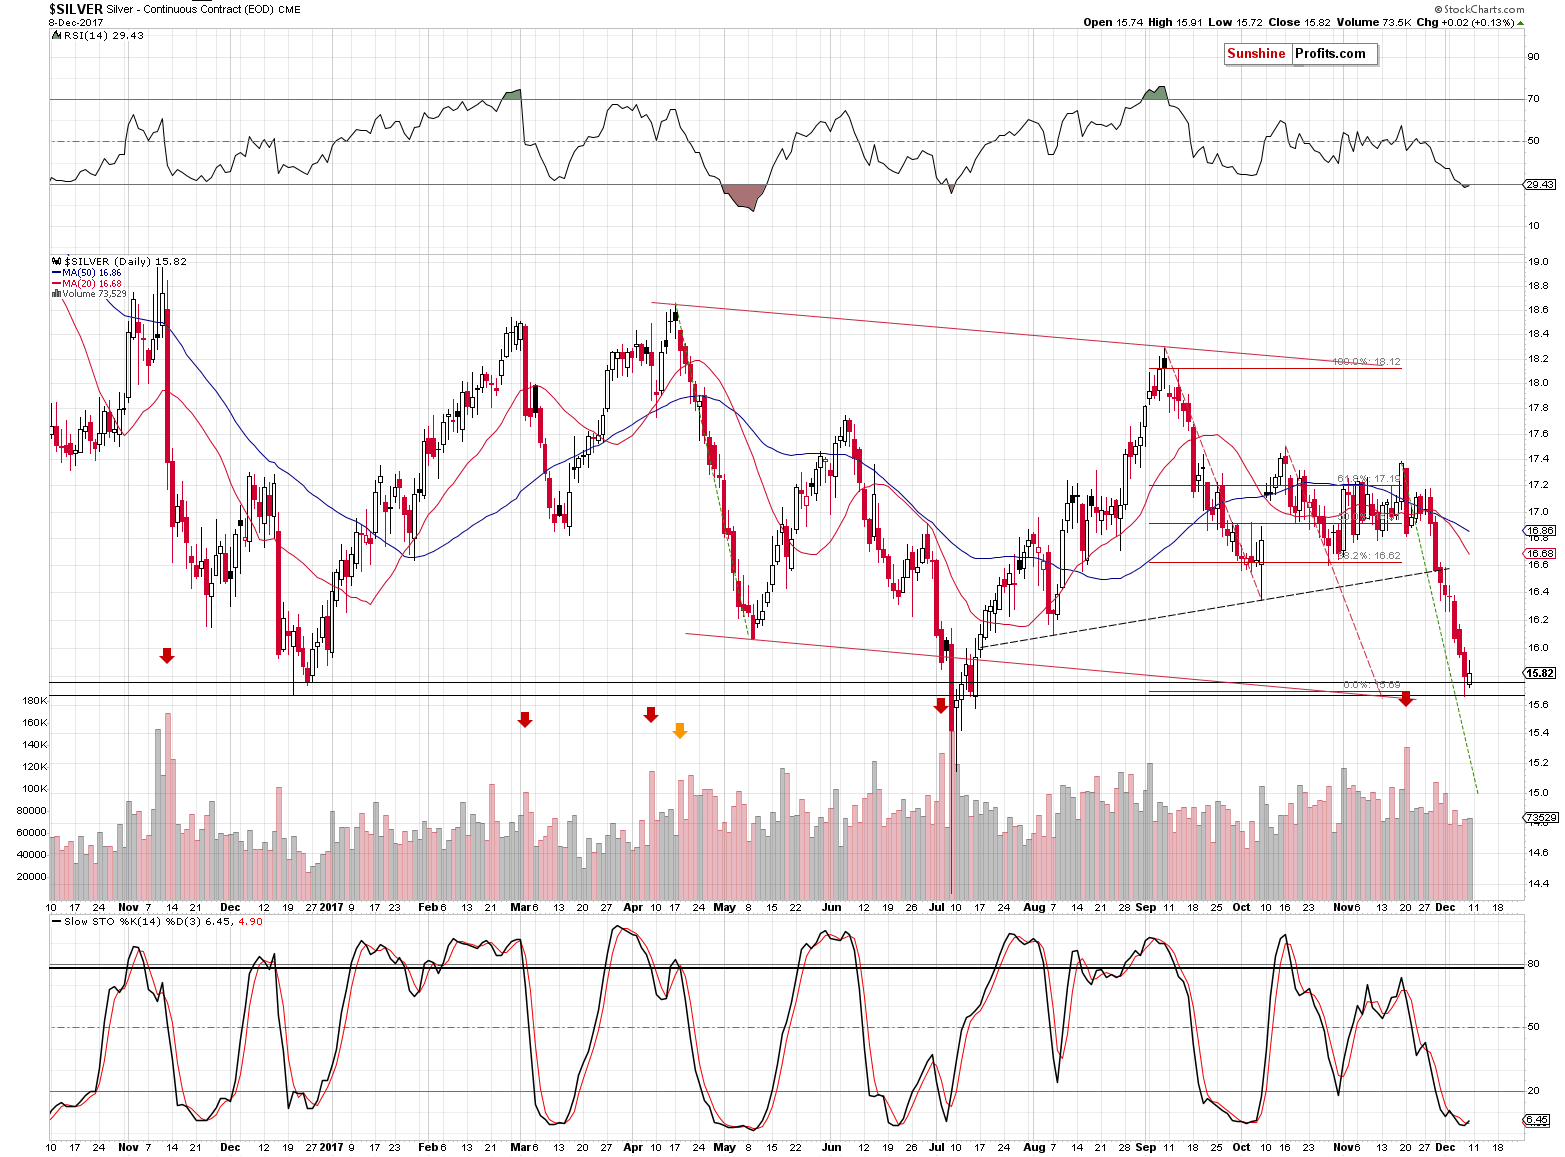
As far as silver is concerned, we also saw little new information on Friday and what we wrote previously remains up-to-date:
Silver, just like mining stocks, moved to our previous target area and last December’s low. In intraday terms, that’s the final stop before $14.40 becomes the next target based on the previous low.
So far, we’ve seen no breakdown. Will we see one shortly? Based on the action in gold and the USD Index, this seems quite likely.
By the way, the above chart shows why we discuss the volume levels so often. The spike in volume in mid-November indeed marked the start of a big downswing, just like was the case several times in the recent past. If one was looking at the price alone, the decline that followed the breakdown would have not appeared as significant as it had really been.
However, just because nothing changed in daily terms, it doesn’t mean that nothing changed at all.
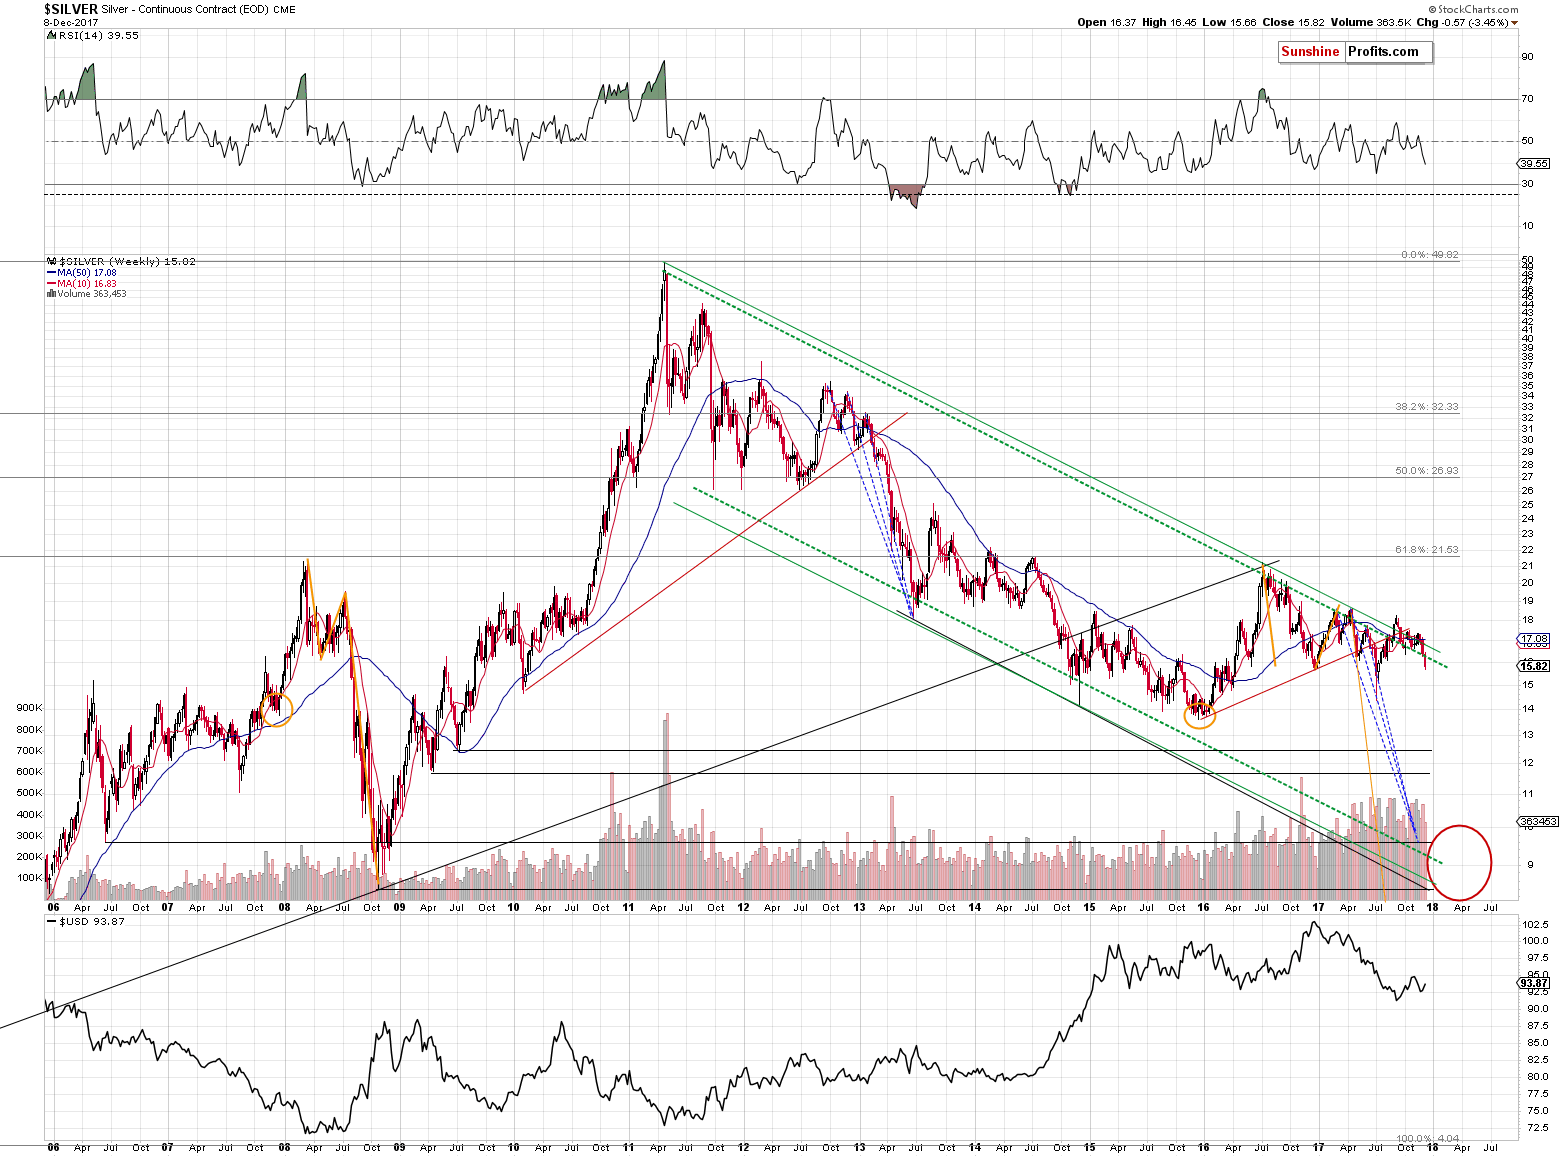
We saw important action in terms of weekly closing prices – silver closed back below the long-term support/resistance line. We already saw a smaller breakdown several weeks ago and it didn’t result in much lower prices. However, since the current invalidation of a breakout is bigger and much clearer, we can expect it to work as it should and be followed by big downswings. Still, please note that the above should work in terms of weekly closes, so it doesn’t rule out a temporary counter-trend upswing in the meantime.
So far, we have featured quite a few signals in today’s analysis, but we’re not even halfway done. The biggest slice of today’s analytical pie comes from mining stocks.
First things first – let’s take a look at the very long-term chart.
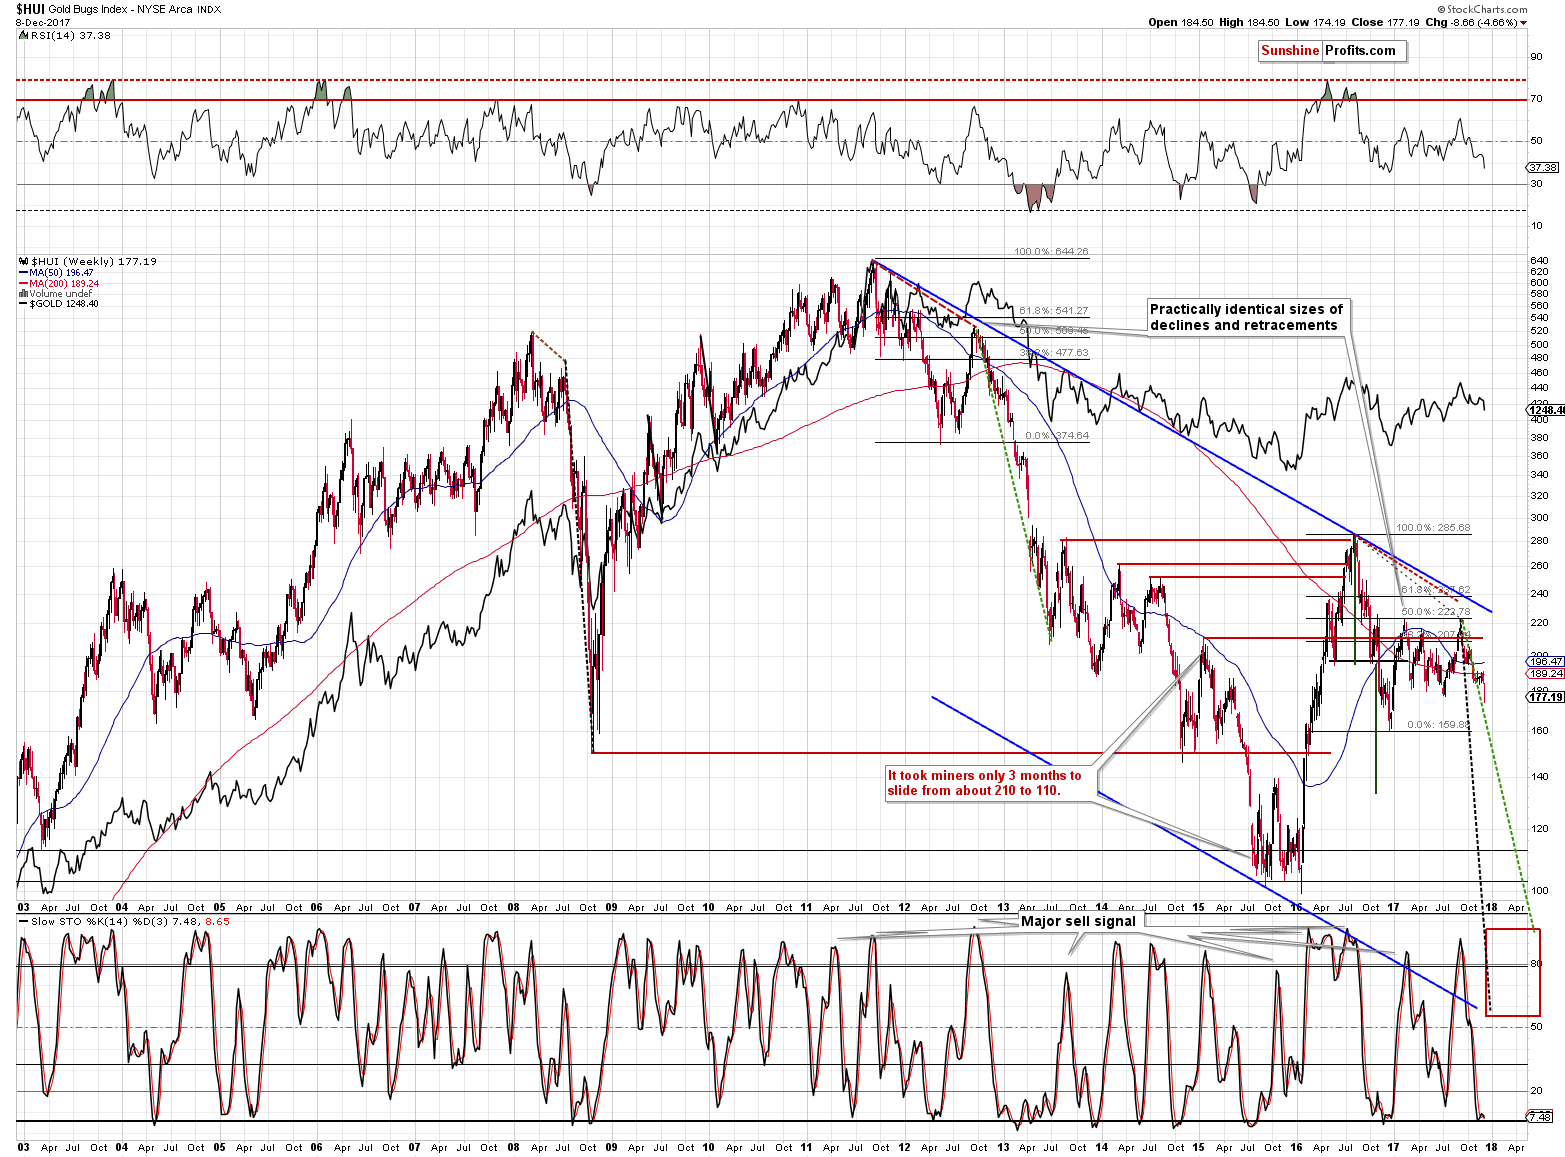
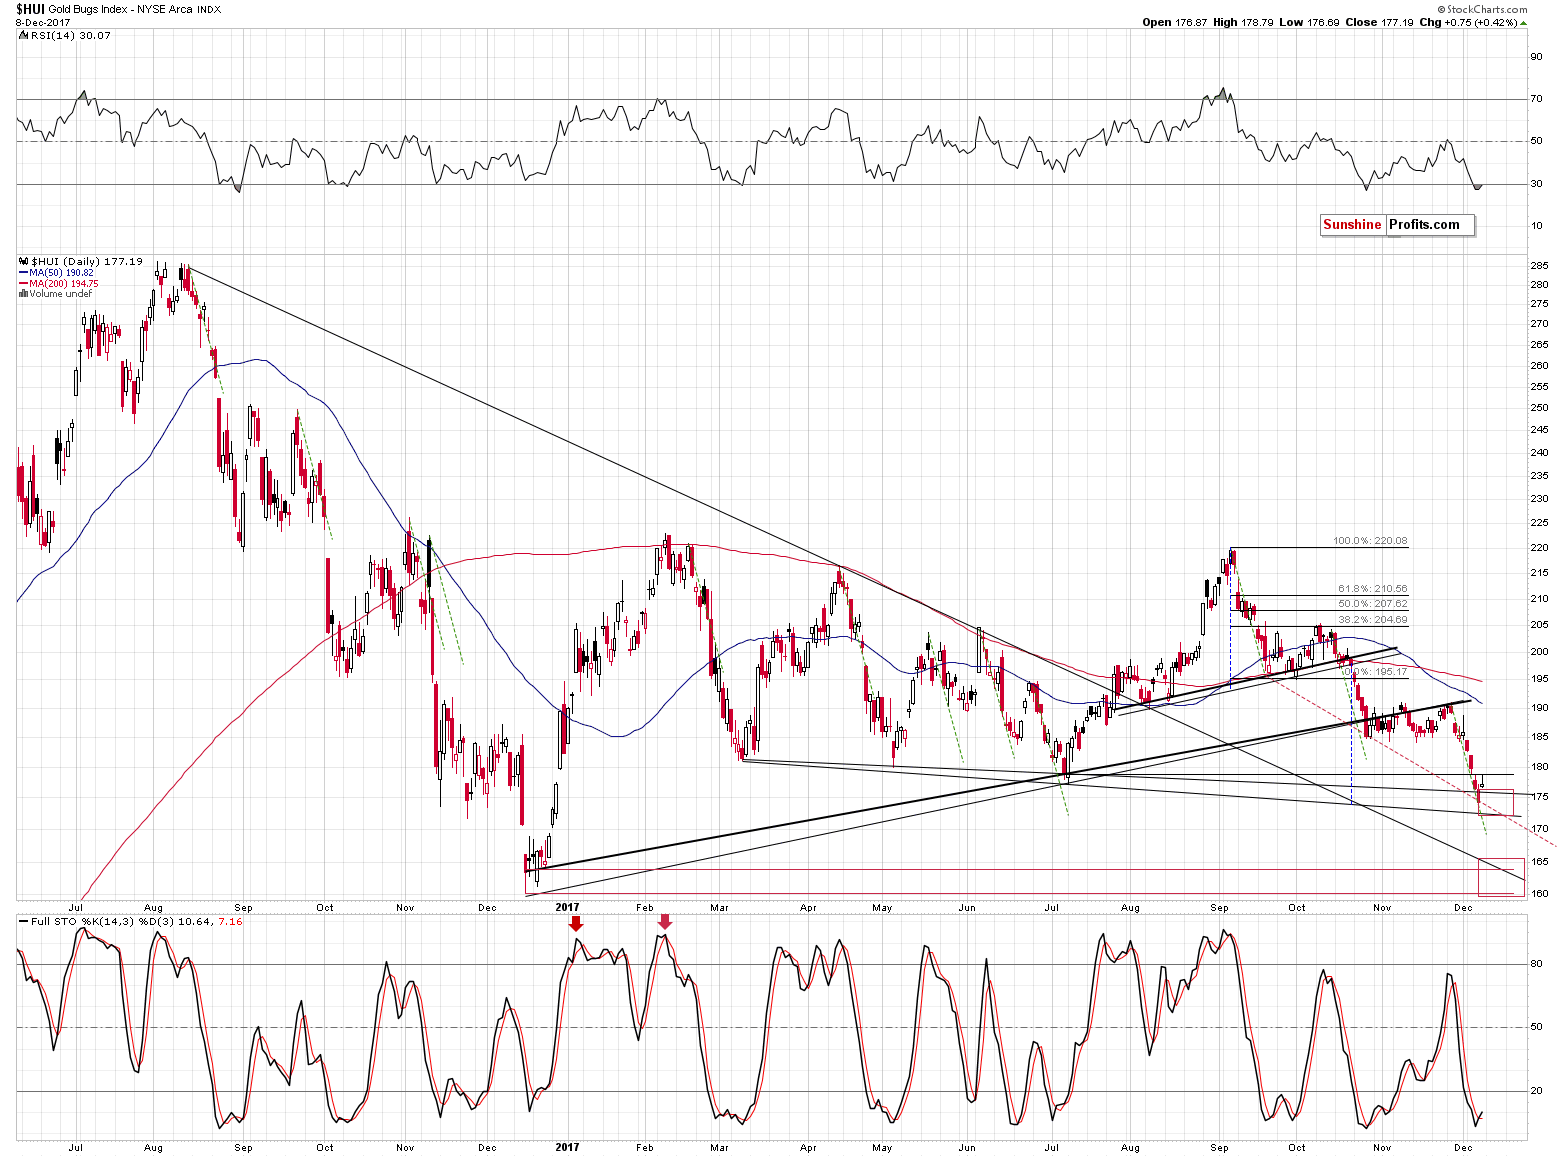
The striking fact that we can clearly see above is the way the current decline follows the footsteps of the 2012-2013 slide. We used the green, dashed line to show the similarity and, as you can see, it’s quite astonishing. In the past several weeks, gold miners have been declining right along the green line and there were no big corrections along the way, even though intraweek volatility was present. Then we saw a relatively small horizontal trend and now the decline is back with a vengeance. What we’re seeing right now is like being back in early 2013 all over again. And we’re all set to profit on it.
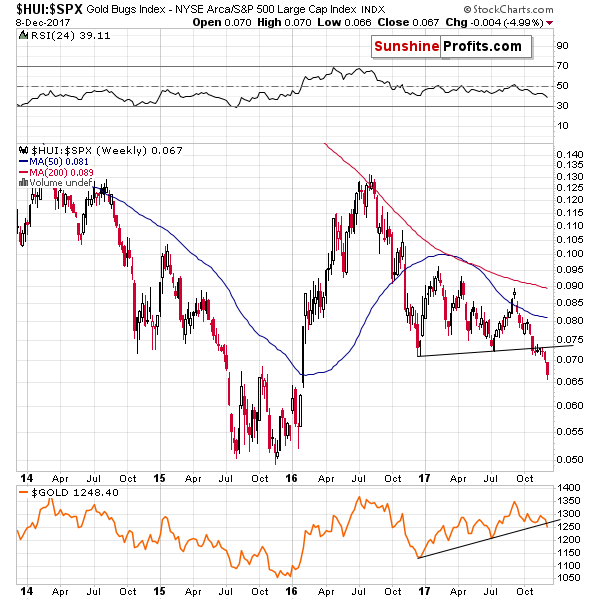
The HUI to S&P 500 ratio supports much lower prices in the following weeks as it confirmed its breakdown not only below the rising support line, but also below the late 2016 and previous 2017 lows.
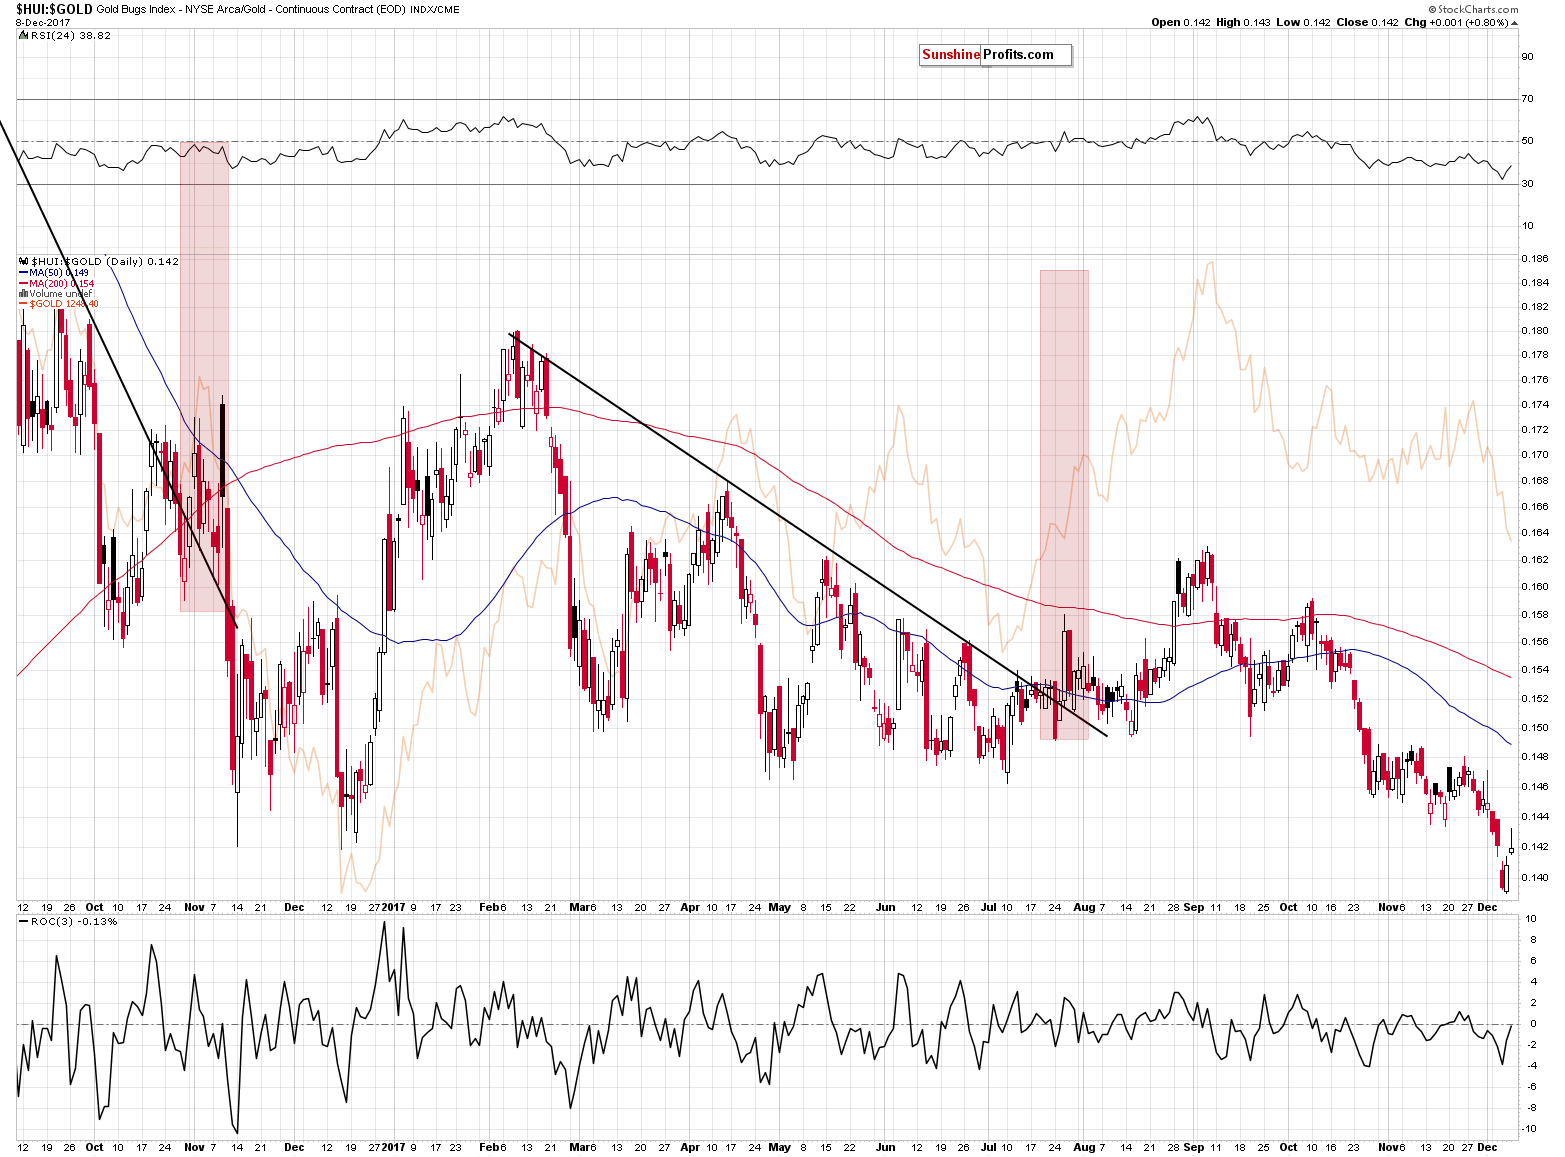
The HUI to gold ratio is also after a breakdown below the late-2016 low. Even though we saw moves higher on Thursday and Friday, both daily closes and the weekly close were below the key support/resistance. Consequently, the breakdown seems to be confirmed, but we would ideally like to see a third daily close below it to view the breakdown as truly confirmed.
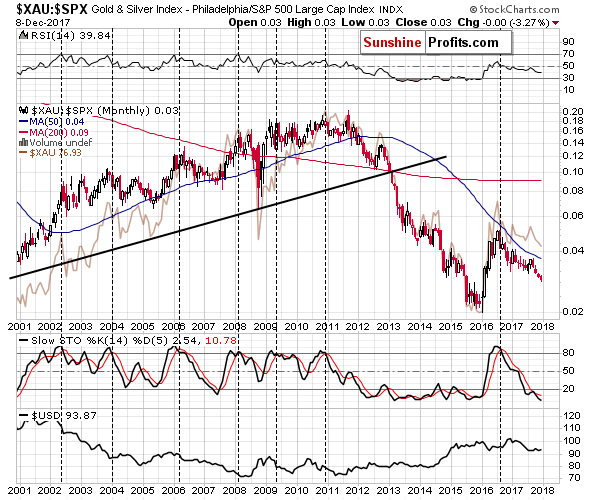
Those who have been reading our analyses for a long time, might remember the above chart. We described it last year, when we argued that the 2016 rally was already over. Barely anyone agreed, but yet, higher gold, silver, and mining stock prices have not been seen since that time.
The reason that we are bringing back last year’s signal is that it shows that the current situation is very similar to only one situation from this millennium – the 2011 – 2013 decline. The Stochastic indicator has been declining for over a year and there were two attempts for it to turn and flash a buy signal.
The only other similar period with regard to the Stochastic indicator was 2006 and 2007, but back then the decline in the indicator was very steady, while the current one is bumpier – more like the 2011 – 2013 one.
The above is not a strong analogy and not a strong signal, but still, something that’s worth keeping in mind as a confirmation tool.
As far as the short-term HUI Index picture is concerned, let’s start the analysis with quoting our previous comments:
The HUI Index moved lower at first, but then erased almost the entire daily slide, before the session was over. However, the question is if this move was justified by some other factors or did it show strength against all odds and even triggered an important technical buy signal.
On the bullish side, mining stocks showed strength relative to gold and they formed a daily reversal.
The bearish front is still much bigger and it goes beyond the analysis of the above chart. Still, let’s consider the following:
- Gold miners are after a breakdown below the previous 2017 lows and yesterday’s session was the second day in a row when they closed below them. This makes the breakdown almost confirmed.
- Gold moved to the declining support line (red, dashed line), which made a temporary pause in the decline likely.
Both of the above are reasons due to which, the miners’ strength should not be viewed as fully bullish. As we indicated earlier, there’s more to the bearish case than just the above.
After Friday’s session, we can say that the breakdown below the previous 2017 lows is fully confirmed. We saw a third consecutive close below them and we also saw an intraday move back to the July low that was followed by a downswing. The above is a classic verification of a breakdown with bearish implications. Consequently, even though the RSI indicator points to an oversold condition, it seems likely that the situation in the HUI Index will become even more oversold before the bottom is formed.
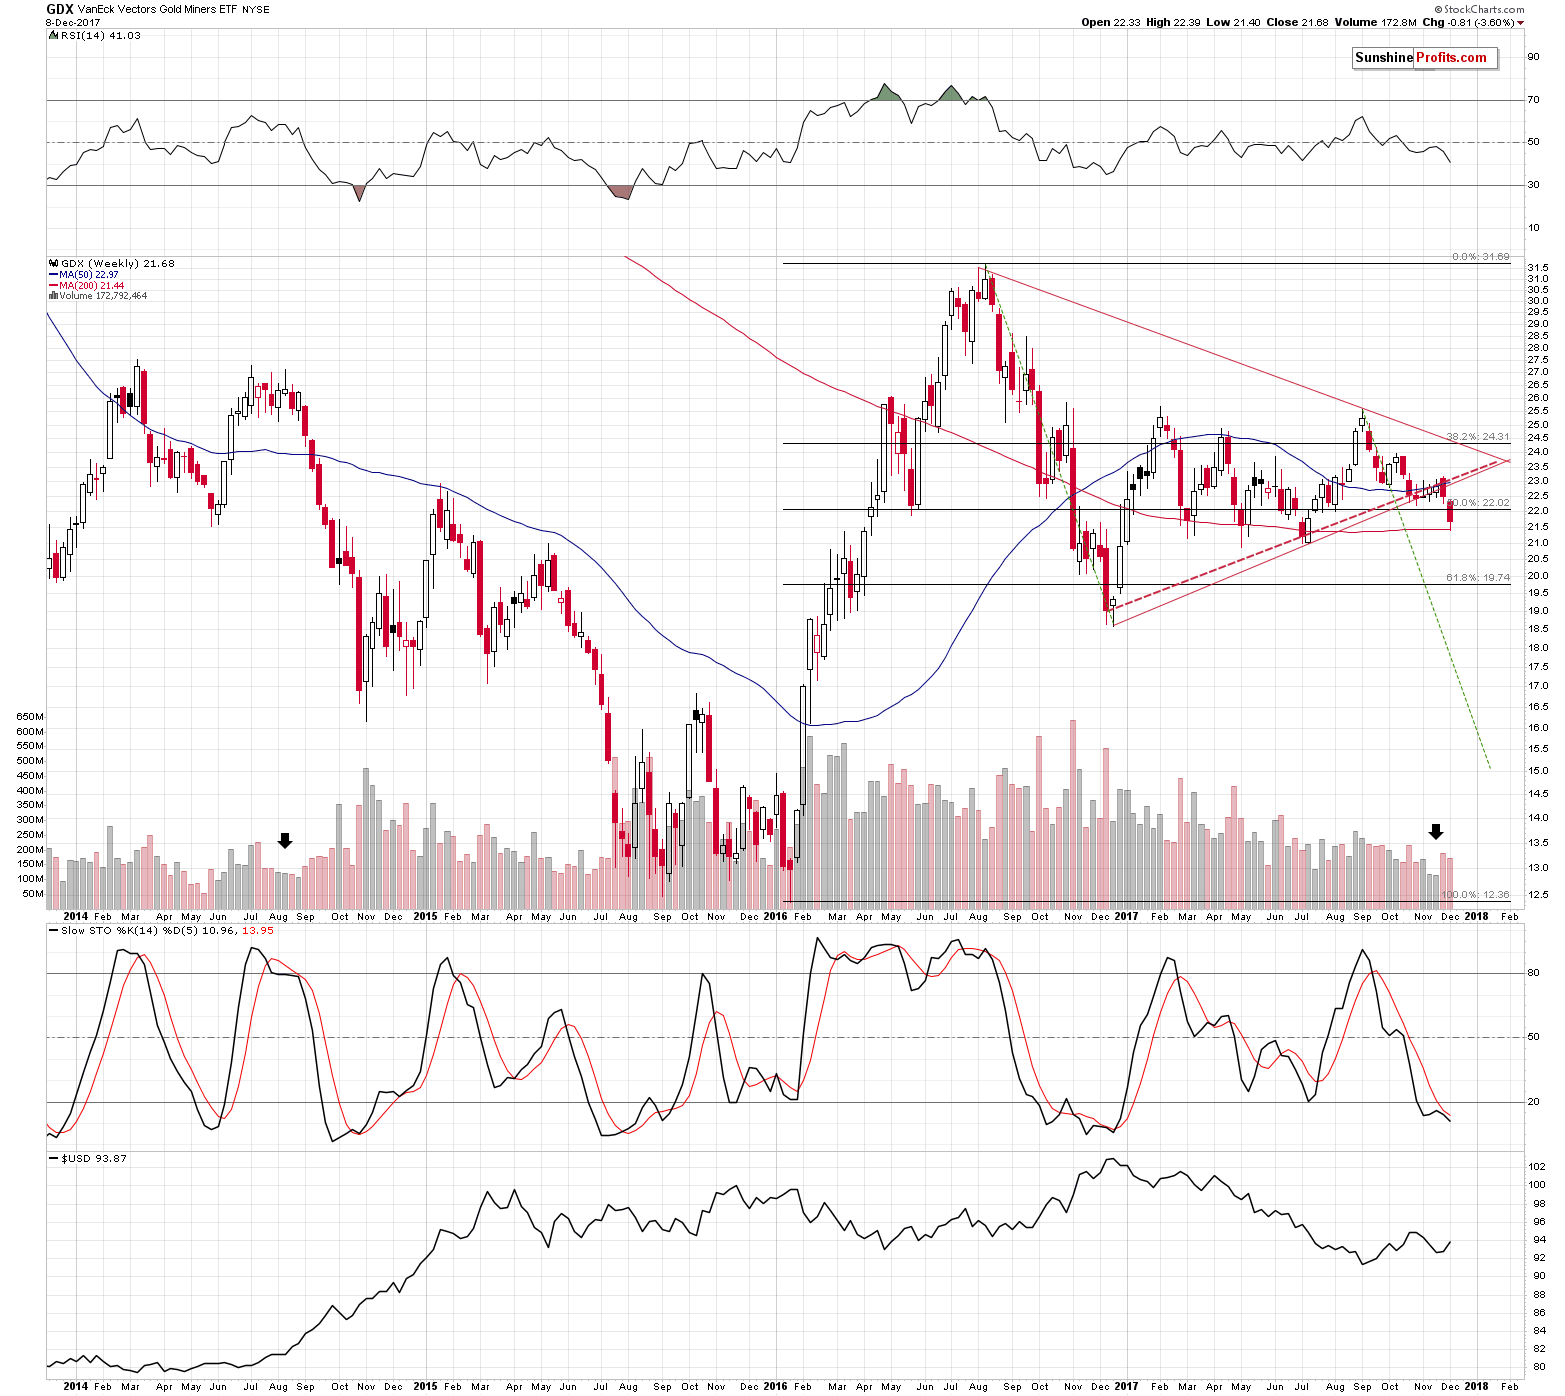
Daily candlesticks are very useful for estimating the follow-up action in the short term, but weekly candlesticks along with weekly volume levels are even more important. The above chart features weekly price changes in the GDX ETF. Last Monday, we commented on it in the following way:
From the weekly point of view, we see that mining stocks declined and broke below the rising support lines based on the 2016 and 2017 lows and that the breakdown took place on big volume. All that happened after two weeks of low-volume upswings that we commented on in last Monday’s alert:
Finally, the weekly volume levels in the GDX ETF paint a very bearish picture for the following weeks. The GDX ETF is after 2 small, weekly rallies that were accompanied by very low volume when compared with the previous weeks. The last week had less trading days, but that doesn’t explain the previous week’s low volume reading. Moreover, we didn’t see similarly low volume readings in the past Novembers, which suggests that we are correct to view the low volume levels as something important and meaningful.
The only comparable situation from the recent past took place in mid-2014 (marked with a black arrow). In the following weeks, the GDX price was cut by a third.
Last week, we summarized our alert by saying that the bearish implications of the above had just become more bearish, as back in 2014 the first big-volume weekly decline had meant that the big slide had just begun.
Today, we can say that the above is even more the case as we’ve seen yet another weekly confirmation that the analogy remains in place.
The bearish implications are even stronger because we haven’t seen a really big rally in the USD Index so far. Generally, what we wrote in the previous alert remains up-to-date:
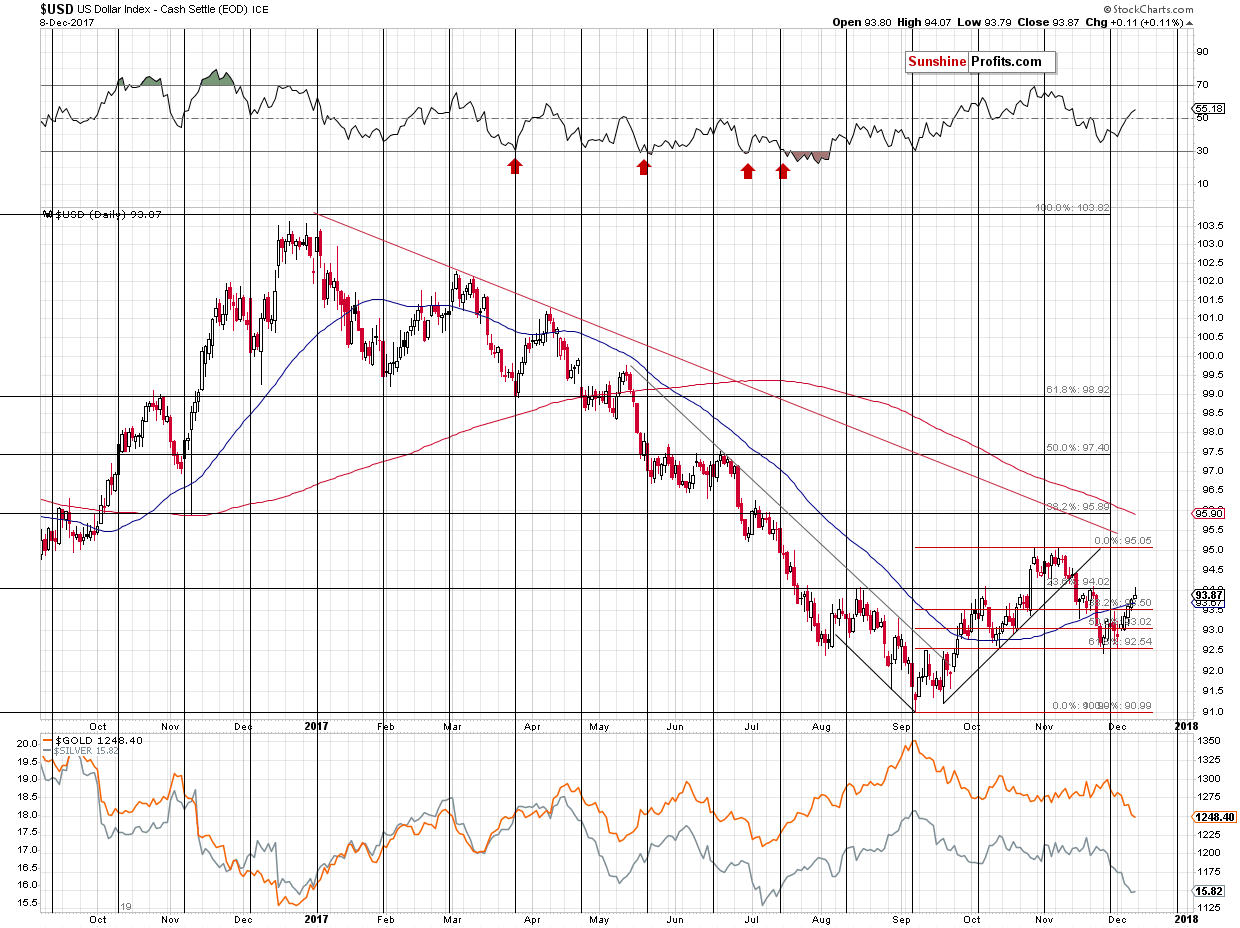
The USD Index moved a bit higher – the rally was not huge, but it was consequent. Sooner rather than later a lot of traders will expect the head and shoulders in the USD Index to form and such a formation would imply a top around the 94 level. However, it’s not likely to happen.
Why?
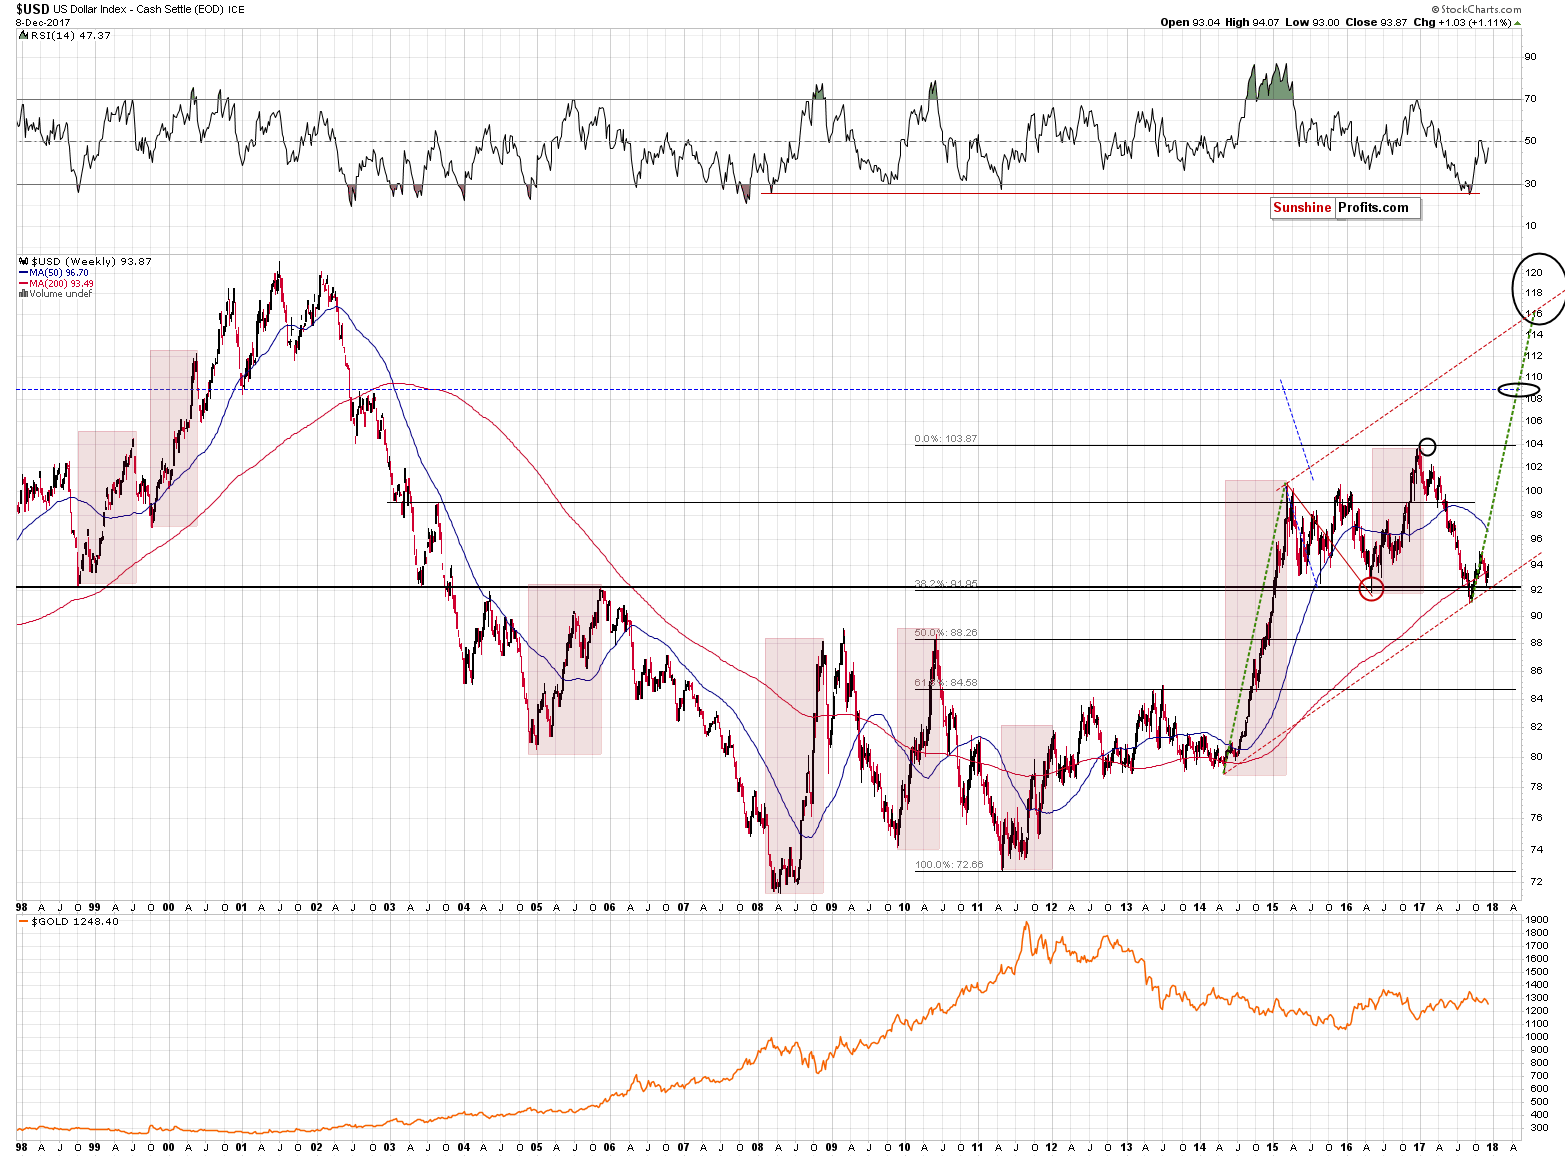
Because it doesn’t fit the previous major patterns. As we explained previously, the time for the corrective downswing in the USD Index is most likely up (especially that this week is ending today). That’s one thing, but the other thing is the shape of the previous corrective downswings and their follow-up action.
There was only one case when the USD Index moved back down once again after the first corrective downswing was over – in mid-2011 and that’s when gold formed its final top. The situation seems to be much different now, not only in gold, but also in the case of the USD – the latter moved back and forth in a volatile manner in 2011 during the first part of the corrective downswing and it was definitely not the case in the past few weeks.
The recent correction in the USD was much more similar to the one seen in 1998, 2005 and in 2014. In 1998 and 2014 the USD Index rallied well above the previous local high before taking a breather. Applying this to the current situation, provides us with the 95-96 area as the lowest of likely targets.
If the current action is to be like the 2005 one (which might be the case especially because of the analogy in the interest rate hikes), then we could see a small pause once the USD moves to the previous high – 95 in this case.
Either way, it seems that the USD Index has further to rally before pausing in a more meaningful way.
Connecting the dots, the USD Index is likely to rally further, which makes it likely for gold and silver to decline. If they don’t, we’ll have a bullish sign and we’ll know that we want to exit the short positions. When gold and silver decline, mining stocks are still likely to underperform based on the breakdown in the HUI Index to gold ratio. If the miners refuse to decline and the breakdown in the ratio becomes invalidated, we’ll know that a corrective upswing is just around the corner.
So far, we haven’t seen the bullish signs – the USD Index moved only a bit higher on Friday, so there’s nothing to really say about the USD – gold link on that day. The change in the HUI Index that’s less than 0.5% is not meaningful either.
While we’re in the currency sector, let’s take a look at the recent price changes in the Japanese yen.
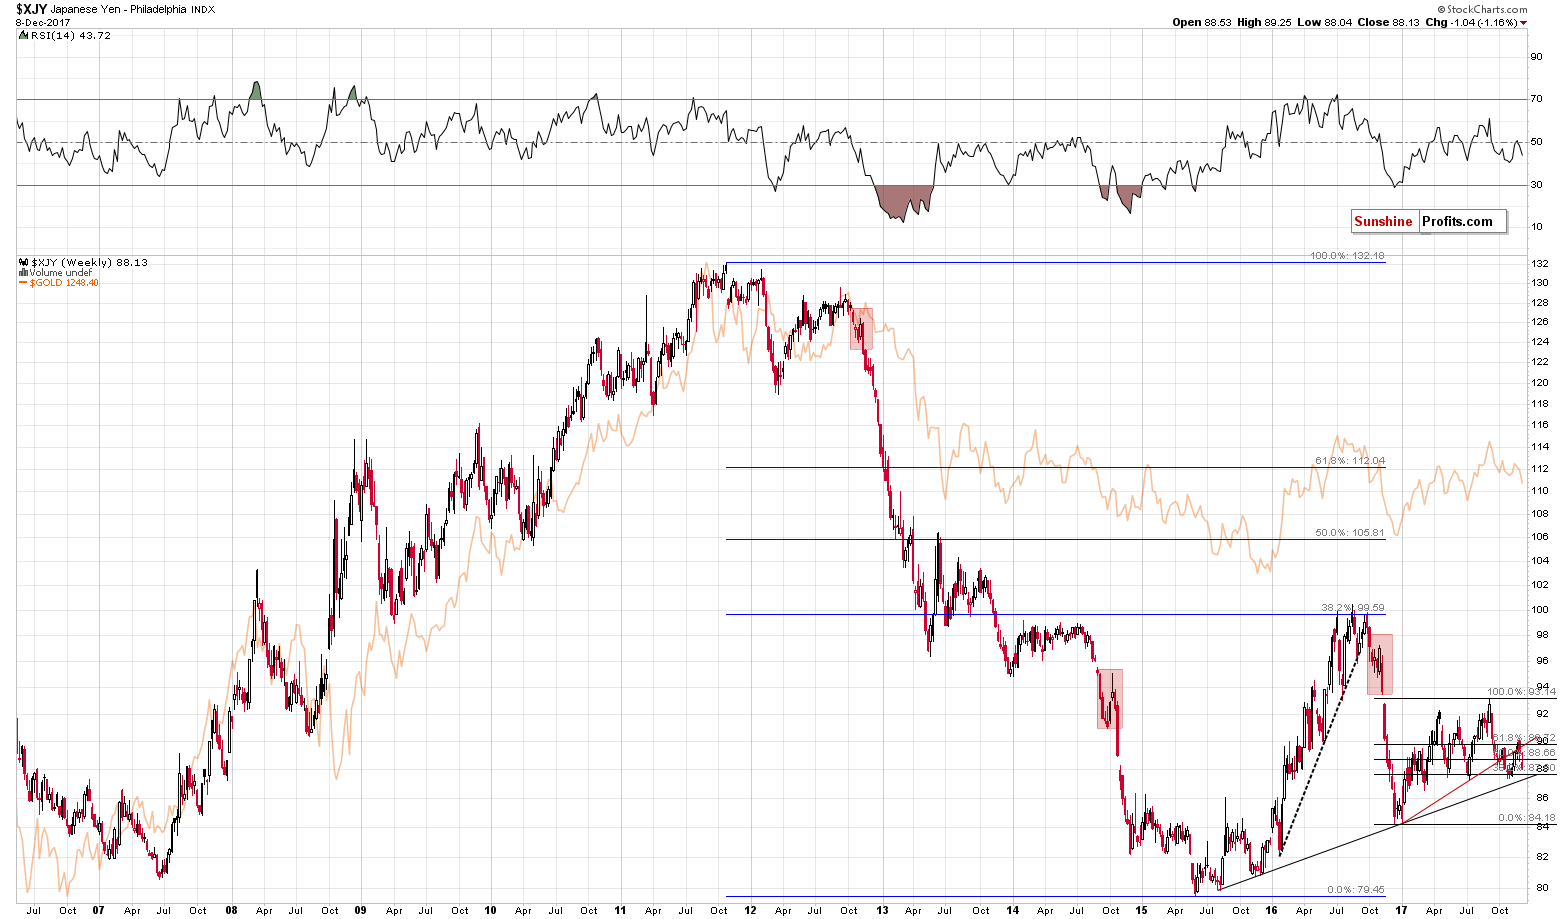
The reason that we’re featuring the above chart is that we would like to emphasize that there’s much more to the gold market than just the USD:JPY exchange rate. Every now and then we receive a message claiming that analyzing various parts of the precious metals market is pointless as it’s all about the yen. It’s not – the link between both markets is certainly present, but as you can see above, gold is already below the previous short-term low and the rising support lines (even in terms of the euro). At the same time, the Japanese yen is not below any of the mentioned levels.
Interestingly, the final part of the 2008 decline in gold was accompanied by the yen’s appreciation, so focusing on the currency market alone, one could be buying gold at the best shorting opportunity of the year.
The USD:JPY exchange rate is important, but many other factors should be kept in mind as well.
This brings us to one of the “other factors” that we described in the opening paragraph of today’s complex alert. As we’ve already described, there are tens of bearish factors currently in place, but there’s one thing that has bullish implications and that appears to be quite efficient.
What is it?
Platinum’s huge weekly decline.
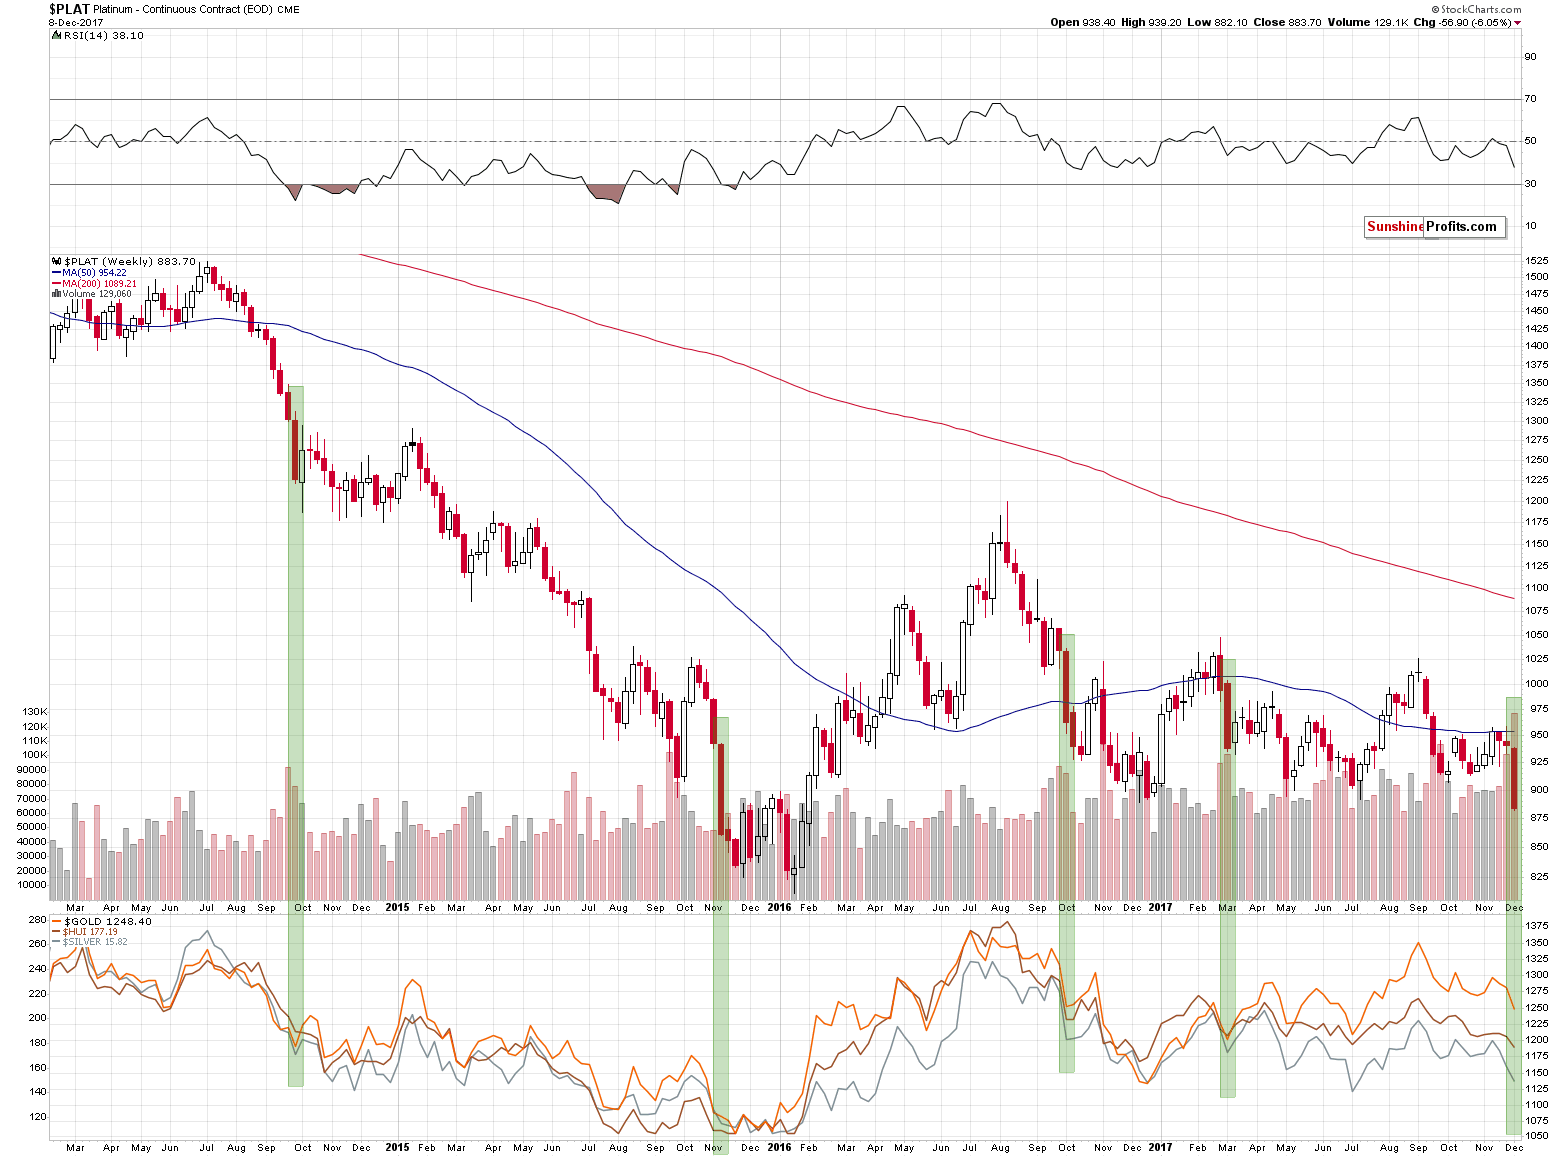
As odd as it may sound, whenever platinum declined in a very profound way (about 5% in a week), it meant that either a corrective upswing was about to start in the following week (2014, 2016) or that a decline had just ended (2015, March 2017). We’ve seen this phenomenon 4 times in the recent years and in each case, it had bullish implications. 4 out of 4, meaning 100% efficiency is not something that should be ignored.
Does it mean that the precious metals sector will soar immediately? No. The above chart is based on weekly candlesticks in the case of platinum and weekly closing prices in the case of gold, silver and the HUI Index that are visible in the lower part of the above chart. Consequently, whatever implications the above chart has, they are in terms of the next week’s closing prices. So, gold, silver and mining stock are likely to end the next week higher, but not necessarily rally in its first part.
We previously mentioned that the Fed interest rate decision day could mark a turning point or we could see the interim bottom very close to it. The above chart supports this outlook and it suggests that we should be prepared to either exit the short positions or to switch to long ones. We are considering both options and which decision we take will depend on the confirmations that we get in the meantime.
Summing up, there are tens of signals that point to lower precious metals prices in the coming weeks, but there are also signs that point to higher prices in the short term. The scenario that seems to fit most signals is the one in which the precious metals market forms a temporary (!) bottom sometime this week, rallies for a bit and then starts another major slide. There are many factors that come into play at this time and we’ll keep monitoring them. As always, we’ll report to you – our subscribers – accordingly.
To summarize:
Trading capital (supplementary part of the portfolio; our opinion): Short positions (150% of the full position) in gold, silver and mining stocks are justified from the risk/reward perspective with the following stop-loss orders and exit price levels / profit-take orders:
- Gold: exit price: $1,218; stop-loss: $1,366; exit price for the DGLD ETN: $51.98; stop-loss for the DGLD ETN $38.74
- Silver: exit price: $14.63; stop-loss: $19.22; exit price for the DSLV ETN: $33.88; stop-loss for the DSLV ETN $17.93
- Mining stocks (price levels for the GDX ETF): exit price: $19.22; stop-loss: $26.34; exit price for the DUST ETF: $39.88; stop-loss for the DUST ETF $21.37
In case one wants to bet on junior mining stocks' prices (we do not suggest doing so – we think senior mining stocks are more predictable in the case of short-term trades – if one wants to do it anyway, we provide the details), here are the stop-loss details and exit prices:
- GDXJ ETF: exit price: $27.82; stop-loss: $45.31
- JDST ETF: exit price: $94.88 stop-loss: $43.12
Long-term capital (core part of the portfolio; our opinion): No positions (in other words: cash)
Insurance capital (core part of the portfolio; our opinion): Full position
Important Details for New Subscribers
Whether you already subscribed or not, we encourage you to find out how to make the most of our alerts and read our replies to the most common alert-and-gold-trading-related-questions.
Please note that the in the trading section we describe the situation for the day that the alert is posted. In other words, it we are writing about a speculative position, it means that it is up-to-date on the day it was posted. We are also featuring the initial target prices, so that you can decide whether keeping a position on a given day is something that is in tune with your approach (some moves are too small for medium-term traders and some might appear too big for day-traders).
Plus, you might want to read why our stop-loss orders are usually relatively far from the current price.
Please note that a full position doesn’t mean using all of the capital for a given trade. You will find details on our thoughts on gold portfolio structuring in the Key Insights section on our website.
As a reminder – “initial target price” means exactly that – an “initial” one, it’s not a price level at which we suggest closing positions. If this becomes the case (like it did in the previous trade) we will refer to these levels as levels of exit orders (exactly as we’ve done previously). Stop-loss levels, however, are naturally not “initial”, but something that, in our opinion, might be entered as an order.
Since it is impossible to synchronize target prices and stop-loss levels for all the ETFs and ETNs with the main markets that we provide these levels for (gold, silver and mining stocks – the GDX ETF), the stop-loss levels and target prices for other ETNs and ETF (among other: UGLD, DGLD, USLV, DSLV, NUGT, DUST, JNUG, JDST) are provided as supplementary, and not as “final”. This means that if a stop-loss or a target level is reached for any of the “additional instruments” (DGLD for instance), but not for the “main instrument” (gold in this case), we will view positions in both gold and DGLD as still open and the stop-loss for DGLD would have to be moved lower. On the other hand, if gold moves to a stop-loss level but DGLD doesn’t, then we will view both positions (in gold and DGLD) as closed. In other words, since it’s not possible to be 100% certain that each related instrument moves to a given level when the underlying instrument does, we can’t provide levels that would be binding. The levels that we do provide are our best estimate of the levels that will correspond to the levels in the underlying assets, but it will be the underlying assets that one will need to focus on regarding the signs pointing to closing a given position or keeping it open. We might adjust the levels in the “additional instruments” without adjusting the levels in the “main instruments”, which will simply mean that we have improved our estimation of these levels, not that we changed our outlook on the markets. We are already working on a tool that would update these levels on a daily basis for the most popular ETFs, ETNs and individual mining stocks.
Our preferred ways to invest in and to trade gold along with the reasoning can be found in the how to buy gold section. Additionally, our preferred ETFs and ETNs can be found in our Gold & Silver ETF Ranking.
As a reminder, Gold & Silver Trading Alerts are posted before or on each trading day (we usually post them before the opening bell, but we don't promise doing that each day). If there's anything urgent, we will send you an additional small alert before posting the main one.
=====
Hand-picked precious-metals-related links:
PRECIOUS-Gold edges up; looming U.S. rate hike weighs on momentum
Gold Speculators Sharply Lowered Bullish Net Positions This Week
Palladium soars to 16-year-high on platinum discount
=====
In other news:
Investors Told to Brace for Steepest Rate Hikes Since 2006
BANK OF AMERICA: The dollar is set for a big rebound after a difficult year
Bitcoin futures steal spotlight, momentum keeps pushing stocks up
Bitcoin Futures Start With a Bang as 26% Rally Triggers Halts
Hotly anticipated bitcoin futures ease off after 22 percent surge
4 Developments to Watch in Global Economy
The dollar’s days as the world’s most important currency are numbered
=====
Thank you.
Sincerely,
Przemyslaw Radomski, CFA
Founder, Editor-in-chief, Gold & Silver Fund Manager
Gold & Silver Trading Alerts
Forex Trading Alerts
Oil Investment Updates
Oil Trading Alerts

