

Briefly: In our opinion, full (150% of the regular full position) speculative short positions in gold, silver and mining stocks are justified from the risk/reward perspective at the moment of publishing this alert.
The week is over and the weekly price and volume readings are now available. What can we infer from them? Where will gold and the rest of the precious metals market move in this and in the following weeks?
Let’s jump right into the (chart courtesy of http://stockcharts.com).
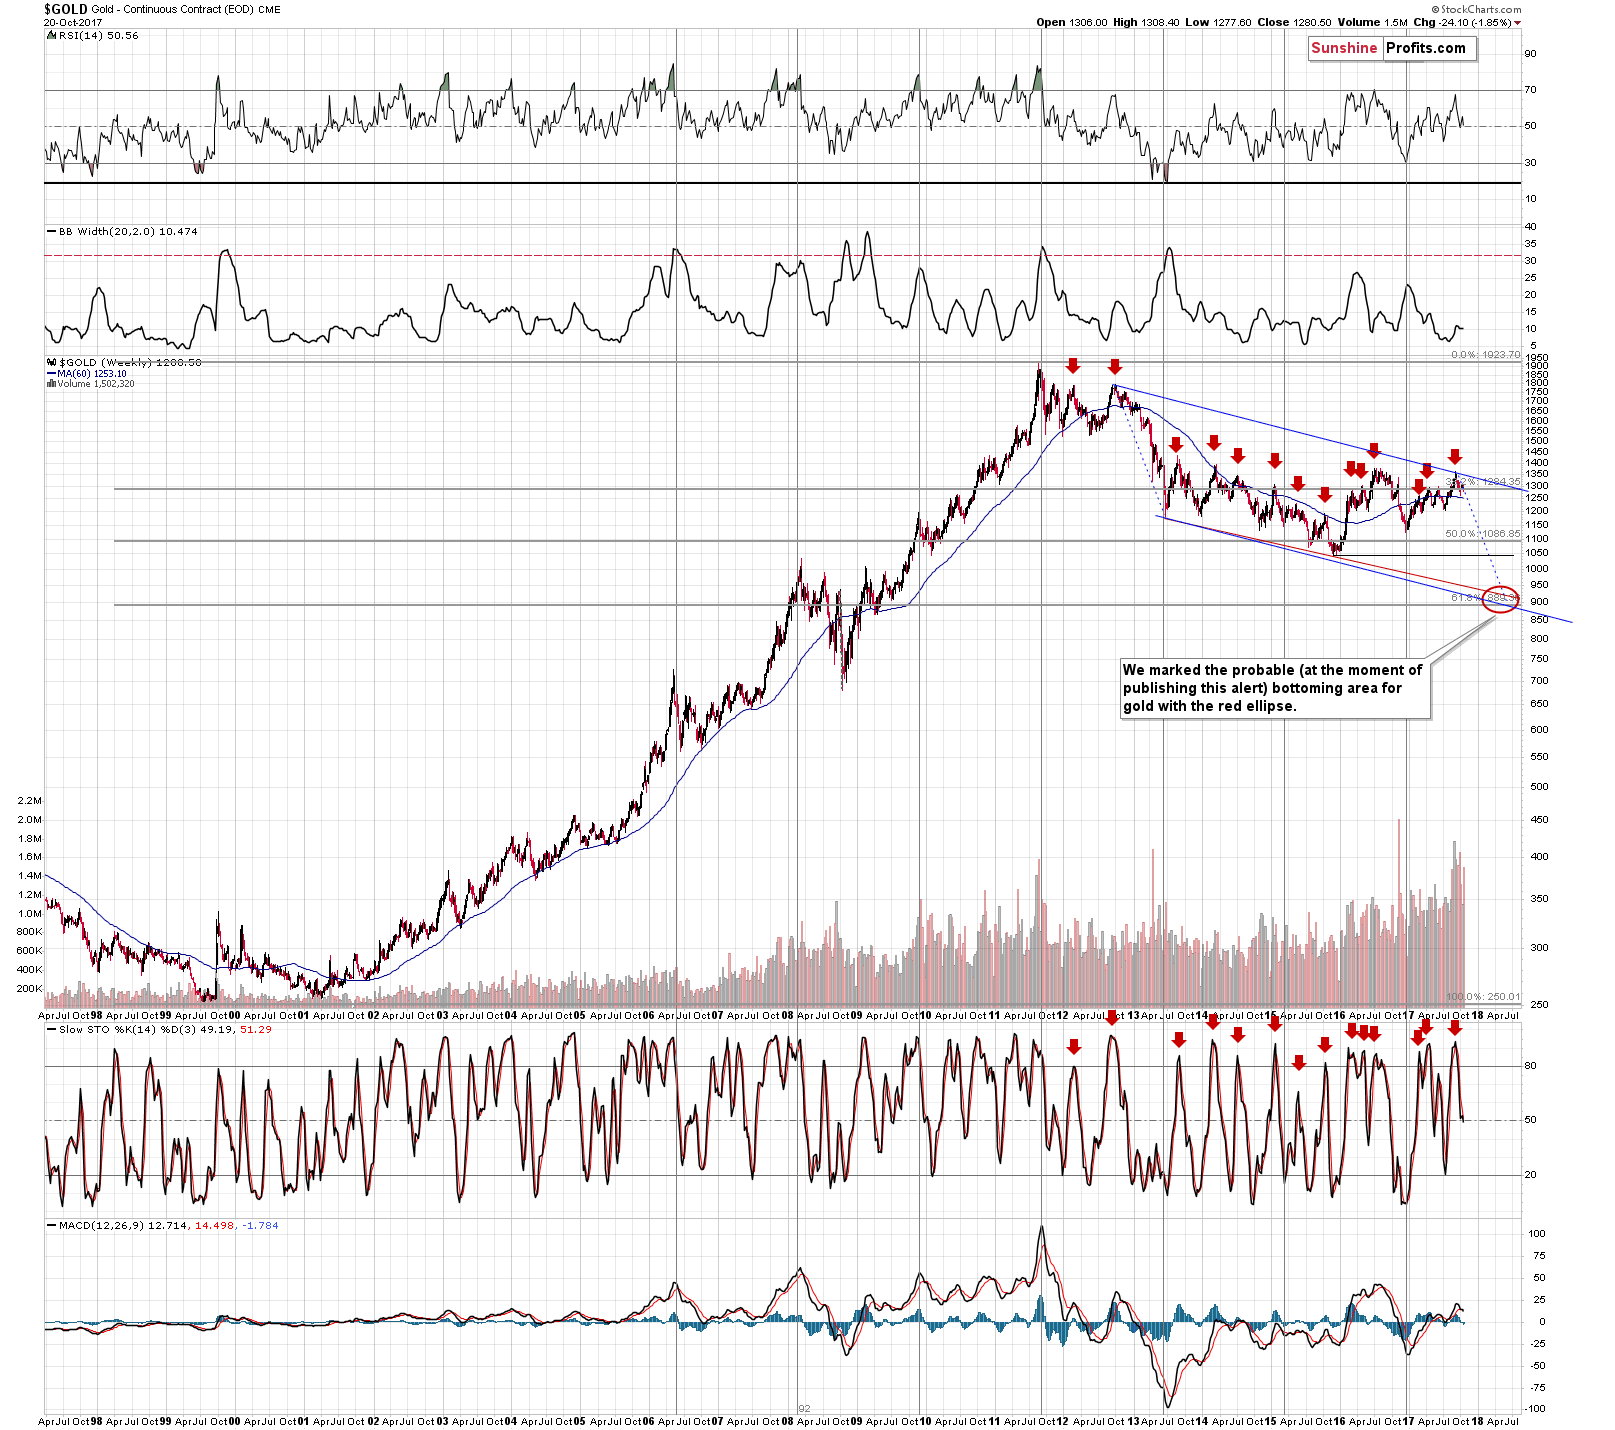
Gold closed visibly below the $1,300 level and also below the 38.2% Fibonacci retracement level based on the entire bull market. The weekly decline took place on volume that was in line with previous weekly declines and well above the previous week in which gold moved higher. All of the above have bearish implications for gold’s performance in the following weeks.
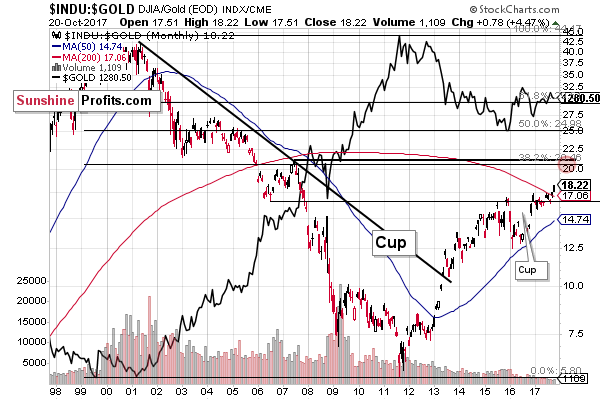
The Dow to gold chart shows that the ratio continues to rally after the breakout above the 2015 high and this makes the latter verified, which in turn makes subsequent rallies more likely. Since the big moves in the ratio and in gold are aligned (naturally, the directions are opposite), this implies a bigger move lower in gold in the following months.
As far as the short term is concerned, here’s what we wrote on gold and silver on Friday:
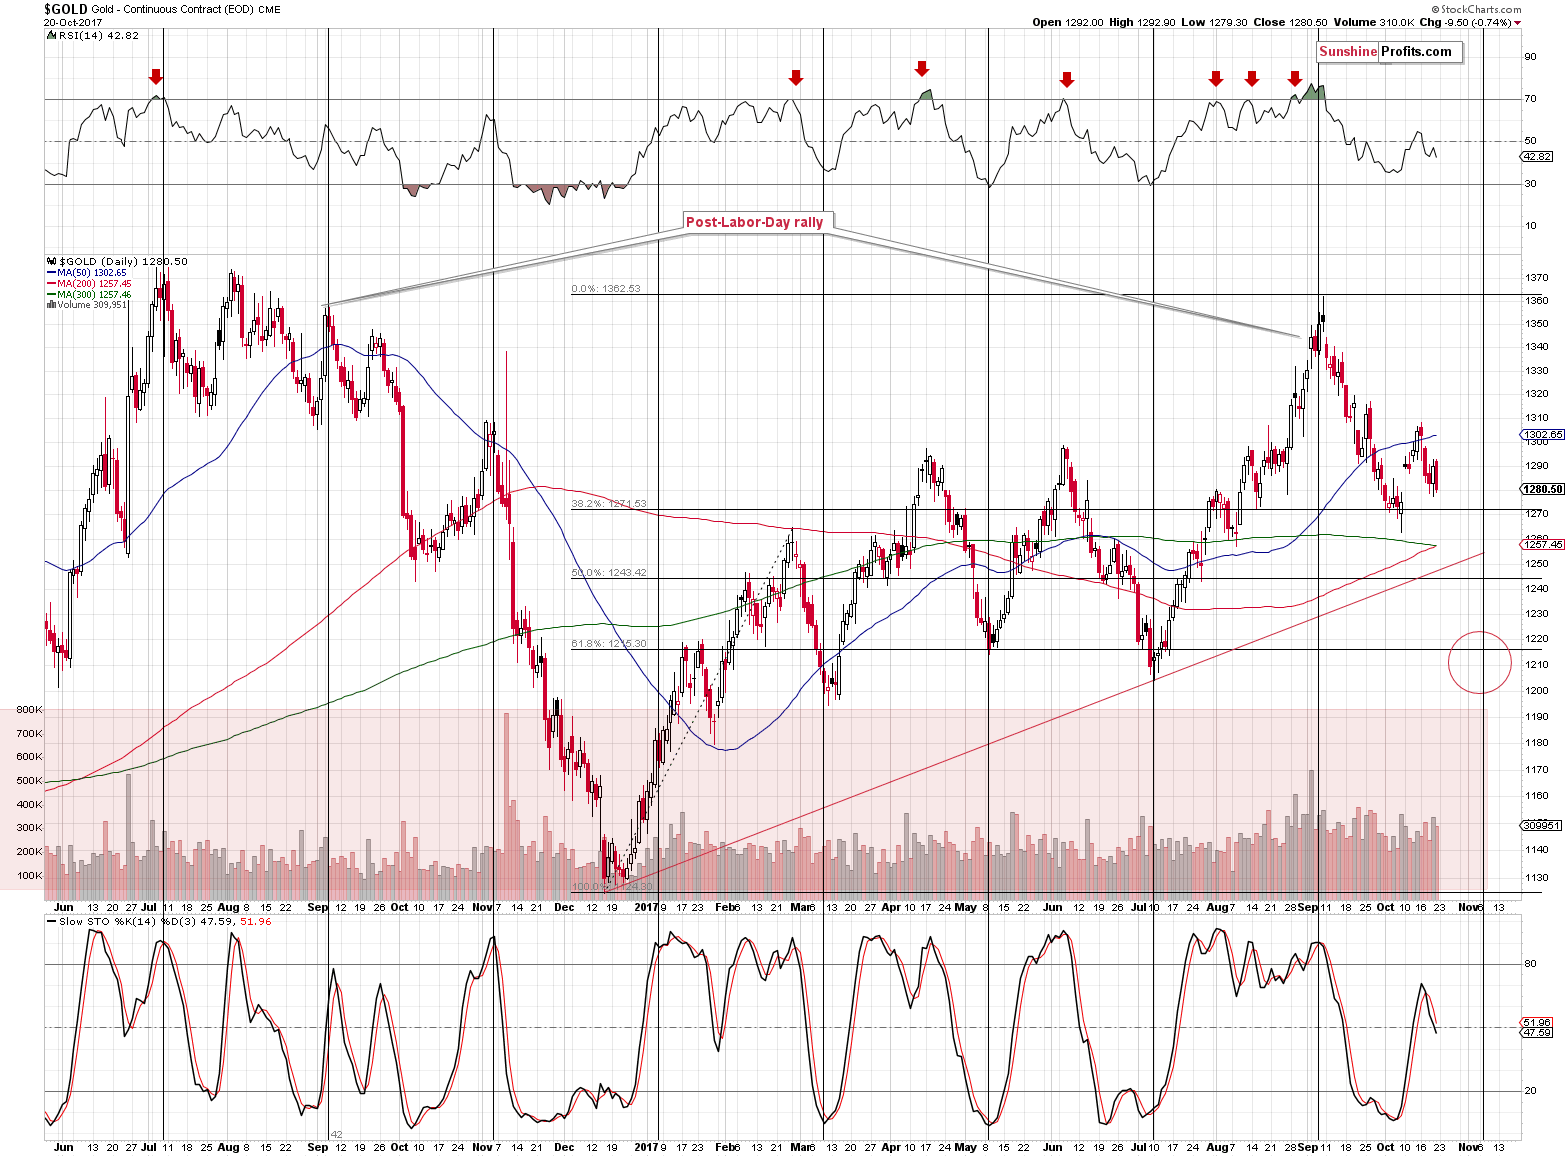
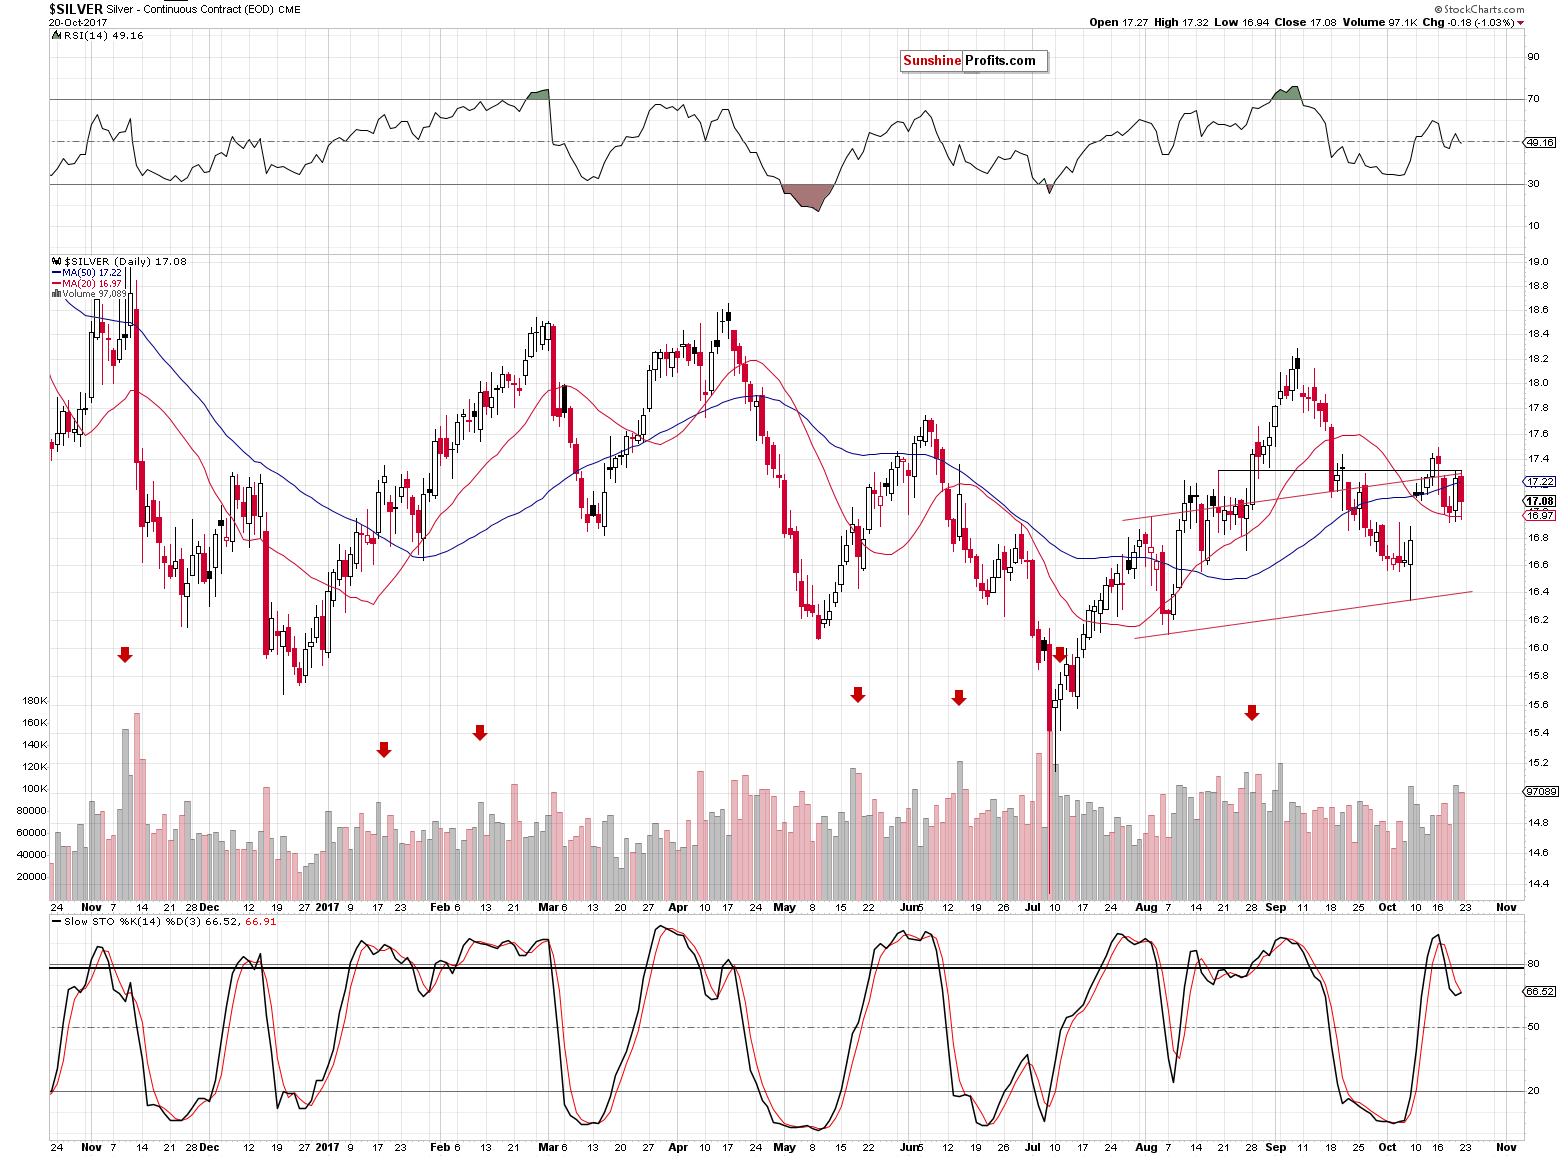
Gold rallied somewhat and silver rallied quite strongly, which – based on how silver tends to perform – is something that should raise one’s eyebrow. Today’s pre-market action already confirmed silver’s tendency to outperform right before declines as both moves were invalidated. Precisely, gold’s upswing was entirely invalidated, while silver’s upswing was invalidated “only” mostly.
Yesterday’s rallies seem to have been just a one-day anomaly and the trend seems to remain down – the Stochastic indicator didn’t even react to this one-day event.
The above remains up-to-date also today. The sell signals from the daily Stochastic indicator remain in place and the mentioned daily declines were not reversed before the end of the session, so Thursday’s upswing still seems to have been just a one-day anomaly.
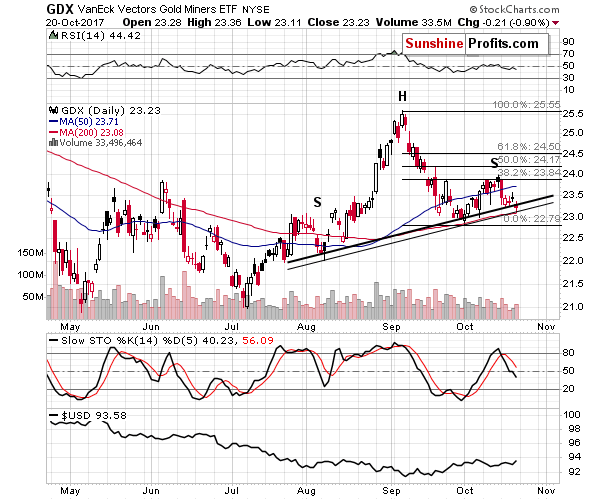
As far as mining stocks are concerned, we discussed the possibility of seeing a head-and-shoulders pattern and its implications:
What’s most interesting, though, is that mining stocks were barely affected. The GDX ETF moved only 11 cents higher and the volume that accompanied it was low.
Lagging miners and outperforming silver – that’s the combination that we described many times in the recent past as a clear bearish sign, so you were prepared for the turnaround and today’s downswing. While other investors might have bought into this sizable move in silver, you knew that it was likely a fake one.
Based on how gold and silver declined in today’s pre-market trading, it seems that mining stocks are about to slide once again. Such a slide could complete the head-and-shoulders formation that might have been forming (we will know only after the formation’s completion) since late July. Once completed, the formation will provide us with a downside target at about the May and July lows – which is in perfect tune with what we wrote about the target for gold in the following weeks and also in tune with the target area that we featured earlier for the HUI Index.
All in all, the outlook for the precious metals remains bearish.
Was the formation completed on Friday? It wasn’t in terms of intraday lows, but it was in the case of daily closing prices. It’s not clearly visible on the above chart, because the GDX only closed about 5 cents or so below the neck line, but still, that’s what happened. This is more clearly visible in the case of the HUI Index chart.
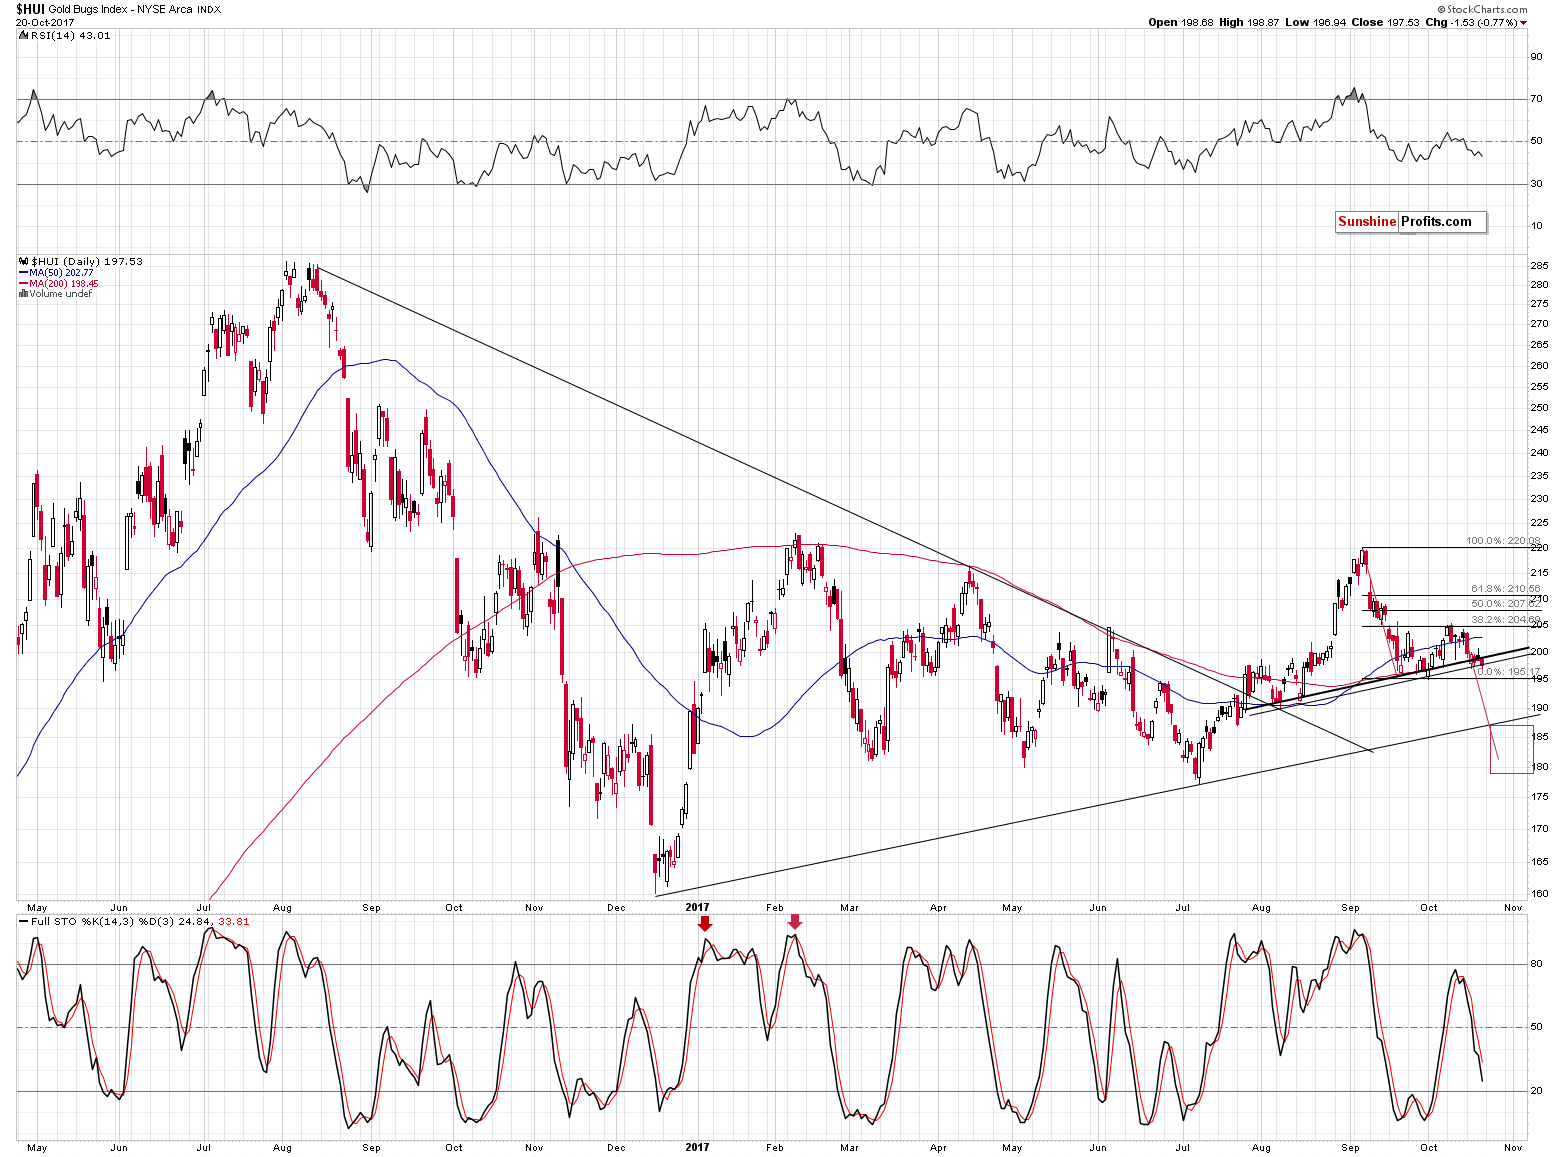
So far we’ve seen only one daily close below the neck level, so the breakdown is not confirmed, but the implications are already bearish.
The bearish implications are stronger because miners managed to break below the neck level despite a good reason not to – a soaring stock market.
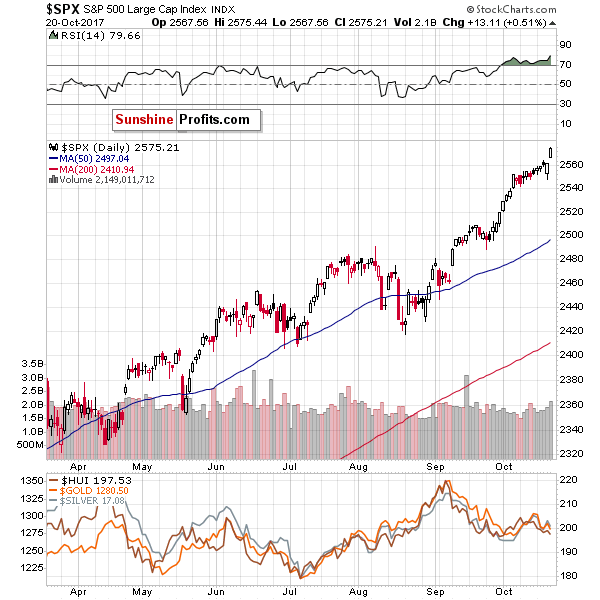
The main stock indices quite often impact mining stocks and the silver market on a very temporary basis and Friday’s performance was enough to at least prevent mining stocks from closing below an important support level – and yet, they didn’t. The implications for mining stocks and the rest of the precious metals market are bearish.
What about the USD Index? In short, not much changed since we commented on it in Friday’s alert and it continues to appear likely that it will support lower precious metals values in the near and more distant future.
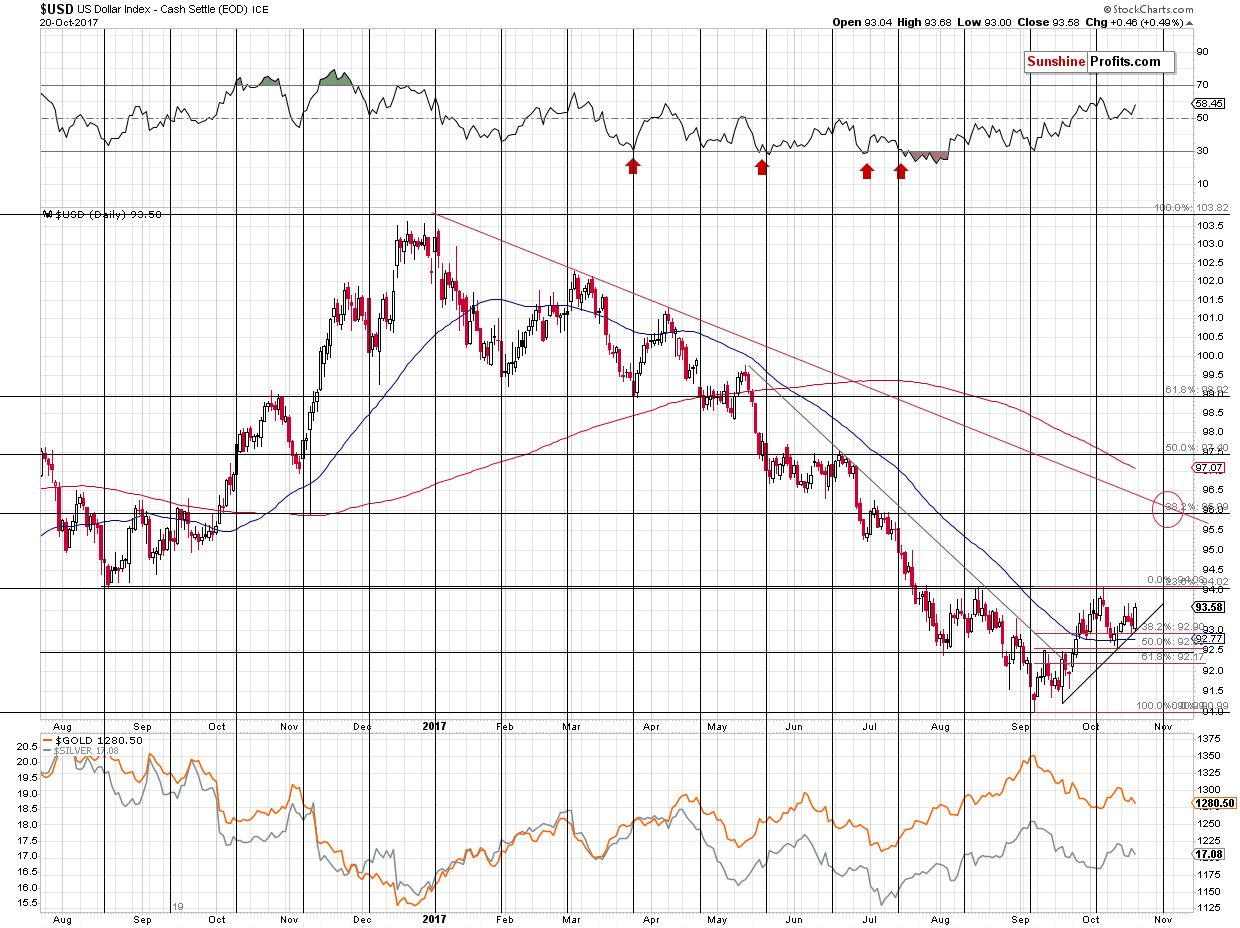
Quoting Friday’s alert:
In yesterday’s alert we explained why the $1,200 - $1,220 is likely the next step for gold and the reason was that several support levels coincide there and it is also strengthened by the turning point.
Applying the same methodology to the USD Index, we arrive at the 95.5 – 96.5 range with the 96 level being the most likely target. The above is in tune with the reverse-head-and-shoulders formation (if it is completed, that is), the 38.2% Fibonacci retracement level, the July high and the USD’s turning point.
Why is this important if one aims to trade the precious metals market and not currencies? Because if the USD Index reaches its target before gold does, it could indicate that a turnaround in both the USD and gold will take place anyway and thus it might be a good idea to limit the exposure to the precious metals market at that time. It could also work the other way, if gold reaches its target, but the USD Index doesn’t and we see no signs of a reversal in the gold market other than the target being reached, then perhaps gold will have further to fall before the reversal is seen. All in all, being aware of what’s going on in the USD Index helps in determining what’s next for gold and the rest of the precious metals sector.
Now, to be objective, there is also a possibility of seeing another temporary (!) decline in the USD Index, which would not invalidate the bigger trend. If the reverse-head-and-shoulders formation is to be completely symmetrical, then we might see another move low slightly below 92.5, because that would be in tune with what happened in early August. The rally in the USD that we saw in the first half of August took the form of a zigzag and thus the October decline could also take this form. If this happens, precious metals would probably move higher once again while miners would continue to lag. This move seems too small to adjust the position for it, but let’s keep the above possibility in mind – it’s not something that should come as a surprise. The outlook for the USD remains bullish nonetheless and the opposite is the case for gold.
Friday’s daily upswing and ending the week on a positive note seems to confirm the bullish USD outlook.
By the way, if you were wondering if the breakdown below the October lows in the Japanese yen and the lack thereof in gold change anything regarding the gold-yen link and the implications, in our opinion, it’s too early to say so. Based on our experience, the link between gold and currencies doesn't need to work on each and every day and still be important. There will always be daily or even weekly anomalies and thus we prefer to see a given development repeated before stating that a given link is broken. In particular, in the case of the USD Index, there were many cases when gold's reaction to USD's moves was delayed. Moreover, in many cases, gold was waiting for a breakout or breakdown in the USD and only responded (by catching up) when such a move was seen or confirmed. The next few weeks should show whether this is the case once again.
Before summarizing, we would like to add that we have a surprise for you – we are posting the most timely part of the upcoming Market Overview report ahead of the regular schedule and we are making it available to all the Gold & Silver Trading Alerts subscribers. This analysis covers the issue of Trump’s upcoming nomination of the next Federal Reserve Chair and it’s possible implications for the gold market. You can access this timely analysis using this link.
Summing up, it seems that the top in gold, silver and mining stocks is already in. Multiple bearish signals (i.a. gold’s huge monthly volume, the analogy in the HUI Index, the analogy between the two most recent series of interest rate hikes, and a breakout in Nikkei) point to much lower gold prices in the following months and the short-term signals also confirm the bearish outlook. The same goes for the weekly price and volume changes in gold.
As far as the following weeks are concerned, it seems that we could see another rebound during the decline, but not likely until gold moves to the $1,200 - $1,220 range, which is likely to take place in the first half of November. The analogous range for the USD Index is 95.5 – 96.5 with the 96 level being the most likely target.
As always, we will keep you – our subscribers – informed.
To summarize:
Trading capital (supplementary part of the portfolio; our opinion): Short positions (150% of the full position) in gold, silver and mining stocks are justified from the risk/reward perspective with the following stop-loss orders and exit price levels / profit-take orders:
- Gold: exit price: $1,218; stop-loss: $1,366; exit price for the DGLD ETN: $51.98; stop-loss for the DGLD ETN $38.74
- Silver: exit price: $15.82; stop-loss: $19.22; exit price for the DSLV ETN: $28.88; stop-loss for the DSLV ETN $17.93
- Mining stocks (price levels for the GDX ETF): exit price: $21.23; stop-loss: $26.34; exit price for the DUST ETF: $29.97; stop-loss for the DUST ETF $21.37
In case one wants to bet on junior mining stocks' prices (we do not suggest doing so – we think senior mining stocks are more predictable in the case of short-term trades – if one wants to do it anyway, we provide the details), here are the stop-loss details and exit prices:
- GDXJ ETF: exit price: $30.28; stop-loss: $45.31
- JDST ETF: exit price: $66.27; stop-loss: $43.12
Long-term capital (core part of the portfolio; our opinion): No positions (in other words: cash)
Insurance capital (core part of the portfolio; our opinion): Full position
Important Details for New Subscribers
Whether you already subscribed or not, we encourage you to find out how to make the most of our alerts and read our replies to the most common alert-and-gold-trading-related-questions.
Please note that the in the trading section we describe the situation for the day that the alert is posted. In other words, it we are writing about a speculative position, it means that it is up-to-date on the day it was posted. We are also featuring the initial target prices, so that you can decide whether keeping a position on a given day is something that is in tune with your approach (some moves are too small for medium-term traders and some might appear too big for day-traders).
Plus, you might want to read why our stop-loss orders are usually relatively far from the current price.
Please note that a full position doesn’t mean using all of the capital for a given trade. You will find details on our thoughts on gold portfolio structuring in the Key Insights section on our website.
As a reminder – “initial target price” means exactly that – an “initial” one, it’s not a price level at which we suggest closing positions. If this becomes the case (like it did in the previous trade) we will refer to these levels as levels of exit orders (exactly as we’ve done previously). Stop-loss levels, however, are naturally not “initial”, but something that, in our opinion, might be entered as an order.
Since it is impossible to synchronize target prices and stop-loss levels for all the ETFs and ETNs with the main markets that we provide these levels for (gold, silver and mining stocks – the GDX ETF), the stop-loss levels and target prices for other ETNs and ETF (among other: UGLD, DGLD, USLV, DSLV, NUGT, DUST, JNUG, JDST) are provided as supplementary, and not as “final”. This means that if a stop-loss or a target level is reached for any of the “additional instruments” (DGLD for instance), but not for the “main instrument” (gold in this case), we will view positions in both gold and DGLD as still open and the stop-loss for DGLD would have to be moved lower. On the other hand, if gold moves to a stop-loss level but DGLD doesn’t, then we will view both positions (in gold and DGLD) as closed. In other words, since it’s not possible to be 100% certain that each related instrument moves to a given level when the underlying instrument does, we can’t provide levels that would be binding. The levels that we do provide are our best estimate of the levels that will correspond to the levels in the underlying assets, but it will be the underlying assets that one will need to focus on regarding the signs pointing to closing a given position or keeping it open. We might adjust the levels in the “additional instruments” without adjusting the levels in the “main instruments”, which will simply mean that we have improved our estimation of these levels, not that we changed our outlook on the markets. We are already working on a tool that would update these levels on a daily basis for the most popular ETFs, ETNs and individual mining stocks.
Our preferred ways to invest in and to trade gold along with the reasoning can be found in the how to buy gold section. Additionally, our preferred ETFs and ETNs can be found in our Gold & Silver ETF Ranking.
As a reminder, Gold & Silver Trading Alerts are posted before or on each trading day (we usually post them before the opening bell, but we don't promise doing that each day). If there's anything urgent, we will send you an additional small alert before posting the main one.
=====
Latest Free Trading Alerts:
Last month, the World Gold Council (WGC) released a new edition of Gold Investor. What can we learn from the report?
WGC’s September Gold Investor: Gold’s Fear Trade
President Trump is to announce the next chair of the Federal Reserve soon. We invite you to read our today’s article about the candidates for the Fed Chair and find out who will be the best (and who the worst) for the gold market.
The Next Chair of the Fed and Gold
S&P 500 index gained 0.5% on Friday, as it reached new record high following breakout above short-term consolidation. Will uptrend continue ahead of quarterly corporate earnings releases?
More New Record Highs As S&P 500 Gets Closer To 2,600 Mark
There was a move down but it didn’t manage to bring Bitcoin down below $5,000. What might this mean for the market?
=====
Hand-picked precious-metals-related links:
PRECIOUS-Gold hits 2-week low as dollar rallies vs yen
Rio Tinto wants out of Grasberg now
=====
In other news:
Euro Drops, Bonds Gain as Spain on Edge; Dollar Up: Markets Wrap
Victory for Abenomics lifts world stocks to new record
The Winners and Losers of Japan's Landslide Election
Catalonia warns of civil disobedience as Madrid readies direct rule
Catalan Separatists Plot Response to Spain’s Shock and Awe
Hedge fund sues Barclays Bank for £650M over alleged copper market rigging
=====
Thank you.
Sincerely,
Przemyslaw Radomski, CFA
Founder, Editor-in-chief, Gold & Silver Fund Manager
Gold & Silver Trading Alerts
Forex Trading Alerts
Oil Investment Updates
Oil Trading Alerts

