

Briefly: in our opinion, full (300% of the regular position size) speculative short positions in mining stocks are justified from the risk/reward point of view at the moment of publishing this Alert.
Today’s analysis is going to be relatively brief, as practically everything that I wrote in yesterday's (Mar. 15) flagship analysis remains up-to-date. Nevertheless, I want to update you on the key markets where the outlook appears to have changed. These markets are gold and mining stocks.
Gold, silver, and mining stocks moved higher yesterday, and they did so without the bullish push from the declining USD Index. Conversely, the USD Index ended yesterday’s session a bit higher. Is this strength an indication that a bigger rally in gold is on the horizon?
In my opinion, this is not necessarily the case. This kind of supposedly bullish action could still be a purely technical (emotional) development. This week’s triangle-vertex-based reversal is due more or less now (or it was due yesterday – more on that shortly), which means that the yellow metal is likely to reverse shortly or that it has already done so. If it’s about to reverse right now, and the next big move is going to be to the downside, it means that gold practically had to rally beforehand. Therefore, the fact that it did is relatively normal and neutral, not bullish.
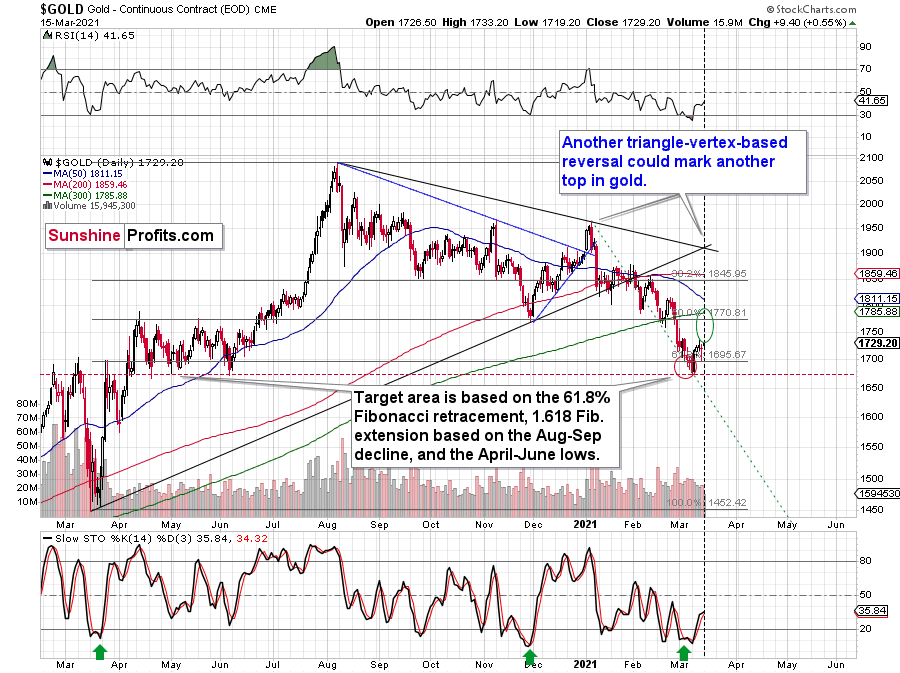
Based on the above chart, the triangle-vertex-based reversal point was due yesterday. However, based on the chart below, it’s due today.
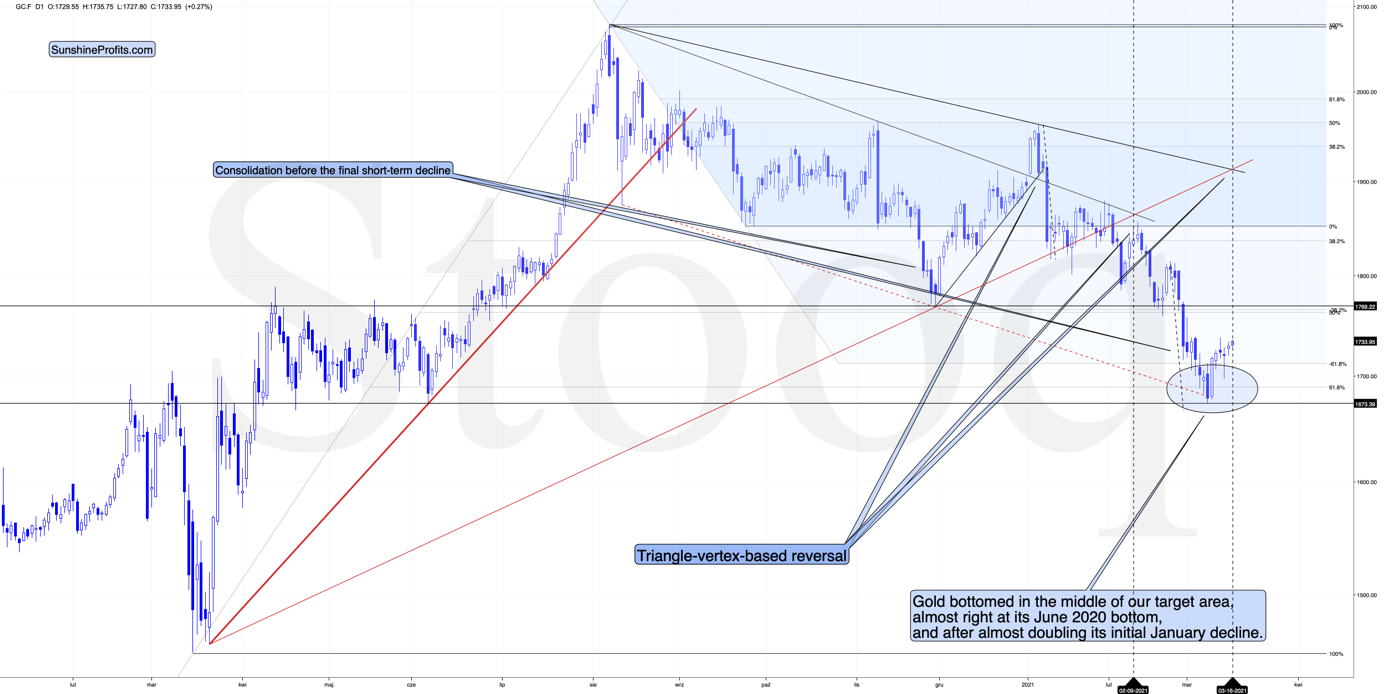
There might be slight differences between chart providers, which – if applied to relatively long-term lines – can distort the implications by a few pixels on the chart. These few pixels might mean a day (or so) of a difference in the case of the triangle-vertex-based formation.
Instead of going over charts of multiple providers on each day, it’s more useful to notice that the triangle-vertex-reversal points work on a near-to basis and thus expect a given reversal to take place close to the point suggested by the above technique, rather than going all-in based on the assumption that it will work perfectly. Every now and then it does work perfectly, but the “broad” approach is overall more useful.
At the moment of writing these words, I see that gold futures formed a small top just about $2 below the previous March high ($1,738). Consequently, both following scenarios would make sense in light of the current triangle-vertex-based reversal:
- Gold could decline right away as it doesn’t have to form a new high at the reversal point – just “a high”
- We could see another small, several-dollar rally, which would take gold to new monthly highs and make the triangle-vertex-based reversal work in a classic way, where it detects the final top for a given rally. The FOMC weeks tend to have higher intraday volatility, especially right before the interest rate decision is announced and during the press conference. This means that gold could move up and down in a quite volatile manner shortly.
Both scenarios seem quite possible and it’s hard to tell which of them is more likely. In both cases, it seems quite likely that another – big – decline will begin soon. Of course, I can’t promise that the rally is going to be completely over today, but this seems quite likely. And if not, it seems that it’s going to be over shortly, anyway.
And what about mining stocks?
The mining stocks remain in my upside target area, which means that they could have already topped, or that they could top a bit higher. Regardless, based on all the reasons that I discussed yesterday, and also based on the above comments on gold’s reversal, it seems that the days of this rally are numbered (and it’s not a big number, either).
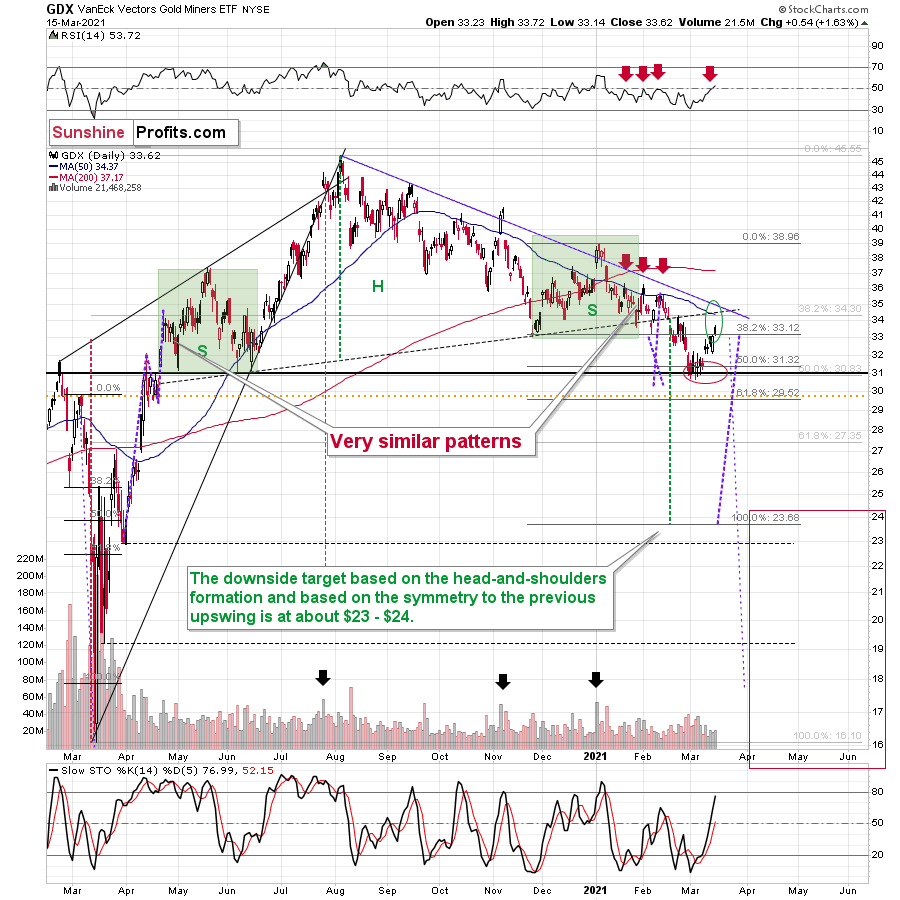
The neck level of the previously broken head and shoulders pattern, the declining blue resistance line, the 50-day moving average, the late-February high – they all create a very strong short-term resistance not far above yesterday’s closing price. But does it mean that the mining stocks have to move higher from here, or that such a rally would be likely?
Not necessarily. While miners managed to close yesterday’s session above the November low, they didn’t manage to close the day above the January and early-February lows in terms of the closing prices. About a month ago, the GDX tried to invalidate the breakdown below these levels, and this move failed – it was followed by a decline to new yearly lows. Will we see the same thing once again? It seems very likely in my view – the history tends to rhyme.
But how low could the GDX ETF go? My previous comments on that matter remain up-to-date, but I would like to stress that just because the downside target area is relatively far, it doesn’t mean that we will necessarily hold our positions until it’s reached. If we see signs of strength that seem reliable (like miners refusing to decline even though gold moves lower combined with gold reaching an important support level while the USDX encounters resistance), I might write about temporarily closing this position – and perhaps even going long one more time – and we might be able to reap additional profits on the corrective upswing, just as I did earlier this month.
Our final downside target area ($15 – $24.5) is quite broad, because a lot depends on what the general stock market will do. I’ll be looking at gold for the key signs along with a few other factors (including the Gold Miners Bullish Percent Index) and determined the buying opportunity based on them – not necessarily based on the price of the GDX or GDXJ by itself.
Yes, this target is quite low, and thus might appear unrealistic, but let’s consider the following:
- Miners are slightly above their early-2020 high – just like gold.
- Gold is likely to decline to its 2020 lows or so
- General stock market might have just topped.
Considering all three above factors it’s clear that a move to even the 2020 lows is not out of the question.
And this means that junior miners might decline more than senior miners. A move from the current levels to the 2020 would imply a decline by about 50% in case of the GDX, and by about 60% in case of the GDXJ.
Having said that, let’s take a look at the market from a more fundamental angle.
Powell’s Predicament
With the U.S. Federal Open Market Committee (FOMC) holding its two-day policy meeting on Mar. 16/17, Jerome Powell, Chairman of the U.S. Federal Reserve, is skating on thin ice.
On April 1, 2020, the FED announced that U.S. banks could exclude U.S. Treasuries from their Supplementary Leverage Ratios (SLR) – a move designed “to ease strains in the Treasury market resulting from the coronavirus.” However, with the Mar. 31 deadline fast-approaching, the FED has to decide whether or not to extend the Treasury exemption.
For context, U.S. banks have to hold liquid capital (collateral) against their total leverage exposure. And when the FED introduced the Treasury exemption, it enabled U.S. banks to increase their Treasury holdings and/or reduce their collateral.
However, if the SLR exemption is not extended, $650 billion worth of U.S. Treasuries could be sold in the coming weeks.
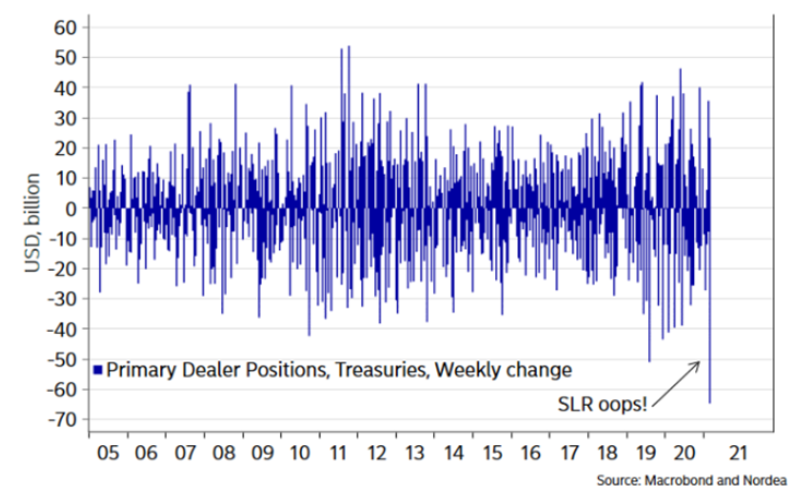
Sensing that the writing is on the wall, last week, primary dealers sold more than $60 billion worth of U.S. Treasuries – offloading their positions at the fastest pace ever. For context, primary dealers are large financial institutions – like J.P. Morgan, Barclays, Wells Fargo and Citigroup – that underwrite government debt and often serve as market makers for the FED.
Please see below:
To avoid a catastrophe, investors expect Powell to hint at some form of yield curve control (YCC). To explain, I wrote on Mar. 4:
Dubbed Operation Twist 3.0, the strategy requires the FED to buy long-term Treasuries and sell short-term Treasures in order to flatten the yield curve (reduce the spread between short-term and long-term interest rates). Despite its implementation poised to suppress bond yields, buoy equities and breathe new life into the PMs, the sugar high will inevitably wear off. You can only stretch a rubber band so far before it snaps.
And what’s the rubber band exactly?
Well, I wrote on Jan. 15:
The FED remains stuck between a rock and a hard place:
- If they let yields rise, the cost of borrowing rises, the cost of equity rises, and the U.S. dollar is supported (all leading to shifts in the bond and stock markets and destroying the halcyon environment they worked so hard to create).
- To stop yields from rising, the U.S. Federal Reserve (FED) has to increase its asset purchases (and buy more bonds in the open market). However, the added liquidity should have the same net-effect because it increases inflation expectations (which a precursor to higher interest rates).
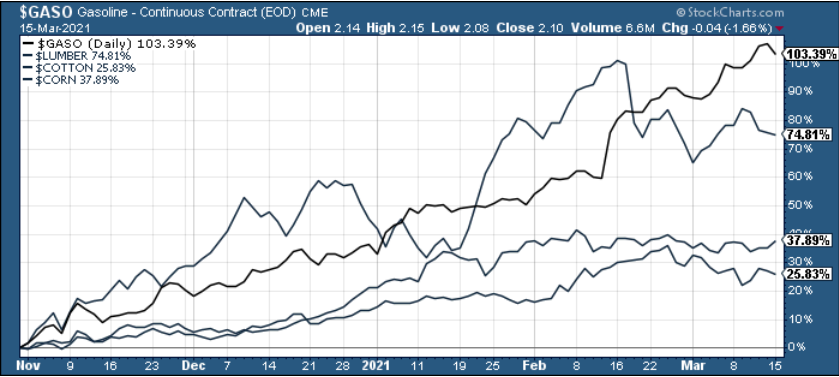
Walking a tightrope, Powell refuses to allow option #1. However, option #2 is akin to putting out a fire by pouring on more gasoline. If you analyze the chart below, you can see that gasoline (no pun intended) prices have more than doubled since November. As a result, implementing YCC will only exacerbate inflation expectations.
So where does this leave us?
Well, when you combine Powell’s Treasury quandary with an evolving inflation trap, the be damned if you do, damned if you don’t predicament is extremely bullish for the USD Index.
Case in point: the U.S. 10-Year Treasury yield has been artificially suppressed by the FED’s policies. But with the central bank running out of bullets (not quite, but getting there), global PMIs imply a U.S. 10-Year Treasury yield that’s north of 3.00%.
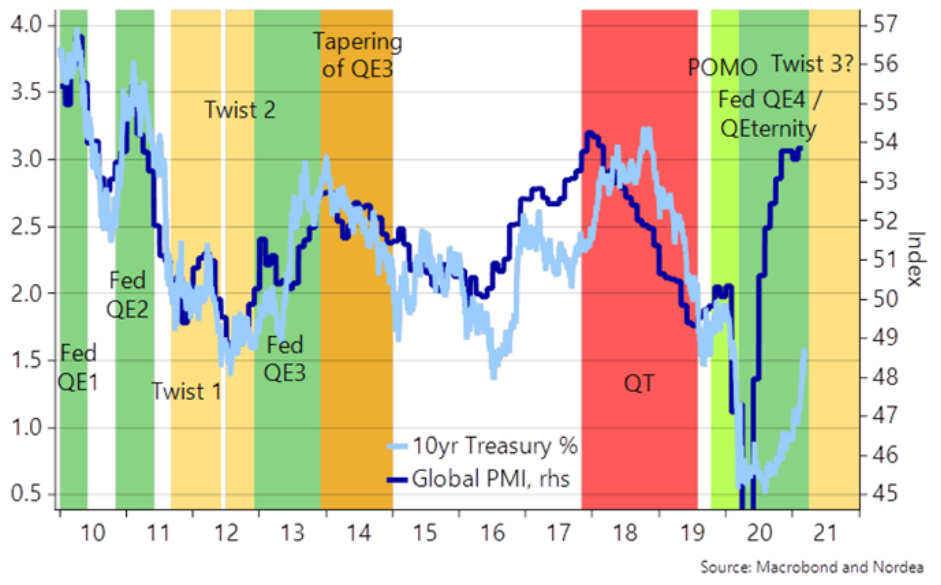 To explain, the dark blue line above tracks global PMIs, while the light blue line above tracks the U.S. 10-Year Treasury yield. And if you analyze the right side of the chart, you can see the extreme divergence. However, if the FED doesn’t introduce YCC, it’s only a matter of time before the latter catches up to the former.
Furthermore, the EUR/USD accounts for nearly 58% of the movement in the USD Index. And I’ve warned on several occasions that relative outprinting by the European Central Bank (ECB) is fundamentally bearish for the EUR/USD.
On Jan. 22, I wrote:
The ECB decreased its bond purchases toward the end of December (2020), Then, once January hit (2021), it was back to business as usual. As a result, the ECB’s attempt to scale back its asset purchases was (and will be) short-lived. And as the economic conditions worsen, the money printer will be working overtime for the foreseeable future.
On Mar. 11, as expected, the ECB announced that its weekly PEPP purchases (pandemic emergency purchase program) would “be conducted at a significantly higher pace.”
Please see below:
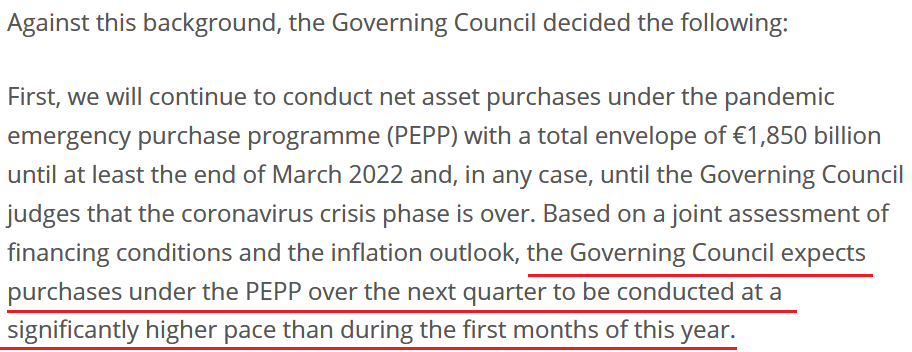 Source: ECB
But even more revealing, the ECB actually increased its PEPP purchases (last week) before making the Mar. 11 announcement. And because actions speak louder than words, the ECB’s behavior is an acknowledgment that the Eurozone economy is extremely weak.
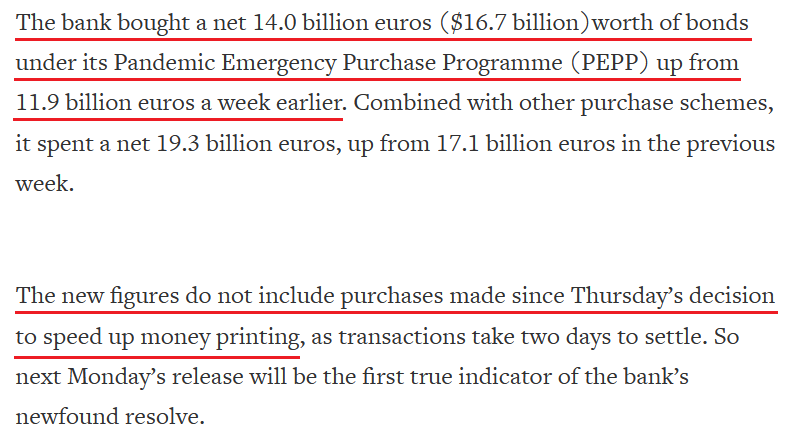 Source: Reuters
Continuing the theme, the EUR/USD fire sale has also continued for a second-straight week. With non-commercial (speculative) futures traders reducing their long positions by more than 15,000 contracts and increasing their short positions by nearly 9,000 contracts, euro bulls are quietly retreating to their stables.
Please see below:
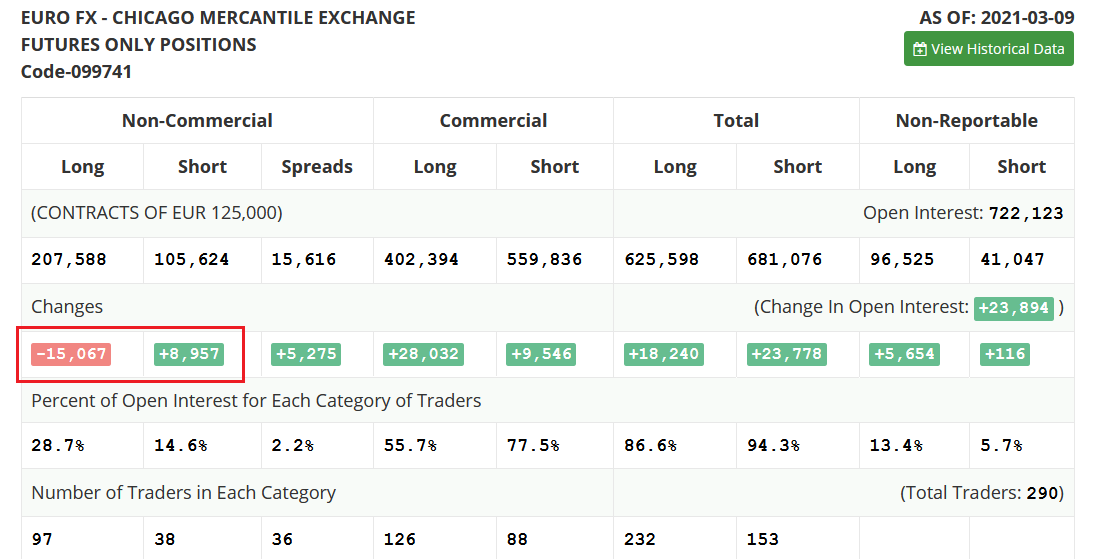 Source: COT
Adding to Europe’s ills, Germany, France, Italy and Spain – Europe’s four-largest economies – announced on Mar. 15 that they’re suspending use of AstraZeneca’s COVID-19 vaccine. While the medical decision is prudent – given the concerns over blood clots – the economic ramifications are material. Even before the decision, European vaccinations were drastically lower than the U.S.
Please see below:
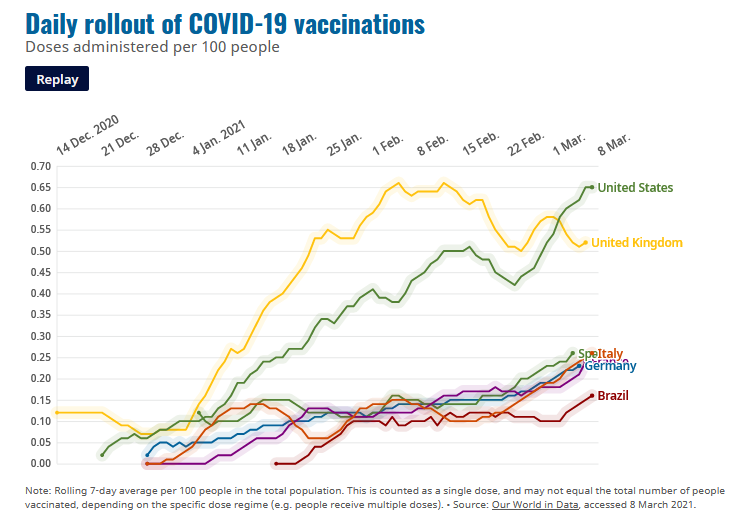
Now, with a ‘third wave’ unfolding across Europe, Italy has already announced new lockdown measures. And because Italy is likely a proxy for the rest of Europe, surging cases and dwindling vaccinations remain EUR/USD bearish.
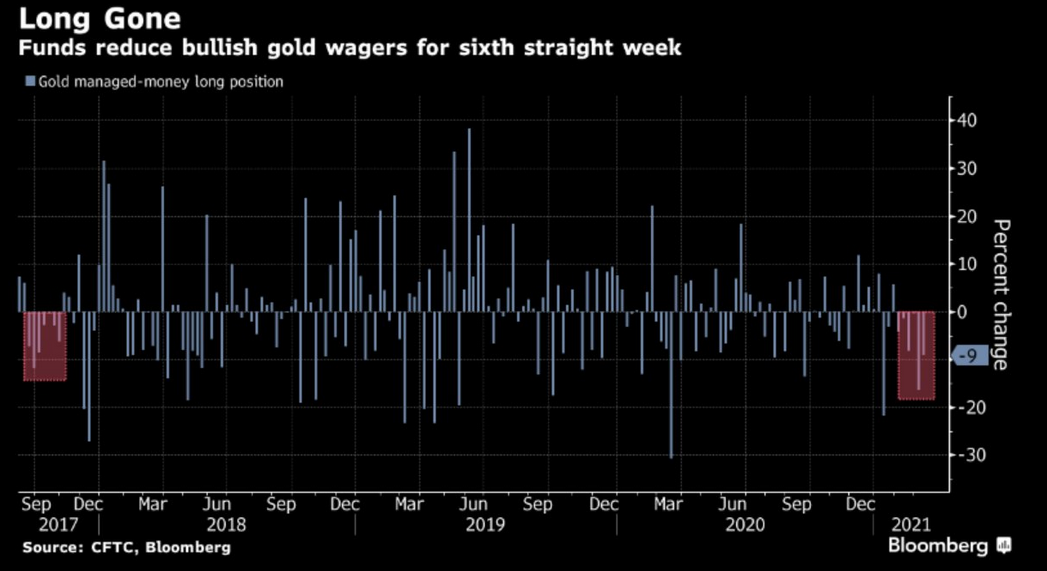
As it relates to the PMs, anticipating an environment of higher U.S. Treasury yields (unless Powell works his short-term magic) and a stronger USD Index, Commodity Trading Advisors (CTAs) have reduced their gold positions for six-straight weeks (the shaded area on the right side of the chart below).
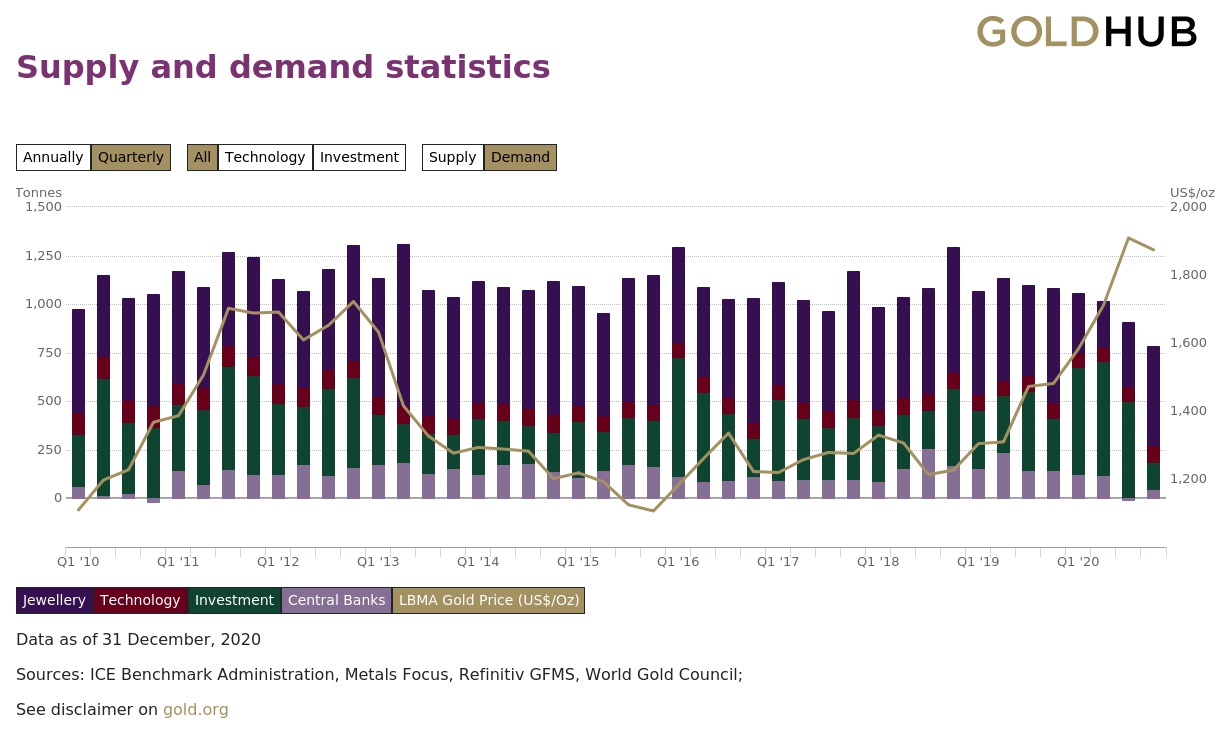
As a secondary source of weakness, combined demand for gold from jewelry, technology, central bank and investment cohorts has declined for six-straight quarters and ended 2020 at the lowest level in more than 10 years.
In conclusion, Powell could make-or-break the bond market over the next two days and the reaction (either way) will likely cascade across the precious metals’ market. Remember though: his strategy of sweeping problems under the rug only increases the cleanup over the medium-term. As a result, YCC will likely result in an even more violent reaction down the road. Because of this, the PMs’ foundation is likely to crack. With higher U.S. Treasury yields and a resurgent USD Index poised to create the perfect storm for the PMs, their fate is likely already sealed. However, once the storm passes, we’ll be presented with a secular buying opportunity to go long the PMs once again.
Overview of the Upcoming Part of the Decline
- It seems to me that we are already after the initial bottom and the initial correction. If not, then it seems likely to me that the corrective upswing will be completed within a week. It’s more likely that the next big move lower is already underway, though.
- After miners slide once again in a meaningful and volatile way, but silver doesn’t (and it just declines moderately), I plan to switch from short positions in miners to short positions in silver (this could take another 1-2 weeks to materialize). I plan to exit those short positions when gold shows substantial strength relative to the USD Index, while the latter is still rallying. This might take place with gold close to $1,450 - $1,500 and the entire decline (from above $1,700 to about $1,475) would be likely to take place within 1-12 weeks and I would expect silver to fall hardest in the final part of the move. This moment (when gold performs very strongly against the rallying USD and miners are strong relative to gold – after gold has already declined substantially) is likely to be the best entry point for long-term investments in my view. This might happen with gold close to $1,475, but it’s too early to say with certainty at this time. In other words, the entire decline could take between 1 and 12 weeks, while silver declines particularly fast in the final 1-2 weeks.
- If gold declines even below $1,500 (say, to ~$1350 or so), then it could take another 10 weeks or so for it to bottom, but this is not what I view as a very likely outcome.
- As a confirmation for the above, I will use the (upcoming or perhaps we have already seen it?) top in the general stock market as the starting point for the three-month countdown. The reason is that after the 1929 top, gold miners declined for about three months after the general stock market started to slide. We also saw some confirmations of this theory based on the analogy to 2008. All in all, the precious metals sector would be likely to bottom about three months after the general stock market tops . If the mid-February 2020 top was the final medium-term top, then it seems that we might expect the precious metals sector to bottom in mid-May or close to May’s end.
- The above is based on the information available today and it might change in the following days/weeks.
Letters to the Editor
(I’m including just one question today, separated into two parts; please keep in mind that even though it’s provided as a conversation, it’s my general opinion, not individual investment advice.)
Q1: I hope you are doing fantastic. I have a very important question for you, and I hope you can give me your opinion. If I measured the amount of profit shorting the GDXJ (1x) or going long with JDST (2x) or the GDXD (3x) from the time Gold peaked in Aug 2020 to Dec 2020, shorting the GDXJ is by far the best choice, as you also mentioned in a previous newsletter. Now, in one of my personal accounts I'm using to follow your recommendations and benefit from the upcoming decline, it does not let me short the GDXJ ETF (it does let me go long on anyone), due to the nature of the account. So, if you'd have to pick another ETF that you could use and go long (i.e., JDST, GDXD), what else would you use as a proxy for the GDXJ? I reviewed your list of short ETFs, and like I said, the performance is not there – I understand the 2x, 3x leverage is the main factor. Is there another (1x) long ETF of your preference? Thanks again for everything – your time and dedication to your subscribers.
A1: Thank you, I’m doing quite fine these days, and I hope everything’s fine on your end as well.
Unfortunately, I don’t know of any unleveraged AND inverse ETF / ETN for gold mining stocks.
[EDITED: If anyone does, I’d appreciate bringing this to my attention. After my previous request for that, I received no input, so it seems that there simply aren’t any available.]
One unleveraged and inverse option would be to use the SBUL (WisdomTree Gold 1x Daily Short), but it’s an inverse gold product, not one based on gold mining stocks.
Another idea would be to use (buy) put options (with a relatively long time to expiration - at least several months) but use only a small amount of capital for it.
And yet another idea would be to change the brokerage to one that allows you to short the GDXJ (but I guess this is out of the question).
Q2: Thanks for the reply, PR. I appreciate and value your opinion; I’m your # 1 fan. The main reason why I asked you this – besides of course one being the nature of my account and not being able to short the GDXJ – is also because of your comments on the JDST (2x) and the GDXD (3x), and how this type of leverage is not recommended for everyone.
The long stocks you’ve recommended are currently trading JDST $11.12 – profit take at $39.87 and the GDXD currently trading $24.08, and your profit take suggested of $94.87. I understand the huge significant day-to-day volatility we might see because of the leverage, but based on the targets you’ve provided, there is a clear upside with your targets, so is there another reason why you would not recommend using the JDST(2x) and GDXD (3x)?
Thanks for your response last night – it was beneficial to see that that there is an opportunity with the SBUL (1x) option.
And thanks again for your suggestions and opinions with this, I’ll try not to take up too much of your time after this one.
A2: Thanks, and I’m very happy to reply to you and share these replies with others – this also helps in providing a better service, as it’s usually the case that many people are wondering about the same thing.
One reason against the highly leveraged products is the volatility, which not everyone can handle emotionally.
Another reason against the highly leveraged ETF/ETNs is that this high leverage makes one lose capital over time if the market is simply moving back and forth in a significant way (decline by 50% and a rally by 50% doesn’t mean getting even – after a 50% decline one needs to gain 100% to get back even).
Due to the above, if the market is moving in the “right” direction, but at a relatively slow pace, the negative effect of short-term volatility can cancel out the positive effect of being right on the direction of the market – that’s what you noticed when you wrote that shorting the GDXJ would have provided better results than going long JDST in August 2020.
The final reason is connected with both the above – patience is sometimes required until a given move starts, and before that takes place, one could see their position significantly underwater for weeks (or months in more extreme cases). Based on my experience, most people can’t handle that, and they abandon their trades before the move takes place (often at the worst possible moment), as that’s when emotions hit extremes.
The more advanced traders tend to remember to trade only limited amounts of capital and they make sure that they can easily afford to lose this capital, and when they enter a position, they really know why they entered it, and they know for how long they are going to hold it.
There’s no easy way around the former – keeping the positions reasonable is imperative.
As far as the latter is concerned, one could say that it’s easy because they would follow the Gold & Silver Trading Alerts. We just cashed out nice profits on the previous long position… But what if a position was going nowhere for many weeks? I – the person conducing the analysis – am sure that my techniques were useful, and that if a position remains justified, I’ll feel confident and calm holding it. I am also accepting that some trades will be losing ones, and this doesn’t affect my sleep, etc. But would this be equally true to others, who are relying on me being correct about the market? Theoretically, everyone knows that it’s impossible to be right each and every time, but practice shows that nobody wants to hold a losing position for longer. Every time they look at their portfolio statistics, they will feel the pain of loss all over again. More advanced traders know not to look at their portfolio statistics too frequently as it makes them more emotional about the market, which actually decreases the chance of being successful in trading. They also know that even if they lose this trade, it won’t matter much, as there will be many more trades in the future.
You see where I’m getting with this? The leverage, especially leverage on ETFs/ETNs that is connected with the time decay is like putting the above mechanism on steroids. And just like steroids - it seems to work in theory and in some cases it’s reasonable, but in most cases, the side effects are not worth it.
Am I saying a definitive “no” to leverage? I’m not. I’m just emphasizing that – as a chef’s knife – it can be useful, and it can be dangerous. And it tends to be more useful and less dangerous as one gets more advanced in investment and trading and is more confident in what they’re doing.
Summary
To summarize, the PMs’ medium-term decline is well underway, and based on the recent performance of the USD Index, gold and mining stocks, it seems that the corrective upswing is already over (or about to be over). The next big move lower seems to be already underway or about to start.
In addition, because we’re likely entering the “winter” part of the Kondratiev cycle (just like in 1929 and then the 1930s), the outlook for the precious metals’ sector remains particularly bearish during the very first part of the cycle, when cash is king.
The confirmed breakout in the USD Index is yet another confirmation of the bearish outlook for the precious metals market.
After the sell-off (that takes gold to about $1,450 - $1,500), we expect the precious metals to rally significantly. The final part of the decline might take as little as 1-5 weeks, so it's important to stay alert to any changes.
Most importantly, please stay healthy and safe. We made a lot of money last March and it seems that we’re about to make much more on this March decline, but you have to be healthy to enjoy the results.
As always, we'll keep you - our subscribers - informed.
By the way, we’re currently proving you with a possibility to extend your subscription for a year, two years or even three years with a special 20% discount. This discount can be applied right away, without the need to wait for your next renewal – if you choose to secure your premium access and complete the payment upfront. The boring time in the PMs is definitely over and the time to pay close attention to the market is here. Naturally, it’s your capital, and the choice is up to you, but it seems that it might be a good idea to secure more premium access now, while saving 20% at the same time. Our support team will be happy to assist you in the above-described upgrade at preferential terms – if you’d like to proceed, please contact us..
To summarize:
Trading capital (supplementary part of the portfolio; our opinion): Full speculative short positions (300% of the full position) in mining stocks are justified from the risk to reward point of view with the following binding exit profit-take price levels:
Mining stocks (price levels for the GDXJ ETF): binding profit-take exit price: $24.12; stop-loss: none (the volatility is too big to justify a stop-loss order in case of this particular trade)
Alternatively, if one seeks leverage, we’re providing the binding profit-take levels for the JDST (2x leveraged) and GDXD (3x leveraged – which is not suggested for most traders/investors due to the significant leverage). The binding profit-take level for the JDST: $39.87; stop-loss for the JDST: none (the volatility is too big to justify a SL order in case of this particular trade); binding profit-take level for the GDXD: $94.87; stop-loss for the GDXD: none (the volatility is too big to justify a SL order in case of this particular trade).
For-your-information targets (our opinion; we continue to think that mining stocks are the preferred way of taking advantage of the upcoming price move, but if for whatever reason one wants / has to use silver or gold for this trade, we are providing the details anyway.):
Silver futures upside profit-take exit price: unclear at this time - initially, it might be a good idea to exit, when gold moves to $1,512.
Gold futures upside profit-take exit price: $1,512.
Long-term capital (core part of the portfolio; our opinion): No positions (in other words: cash
Insurance capital (core part of the portfolio; our opinion): Full position
Whether you already subscribed or not, we encourage you to find out how to make the most of our alerts and read our replies to the most common alert-and-gold-trading-related-questions.
Please note that we describe the situation for the day that the alert is posted in the trading section. In other words, if we are writing about a speculative position, it means that it is up-to-date on the day it was posted. We are also featuring the initial target prices to decide whether keeping a position on a given day is in tune with your approach (some moves are too small for medium-term traders, and some might appear too big for day-traders).
Additionally, you might want to read why our stop-loss orders are usually relatively far from the current price.
Please note that a full position doesn't mean using all of the capital for a given trade. You will find details on our thoughts on gold portfolio structuring in the Key Insights section on our website.
As a reminder - "initial target price" means exactly that - an "initial" one. It's not a price level at which we suggest closing positions. If this becomes the case (like it did in the previous trade), we will refer to these levels as levels of exit orders (exactly as we've done previously). Stop-loss levels, however, are naturally not "initial", but something that, in our opinion, might be entered as an order.
Since it is impossible to synchronize target prices and stop-loss levels for all the ETFs and ETNs with the main markets that we provide these levels for (gold, silver and mining stocks - the GDX ETF), the stop-loss levels and target prices for other ETNs and ETF (among other: UGL, GLL, AGQ, ZSL, NUGT, DUST, JNUG, JDST) are provided as supplementary, and not as "final". This means that if a stop-loss or a target level is reached for any of the "additional instruments" (GLL for instance), but not for the "main instrument" (gold in this case), we will view positions in both gold and GLL as still open and the stop-loss for GLL would have to be moved lower. On the other hand, if gold moves to a stop-loss level but GLL doesn't, then we will view both positions (in gold and GLL) as closed. In other words, since it's not possible to be 100% certain that each related instrument moves to a given level when the underlying instrument does, we can't provide levels that would be binding. The levels that we do provide are our best estimate of the levels that will correspond to the levels in the underlying assets, but it will be the underlying assets that one will need to focus on regarding the signs pointing to closing a given position or keeping it open. We might adjust the levels in the "additional instruments" without adjusting the levels in the "main instruments", which will simply mean that we have improved our estimation of these levels, not that we changed our outlook on the markets. We are already working on a tool that would update these levels daily for the most popular ETFs, ETNs and individual mining stocks.
Our preferred ways to invest in and to trade gold along with the reasoning can be found in the how to buy gold section. Furthermore, our preferred ETFs and ETNs can be found in our Gold & Silver ETF Ranking.
As a reminder, Gold & Silver Trading Alerts are posted before or on each trading day (we usually post them before the opening bell, but we don't promise doing that each day). If there's anything urgent, we will send you an additional small alert before posting the main one.
Thank you.
Przemyslaw Radomski, CFA
Founder, Editor-in-chief

