

Briefly: In our opinion, full (150% of the regular full position) speculative short positions in gold, silver and mining stocks are justified from the risk/reward perspective at the moment of publishing this alert.
It was only yesterday that we warned that gold could invalidate Friday’s breakout just as it had invalidated its upswing in November 2016 and exactly the same thing happened during the session. Gold declined more during a single day than it had rallied in the past week and silver declined more during a single day than it had rallied in the past week. What changed and what’s next?
Not much changed regarding the outlook because Friday’s rally didn’t really make it bullish. The increased chance of seeing another small (!) move higher just decreased to levels below the pre-Friday-rally ones. In other words, overall, the outlook for PMs is now even more bearish than it was before Friday’s session. Let’s take a look at the details (chart courtesy of http://stockcharts.com).
Quoting our yesterday’s alert:
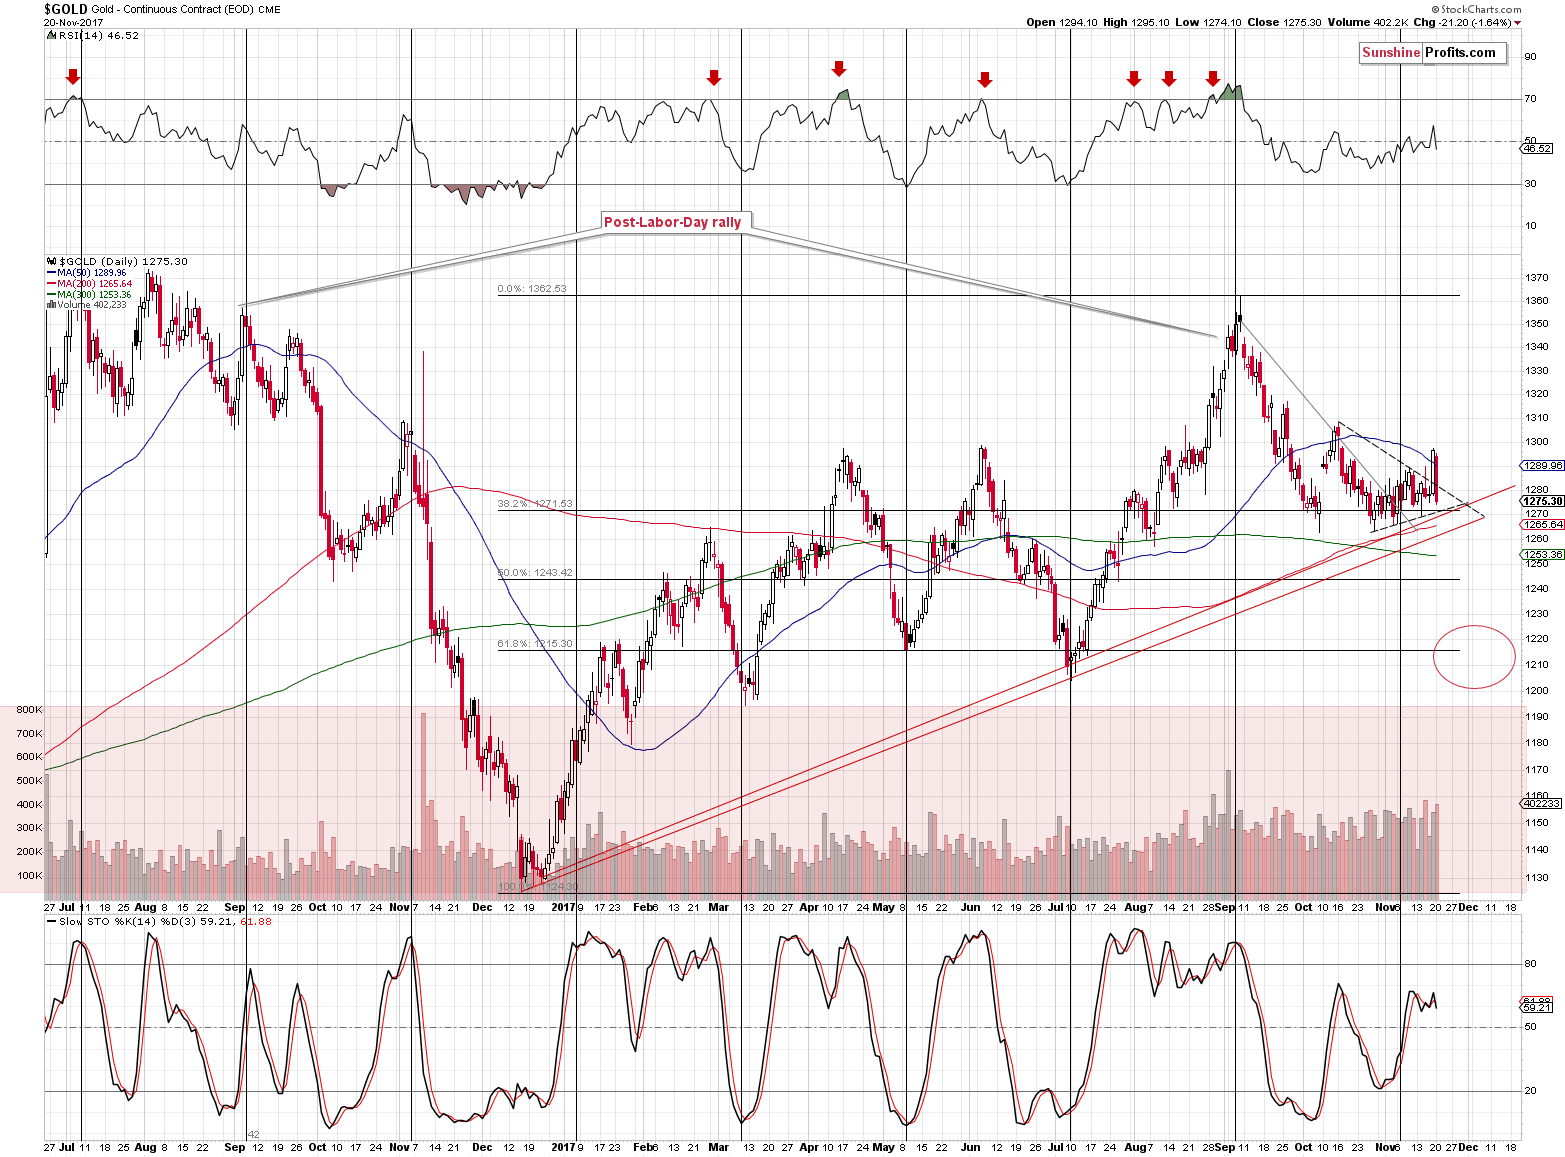
Looking at gold and taking the previous comments regarding the USD Index into account suggests that the yellow metal could move to its October high before moving south again. Alternatively, it could slide and invalidate Friday’s breakout just as it invalidated its upswing in November 2016.
Speaking of Friday’s breakout – it was quite visible and sharp, but it was just one daily close above the upper border of the triangle, so it’s not certain (or even likely) that it can be trusted.
The one-day breakout certainly didn’t prove trustworthy as it was invalidated rather quickly. As we’ve often emphasized, invalidations of breakouts are effective immediately and are quite strong signals that the move in the other direction is about to follow.
If you’ve been wondering why this is the case, here’s an explanation. If the market moves over a given resistance then this move could be accidental or it could be a true show of strength. What we want to see is signs that would confirm that there has been a “battle” for a given breakout and that the bulls have won this battle. A fierce battle means that a lot of capital was used and we would see high volume levels as a confirmation (that’s why a huge volume reading can confirm a breakout or breakdown on its own). But, what if the market was somehow forced to move higher (for instance gold could rally given a big plunge in the USD as the latter would make it cheaper in terms of other currencies and if the demand didn’t change overall, lower prices would attract more buyers), but it really doesn’t want to rally? That’s why we use the 3-day confirmation rule. If the move was artificial in some way, the market participants are likely to push the price in the original direction. Naturally, if the markets that usually confirm each other’s moves all break out or break down at the same time it further increases the odds that the move is true.
However, in the case of invalidations things are different. Invalidations are not just breakouts / breakdowns in the opposite direction. The preceding action is important. Before a breakout/breakdown, the investors and traders know that it would take an effort and a “battle” for the market to move above/below a certain level – the market is therefore before the “battle”. In case of the invalidation, the market is already after (!) the “battle” where the “bullets have already been shot” (trades have been made and capital has been used) and the invalidation shows that the supposedly winning side wasn’t able to hold the new ground even though the price was already above/below the key price level. This immediately (!) means that the entire “battle” was not real or it wasn’t really won as if it were, the winning side would be able to hold its ground. So, any bullish implications that the breakout might have had are invalidated.
But why is this bearish on its own? Because it shows that even though the supposedly winning side had everything in their favor (the price moved above the certain level) it turned out to be weak and the capital that was used to push the market higher can’t be used push it up again as it’s already in the market.
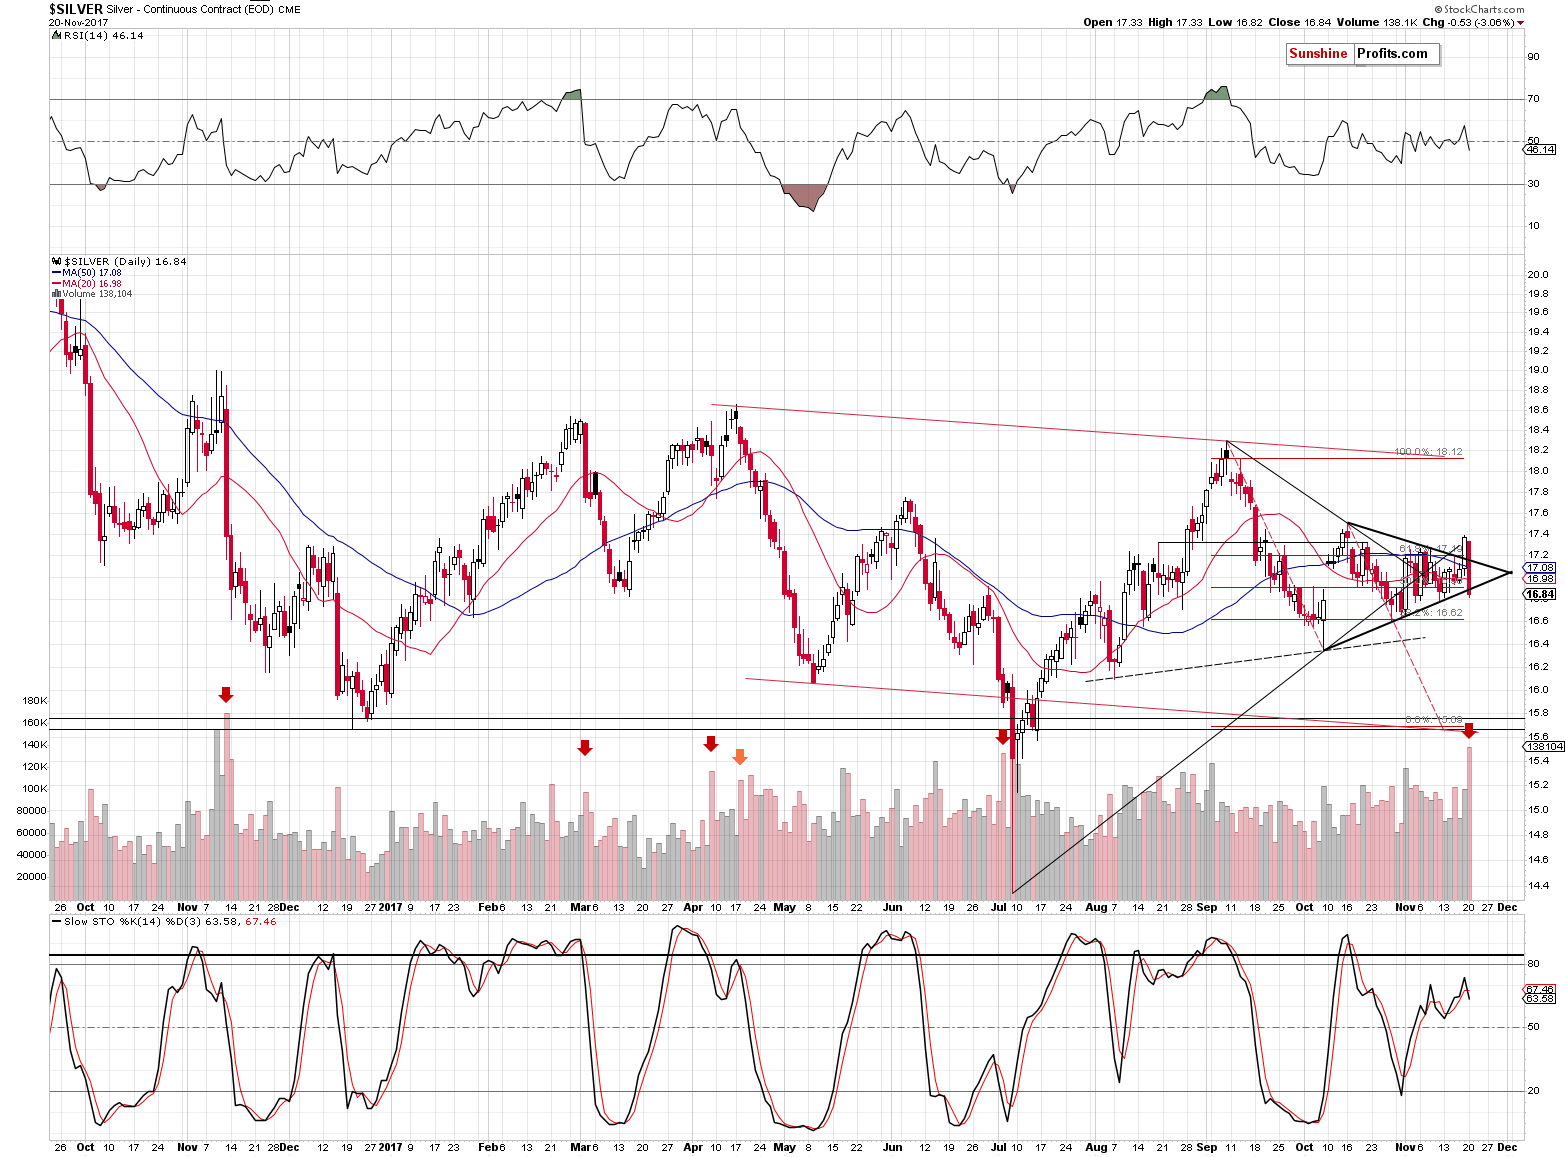
Silver took the invalidation and its bearish implications one step further. Not only did silver invalidate Friday’s breakout, but the strength of the slide was so big that it moved to the lower border of the triangle.
Moreover, the volume that confirmed the slide was huge. There is only one directly comparable session in the most recent past (marked with an orange arrow) when an important invalidation took place on huge volume. This session started a sizable decline and if we saw a similar one today, silver would bottom a bit below $15.
Other huge-volume declines that we marked with red arrows also point to lower prices as they were generally followed by declines - often sizable.
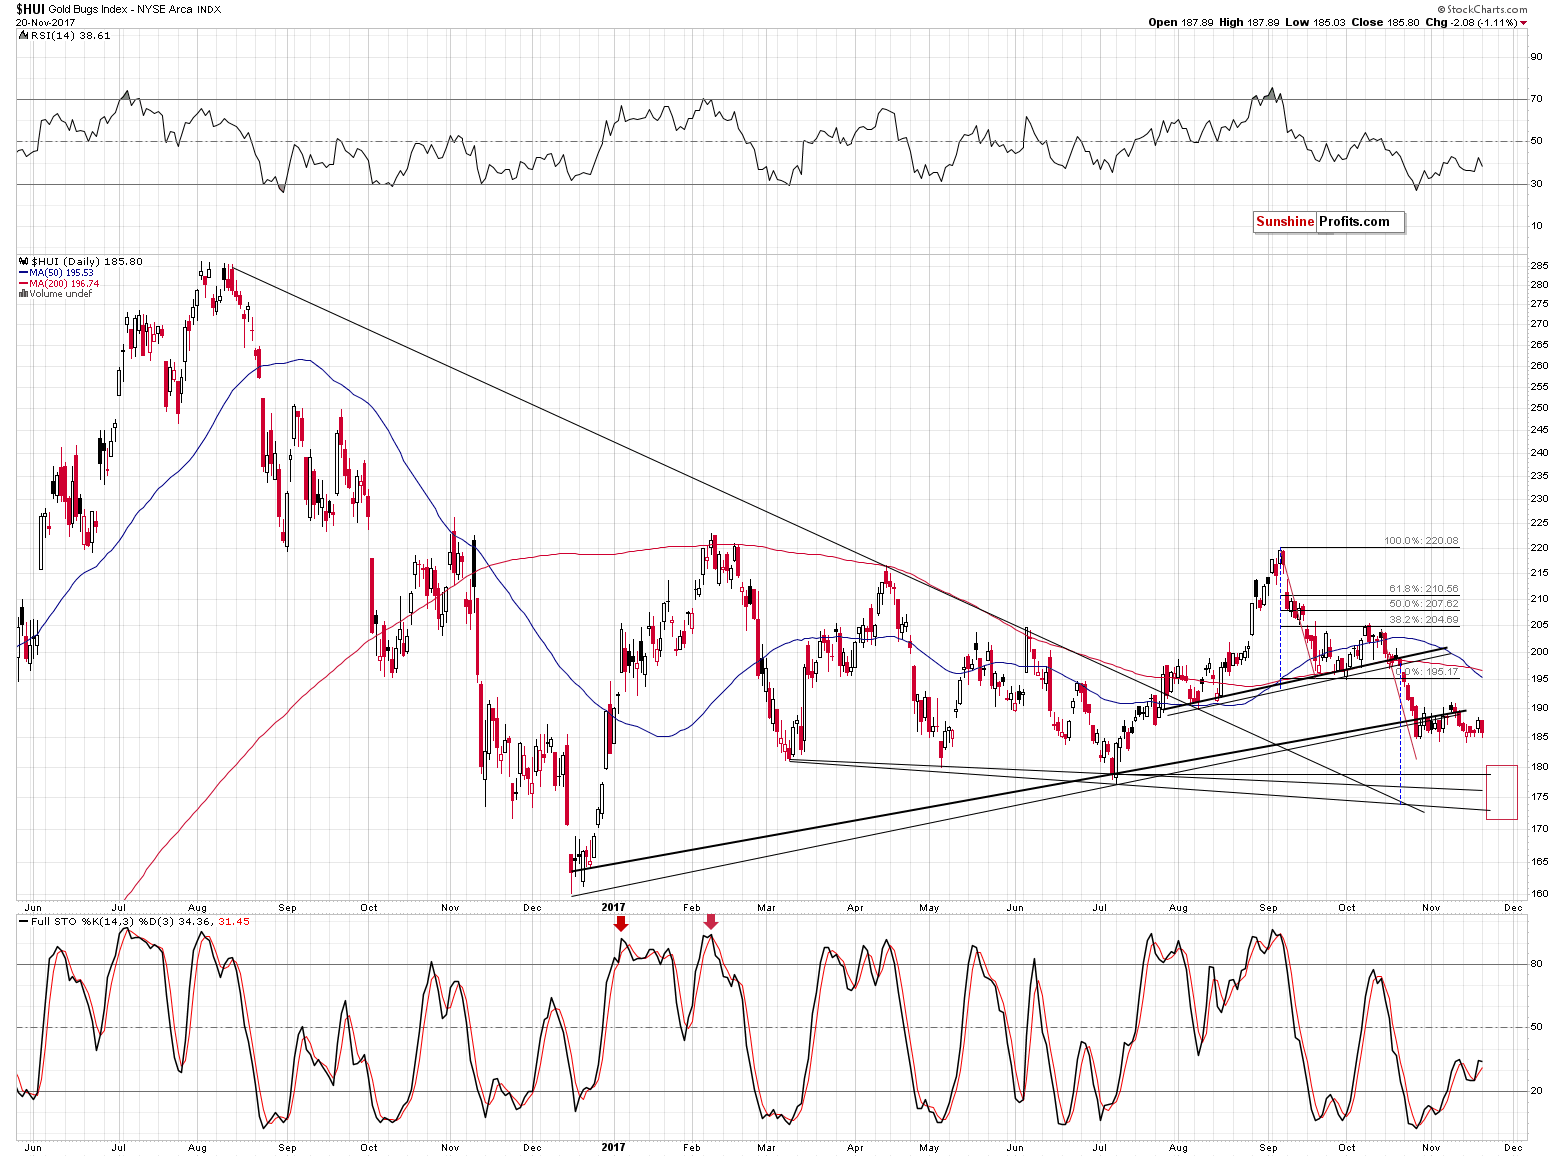
Gold stocks moved lower and they also erased their Friday upswing. Our previous comments on the above chart remain up-to-date:
While silver is close to its October high, gold stocks are not even above their November high. Miners continue to underperform in a clear way and this suggests that one should be prepared for another big wave down, not up.
In yesterday’s rally we commented on the likely trigger for gold’s rally:
Gold’s big daily rally is likely linked to the sizable daily rally in the Japanese yen. What does it tell us? That the days of the rally could be numbered (and the remaining day count could be very close to 0) as the yen moved back to the previously broken rising support / resistance line based on the 2017 bottoms. A verification of a breakdown is rather normal, and it didn’t significantly change the outlook. This is especially the case if we note that the previous big downswings in the yen were characterized by sharp very short-term rallies in their early parts. We marked those situations with red rectangles.
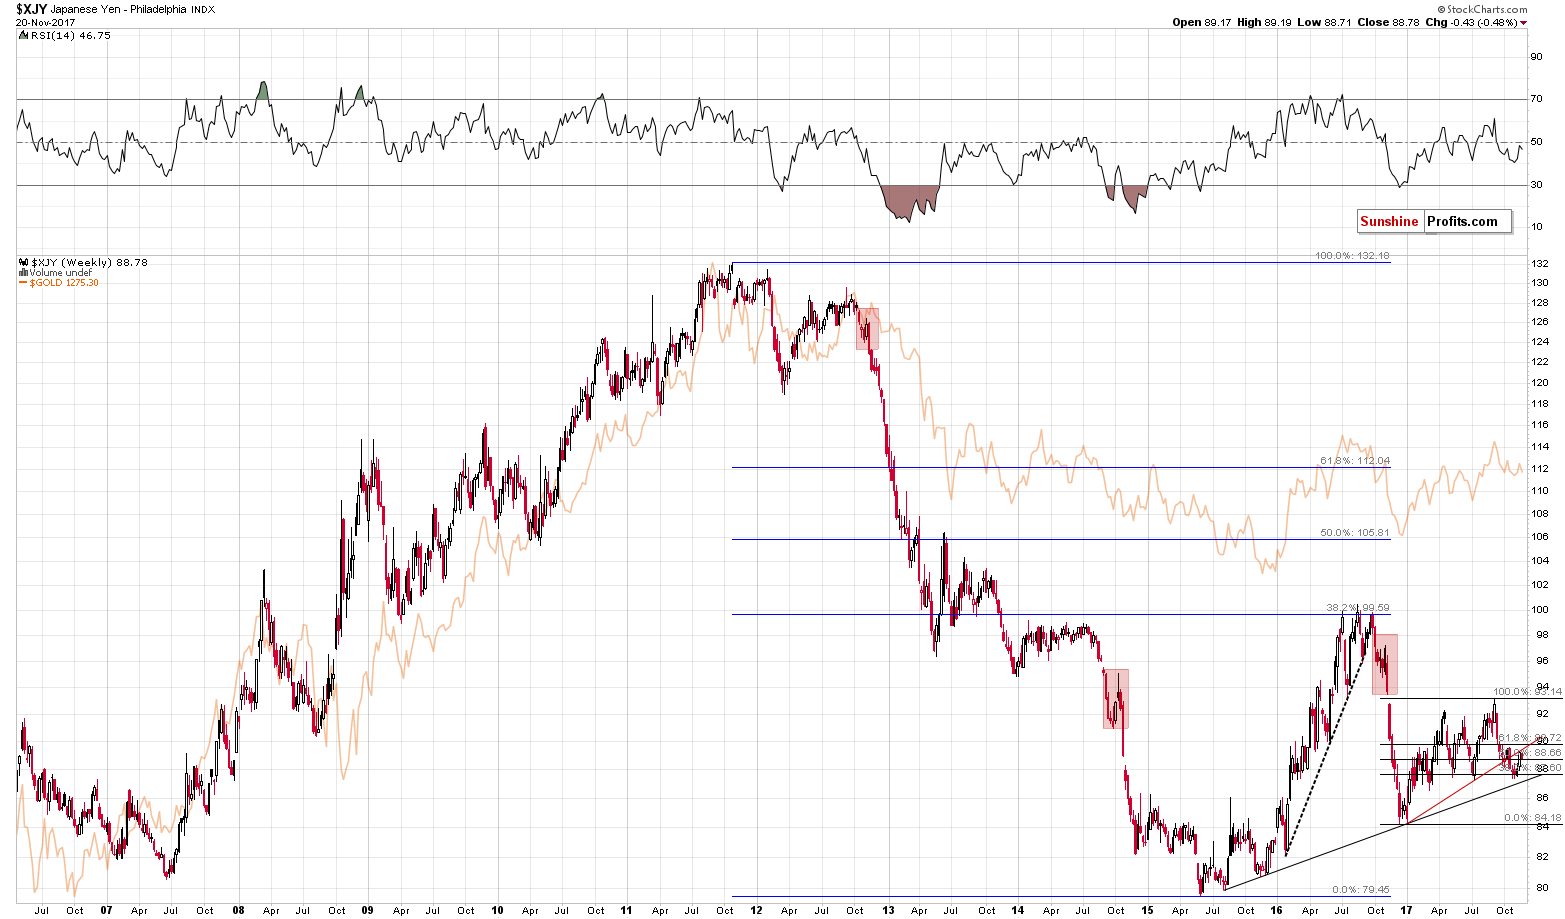
The thing that we would like to add today is that the Japanese yen erased about half of its Friday’s rally yesterday, while precious metals erased it (approximately) entirely. The above is yet another sign of weakness in the precious metals market.
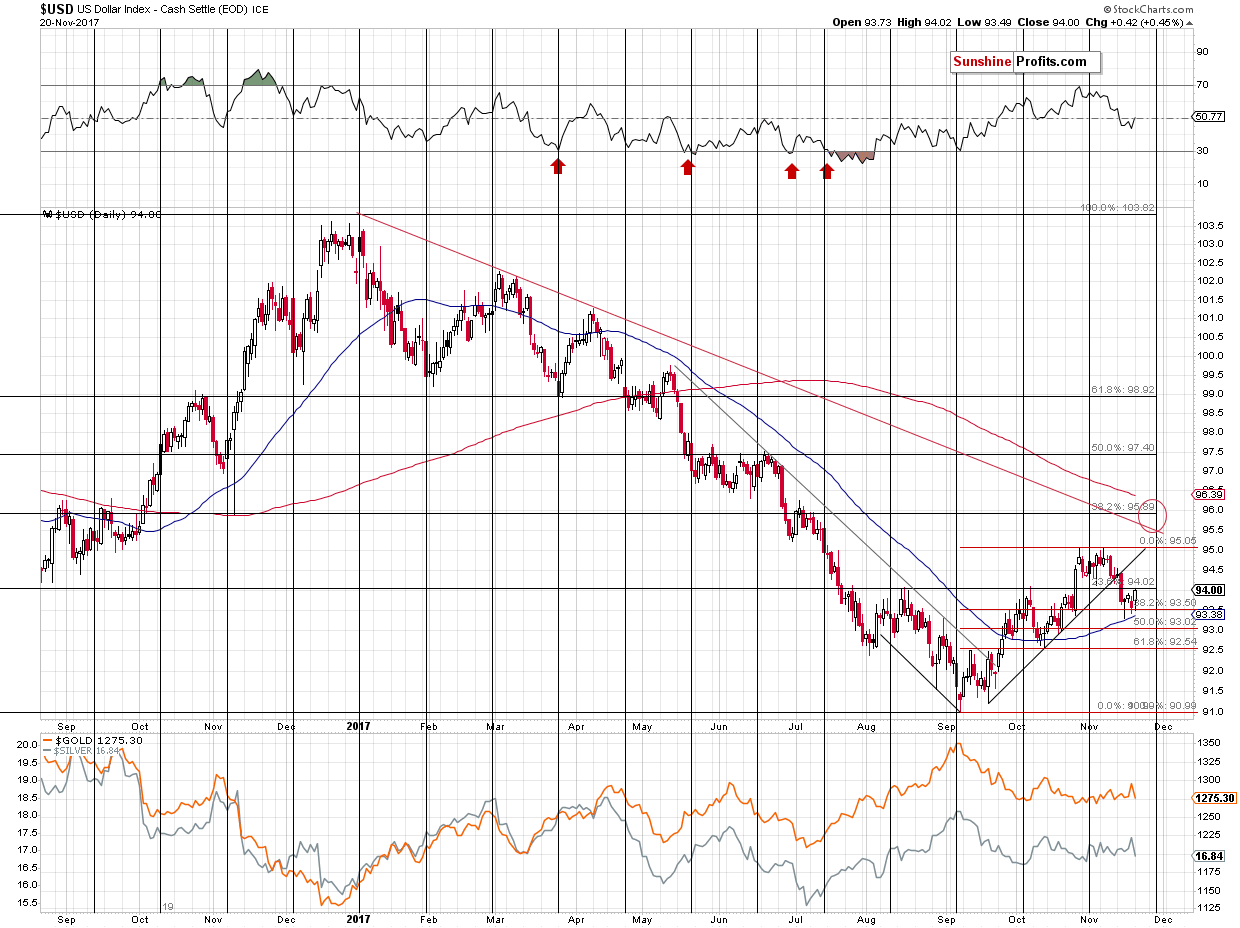
The above USD Index chart shows another interesting comparison. Please note where gold, silver and the USD were at the beginning of the month and where they are right now. Metals are a bit (!) higher, but more or less at the same levels. Conversely, the USD Index is visibly lower. The PMs are simply reacting to the USD’s rallies more than they react to the USD’s declines – that’s another sign suggesting the true direction in which the precious metals market “wants” to move is down.
Summing up, based on yesterday’s invalidations and overall weakness in PMs, it seems that the short-term decline could already be underway. We might see a more visible upswing in the metals and miners once the USD Index moves close to the 96 level, but in light of the most recent changes, it seems that it is be best to wait and see what kind of signals we get when the USD Index is higher (say at 95.5 or so) and then to decide whether the corrections are likely to be tradable.
Naturally, the medium-term outlook remains bearish, especially that the analogy to the 2012-2013 decline remains in place and the previously discussed long-term signals remain in place: gold’s huge monthly volume, the analogy in the HUI Index, the analogy between the two most recent series of interest rate hikes, and the RSI signal from gold priced in the Japanese yen.
As always, we will keep you – our subscribers – informed.
To summarize:
Trading capital (supplementary part of the portfolio; our opinion): Short positions (150% of the full position) in gold, silver and mining stocks are justified from the risk/reward perspective with the following stop-loss orders and exit price levels / profit-take orders:
- Gold: exit price: $1,218; stop-loss: $1,366; exit price for the DGLD ETN: $51.98; stop-loss for the DGLD ETN $38.74
- Silver: exit price: $15.82; stop-loss: $19.22; exit price for the DSLV ETN: $28.88; stop-loss for the DSLV ETN $17.93
- Mining stocks (price levels for the GDX ETF): exit price: $21.23; stop-loss: $26.34; exit price for the DUST ETF: $29.97; stop-loss for the DUST ETF $21.37
In case one wants to bet on junior mining stocks' prices (we do not suggest doing so – we think senior mining stocks are more predictable in the case of short-term trades – if one wants to do it anyway, we provide the details), here are the stop-loss details and exit prices:
- GDXJ ETF: exit price: $30.28; stop-loss: $45.31
- JDST ETF: exit price: $66.27; stop-loss: $43.12
Long-term capital (core part of the portfolio; our opinion): No positions (in other words: cash)
Insurance capital (core part of the portfolio; our opinion): Full position
Important Details for New Subscribers
Whether you already subscribed or not, we encourage you to find out how to make the most of our alerts and read our replies to the most common alert-and-gold-trading-related-questions.
Please note that the in the trading section we describe the situation for the day that the alert is posted. In other words, it we are writing about a speculative position, it means that it is up-to-date on the day it was posted. We are also featuring the initial target prices, so that you can decide whether keeping a position on a given day is something that is in tune with your approach (some moves are too small for medium-term traders and some might appear too big for day-traders).
Plus, you might want to read why our stop-loss orders are usually relatively far from the current price.
Please note that a full position doesn’t mean using all of the capital for a given trade. You will find details on our thoughts on gold portfolio structuring in the Key Insights section on our website.
As a reminder – “initial target price” means exactly that – an “initial” one, it’s not a price level at which we suggest closing positions. If this becomes the case (like it did in the previous trade) we will refer to these levels as levels of exit orders (exactly as we’ve done previously). Stop-loss levels, however, are naturally not “initial”, but something that, in our opinion, might be entered as an order.
Since it is impossible to synchronize target prices and stop-loss levels for all the ETFs and ETNs with the main markets that we provide these levels for (gold, silver and mining stocks – the GDX ETF), the stop-loss levels and target prices for other ETNs and ETF (among other: UGLD, DGLD, USLV, DSLV, NUGT, DUST, JNUG, JDST) are provided as supplementary, and not as “final”. This means that if a stop-loss or a target level is reached for any of the “additional instruments” (DGLD for instance), but not for the “main instrument” (gold in this case), we will view positions in both gold and DGLD as still open and the stop-loss for DGLD would have to be moved lower. On the other hand, if gold moves to a stop-loss level but DGLD doesn’t, then we will view both positions (in gold and DGLD) as closed. In other words, since it’s not possible to be 100% certain that each related instrument moves to a given level when the underlying instrument does, we can’t provide levels that would be binding. The levels that we do provide are our best estimate of the levels that will correspond to the levels in the underlying assets, but it will be the underlying assets that one will need to focus on regarding the signs pointing to closing a given position or keeping it open. We might adjust the levels in the “additional instruments” without adjusting the levels in the “main instruments”, which will simply mean that we have improved our estimation of these levels, not that we changed our outlook on the markets. We are already working on a tool that would update these levels on a daily basis for the most popular ETFs, ETNs and individual mining stocks.
Our preferred ways to invest in and to trade gold along with the reasoning can be found in the how to buy gold section. Additionally, our preferred ETFs and ETNs can be found in our Gold & Silver ETF Ranking.
As a reminder, Gold & Silver Trading Alerts are posted before or on each trading day (we usually post them before the opening bell, but we don't promise doing that each day). If there's anything urgent, we will send you an additional small alert before posting the main one.
=====
Latest Free Trading Alerts:
On Sunday night, Angela Merkel failed to build a coalition government. What does it mean for the gold market?
German Failed Coalition and Gold
=====
Hand-picked precious-metals-related links:
PRECIOUS-Gold advances, U.S Fed minutes in focus
=====
In other news:
World stocks pare gains as German political impasse hits Europe
Stocks Rebound With Dollar and Gold Feels the Pain: Markets Wrap
The market is nearing a crucial turning point that could crush stocks
Yellen, denied second term as Fed chair, announces resignation
ECB Is Said Likely to Take Small Steps in QE Exit Guidance
BOE Defends Guidance on Way Ahead for U.K. Interest Rates
Bitcoin Falls on $31 Million Hack of Cryptocurrency Peer Tether
Balance of Power: Putin Reaches for Prize with Syrian Victory
=====
Thank you.
Sincerely,
Przemyslaw Radomski, CFA
Founder, Editor-in-chief, Gold & Silver Fund Manager
Gold & Silver Trading Alerts
Forex Trading Alerts
Oil Investment Updates
Oil Trading Alerts

