

Briefly: in our opinion, full (300% of the regular position size) speculative short positions in mining stocks are justified from the risk/reward point of view at the moment of publishing this Alert.
Simply put, gold is waiting for the USDX to take the lead and make a decisive move. Contrary to most popular opinion about the USDX declining, the dollar still remains poised for a climb.
Furthermore, rising Treasury yields and real interest rates will place additional pressure on the precious metals, inflation notwithstanding. Any jumps in the PMs at this point are temporary at best.
Mining stocks declined yesterday (Mar. 18) while the USD Index moved higher. So far today, the situation seems to be reversing, but only to a small extent. It seems like the current price movement is the final part of the USD Index’s pullback and movements on the other charts are more or less clear responses to it.
Let’s take a look at the USDX.
Let’s start by quoting what I wrote about the above chart on March 11 and yesterday:
Exactly one week ago (March 11), I wrote the following:
[I wrote that when the USD Index was at about 91.9 and gold was at about $1,733 as a response to a question whether a small move lower in the USDX could indeed trigger a ~40 rally in gold.]
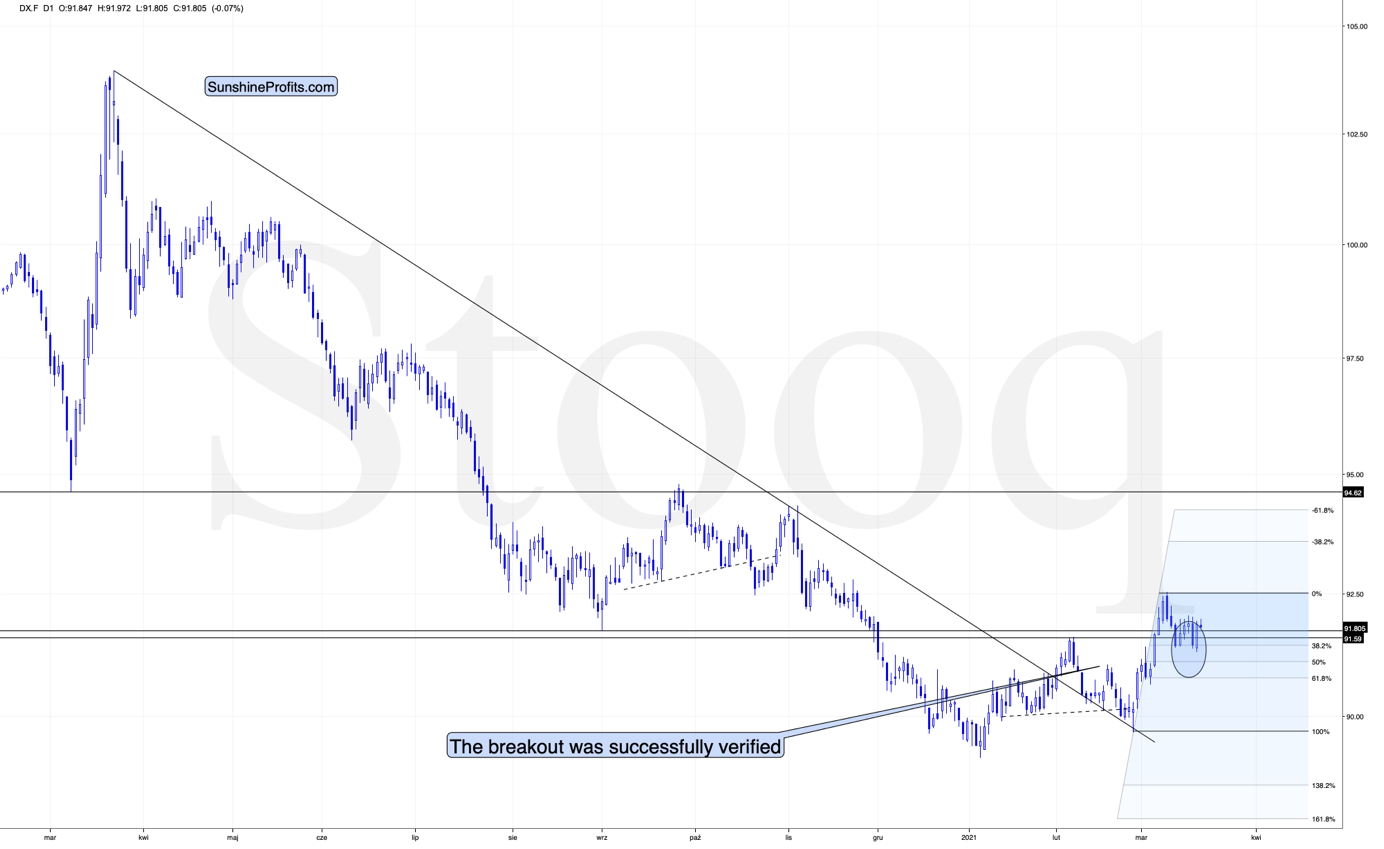
So, can the bottom in the USD Index form at about 91.6 while gold rallies to ~$1,770. Of course.
One of the ways in which this could be done is for the USD Index to rally a bit here while gold ignores that and rallies anyway – which is what we already see taking place right now – and then when the USD Index declines to 91.6 or so, gold would rally even more. Gold is only $40 away from the above-mentioned upside target, so it won’t take much to get it there. For instance, we might see another $10 rally while the USD Index pauses, and then a $30 rally when the USDX finally declines, and bottoms.
Moreover, please note that the USD Index could move below 91.6 on an intraday basis and then rally back to it in terms of the daily closing prices. The previous 2021 high in terms of the closing prices was 91.52. So, actually, the USDX could decline to one of the Fibonacci retracements on an intraday basis before getting back up. The classic retracements based on the recent move higher are:
- 38.2% - 91.44
- 50% - 91.10
- 61.8% - 90.77
Also, based on the entire 2021 rally, the retracements would be:
- 38.2% - 91.25
- 50% - 90.85
- 61.8% - 90.45
Consequently, the USD Index could decline to one of those levels (more likely to 91.10 – 91.44 than to 90.45 – 90.85) and then rally back up on an intraday basis, and the analogy to how the situation developed in 2018 would still remain intact.
Combining both above details (gold’s temporary outperformance and the possibility for the USD Index to decline below 91.6 on a very temporary basis) suggests that the rally to $1,770 in gold, and the brief decline in the USD Index can indeed take place together.
In yesterday’s analysis, I wrote the following:
In the following days, I added that the easy part of the rally was over, and based on some technical factors, it was no longer so likely that gold would indeed reach $1,770.
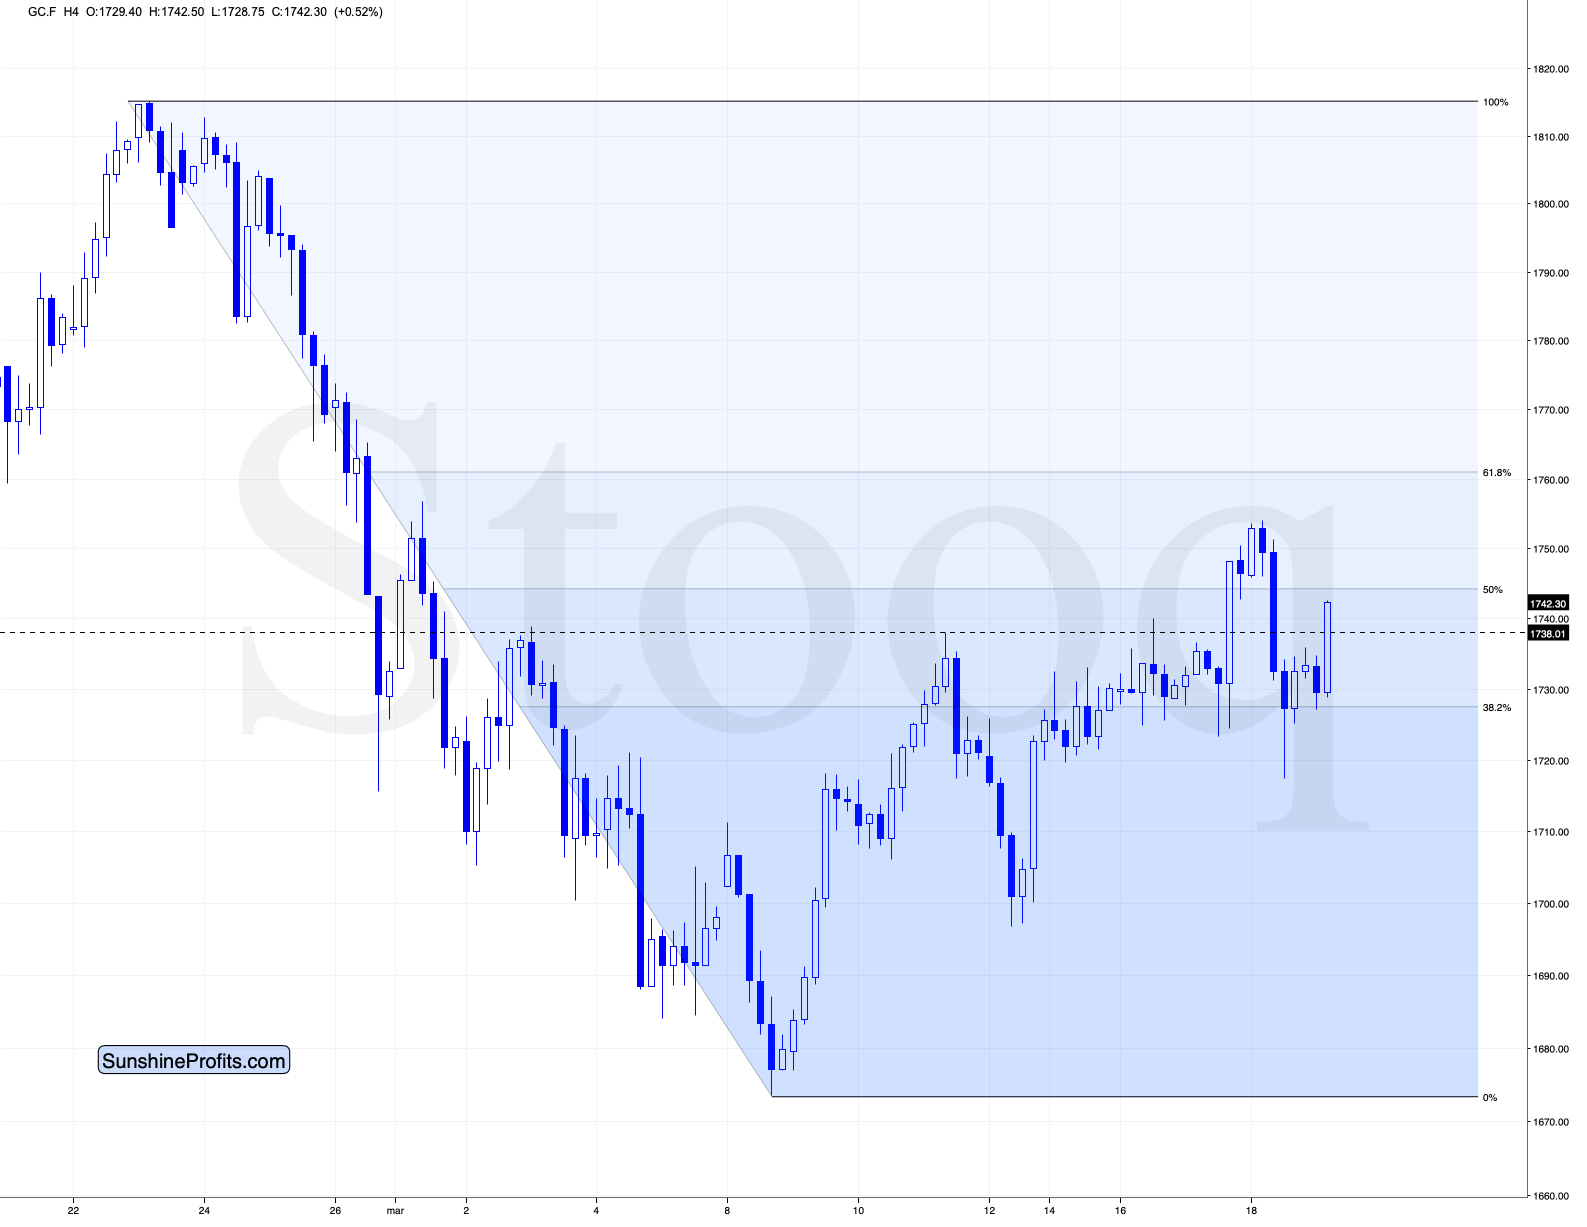
What actually transpired in the following days was that the USD Index indeed moved higher and then once again lower while gold exceeded the previous highs. It didn’t move to $1,770, though, but to $1,754 (at least so far). The USD Index bottomed (assuming that today’s overnight low was the final bottom for this decline) at ~91.3, which is more or less in the middle of the downside target area that I put in bold in the above quote.
After moving to ~91.3, the USD Index rallied back above its March 11 low, thus invalidating the breakdown below it.
Technically, it seems that we just saw a zigzag corrective pattern in the USD Index, which is one of the most common shapes that a correction could take. Consequently, it seems that the rally might continue now.
Based on yesterday’s rally, the USD Index once again invalidated the small breakdown below the February high. Today, it’s simply taking a breather. The zigzag-shaped pullback, the fact that – overall – the February highs provided strong support suggests, and the fact that the USD Index is already after a major, medium-term (confirmed) breakout means that one should expect another big upswing any day or hour now. I’ll discuss some other factors in the more fundamental part of today’s analysis.
As the USD Index is preparing to rally, it seems that gold and the rest of the precious metals sector is preparing to decline.
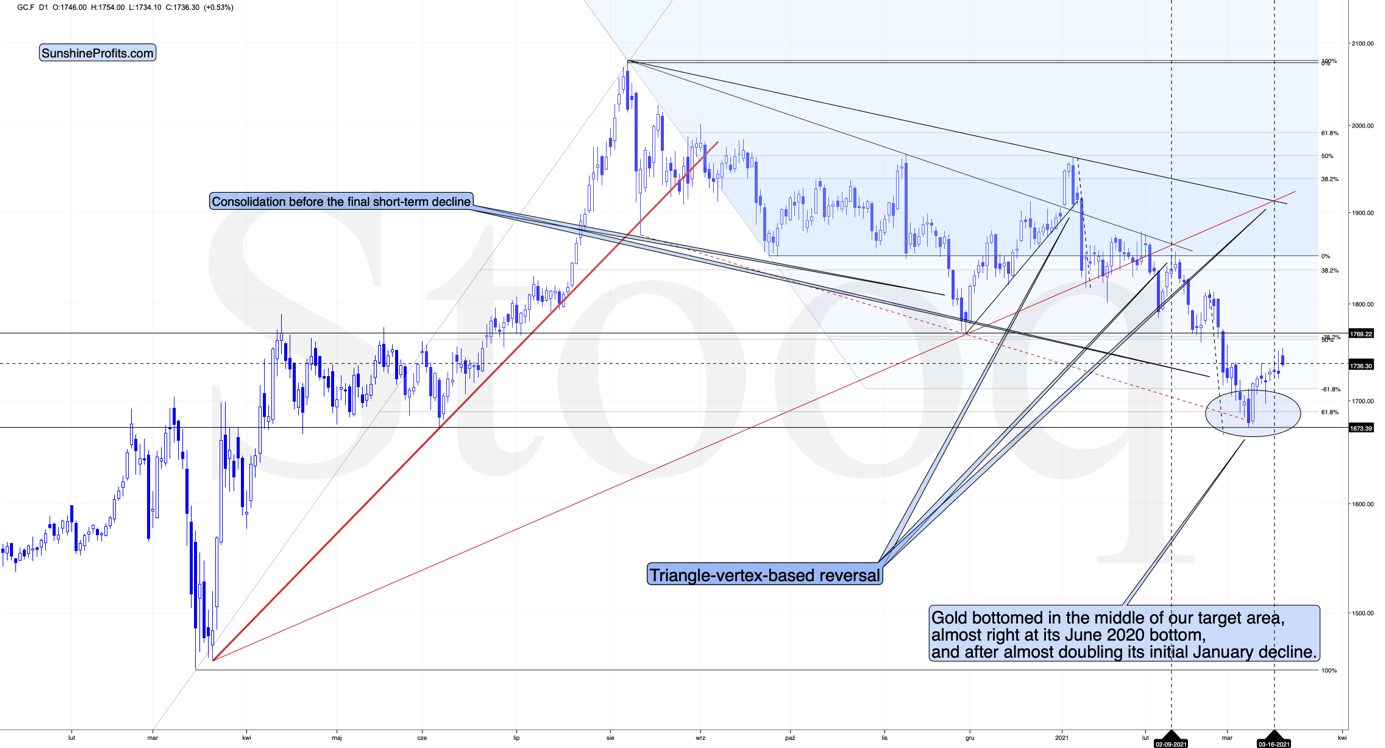
Gold has been moving back and forth in the last few days, but it seems that once the USD Index moves more decisively, so will gold. The yellow metal responded in a visible way yesterday, and during the overnight action it moved back up. It seems that traders assumed that the USD Index will now decline once again. I think that the latter is unlikely, and that gold will follow the USD’s lead – as the USDX rallies, gold would be likely to decline.
There’s still the possibility that gold could rally to ~$1,770 in the following days, but a decline without such a rally seems more likely given what’s happening in the U.S. currency.
As far as mining stocks are concerned, here’s what I wrote about them yesterday:
Mining stocks followed gold higher and they moved to the upper part of my previous target area, but not yet to its upper border. As you may recall, I mentioned the possibility of GDX moving to the $34 - $35 area and my original target for this rally was slightly below $34.
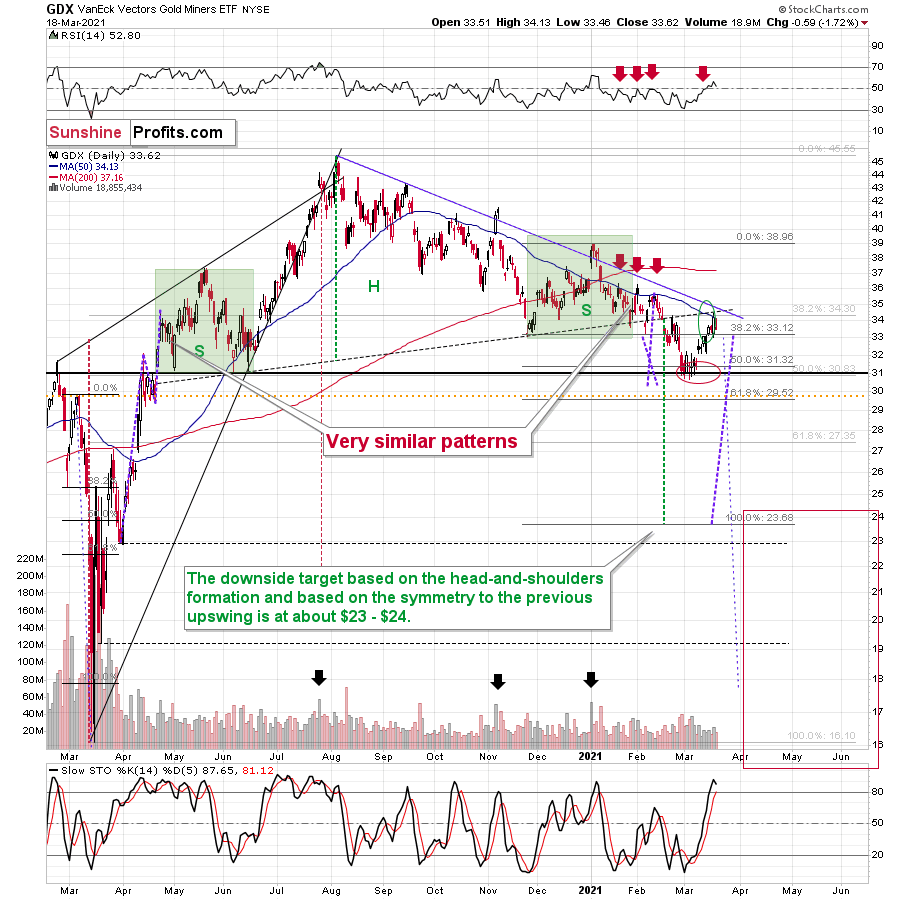
The GDX ETF now encountered the strongest combination of resistance areas, while the Stochastic indicator moved above the 80-level. Technically, the situation is now much more bearish in the GDX ETF chart than it was at the beginning of the year. Back in January, the GDX ETF was only at the declining blue resistance line.
Now, in addition to being very close to the above-mentioned line it’s also at:
- The neck level of the previously broken broad head and shoulders pattern
- The 50-day moving average
- The previous (late-February) highs.
Consequently, it’s highly likely that we’ve either just seen a top or one is close at hand.
Based on yesterday’s decline it seems that we might have indeed seen a top in the mining stocks. The overnight move higher in gold might trigger a quick upswing in gold miners as well, but it seems that any rallies here will be short-lived based on the strength of the resistance that miners encountered this week.
Having said that, let’s take a look at the market from a more fundamental angle.
Day and Night
Referencing the price action on Mar. 17, I wrote that in the short term (and especially very short term), investors create their own reality.
When U.S. economic outperformance of Europe is increasing, why is the EUR/USD rallying? And if FOMC members are increasing their rate-hike expectations, why are the U.S. 5-Year and 7-Year Treasury yields falling?
Well, what a difference 12 hours makes.
As Jerome Powell’s, Chairman of the U.S. Federal Reserve (FED), ultra-dovish comments were given deeper consideration, at roughly 3 a.m. ET on Mar. 18, bond investors decided that enough was enough.
Please see below:
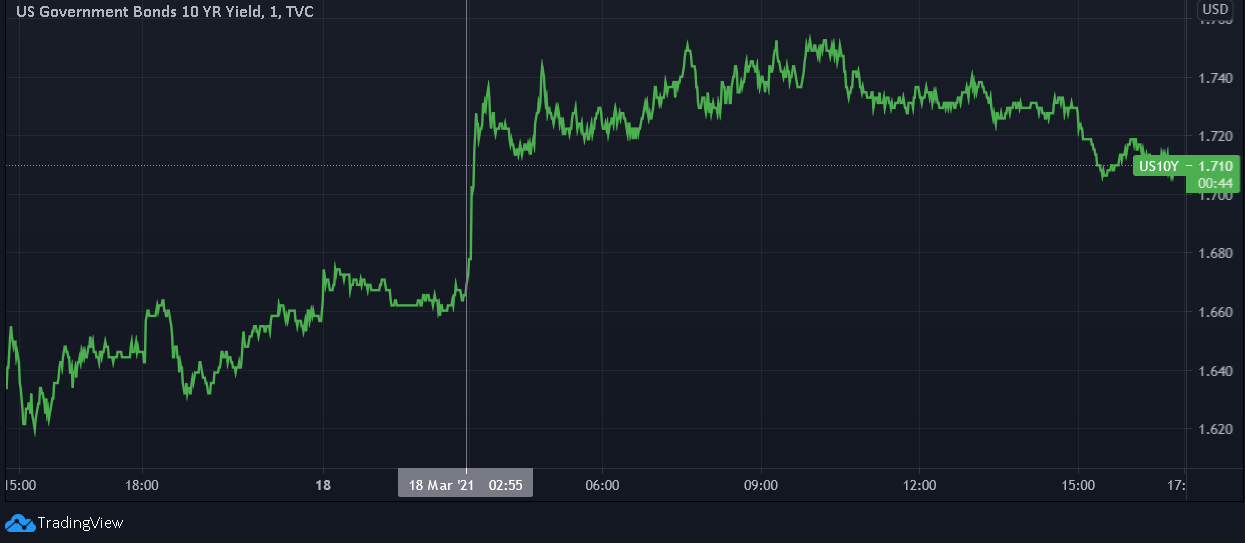
If you analyze the chart above, you can see that the U.S. 10-Year Treasury yield moved sharply higher during the morning hours.
Responding in kind, gold matched the move by heading sharply lower.
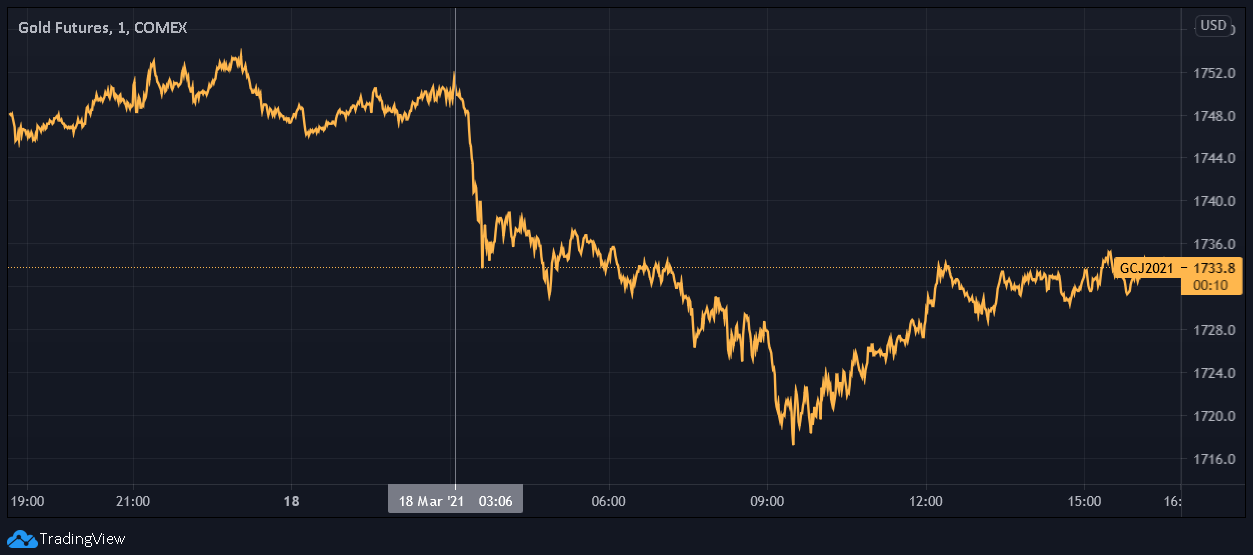
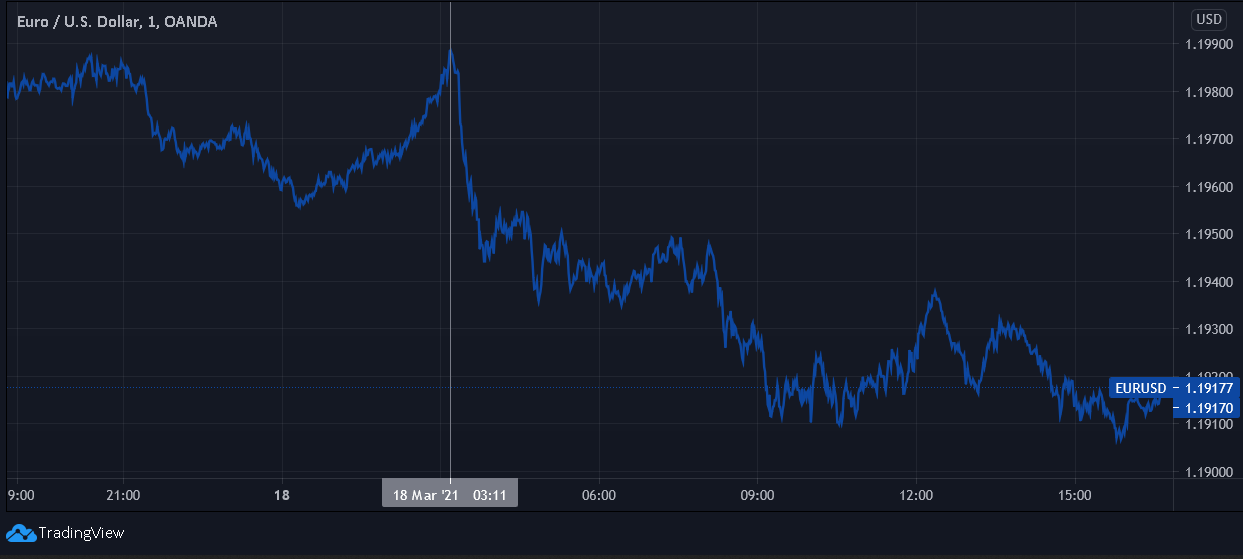
And not wanting to miss out on the mean-reversion party, the EUR/USD also gave back nearly all of its Powell-induced gains.
Furthermore, the AM action was so eventful that gold and silver completely ignored the NASDAQ 100’s 3.13% drawdown.
Please see below:
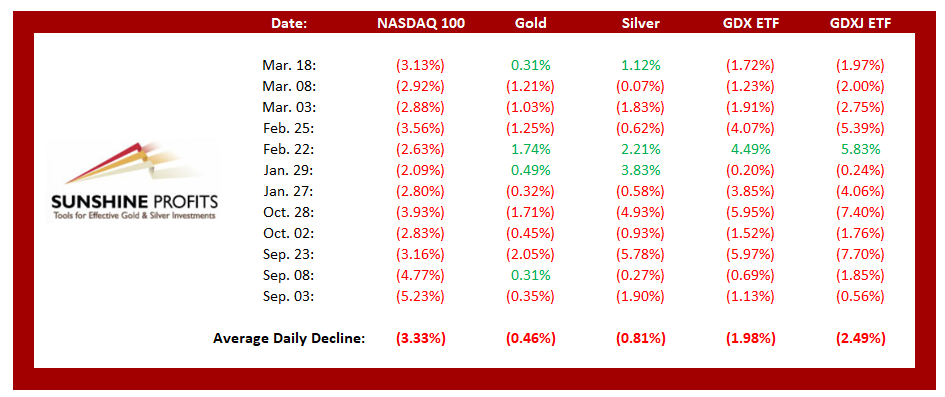
For context, if you analyze the table above, you can see that NASDAQ 100 drawdowns of more than 2.00% tend to unnerve the PMs. Moreover, if you exclude silver’s #shortsqueeze-based rally on Jan. 29 and the NASDAQ 100’s relatively ‘quiet’ 2.63% drawdown on Feb. 22, bouts of equity volatility significantly impact the PMs (especially the miners).
However, equity-factors aside, surging U.S. Treasury yields are by far the main course. And with Powell’s ignorance to the indirect effect of his policies now becoming shockingly apparent, the bond markets’ latest tantrum was likely just an appetizer.
On Jan. 15, I wrote that the FED remains stuck between a rock and a hard place:
- If they let yields rise, the cost of borrowing rises, the cost of equity rises, and the U.S. dollar is supported (all leading to shifts in the bond and stock markets and destroying the halcyon environment they worked so hard to create).
- To stop yields from rising, the U.S. Federal Reserve (FED) has to increase its asset purchases (and buy more bonds in the open market). However, the added liquidity should have the same net-effect because it increases inflation expectations, which a precursor to higher interest rates.
And, although the above may sound like a broken record, the behavior of U.S. Treasury yields is one of the most important fundamental variables impacting the PMs (along with the USD Index). On Feb. 24, I warned that Powell has lost control of the bond market. And surging by another 7.50% on Mar. 18, the U.S. 5-Year Treasury yield remains completely unhinged.
Please see below:
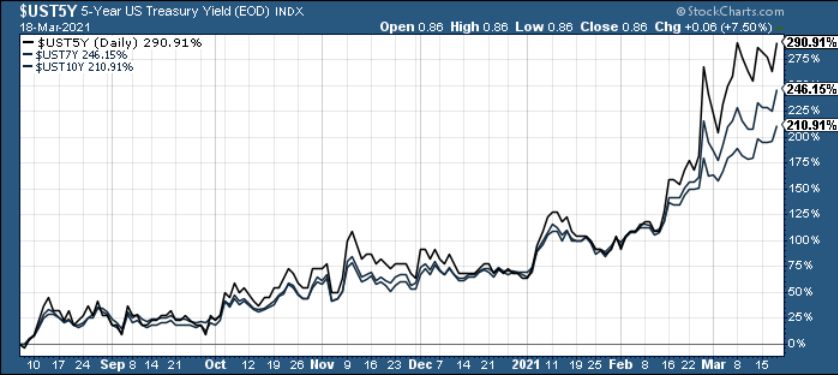
Additionally, I warned on Mar. 16 that the damage may have only just begun.
I wrote:
On April 1, 2020, the FED announced that U.S. banks could exclude U.S. Treasuries from their Supplementary Leverage Ratios (SLR) – a move designed “to ease strains in the Treasury market resulting from the coronavirus.” However, with the Mar. 31 deadline fast-approaching, the FED has to decide whether or not to extend the Treasury exemption.
Sensing that the writing is on the wall, last week, primary dealers sold more than $60 billion worth of U.S. Treasuries – offloading their positions at the fastest pace ever.
Please see below:
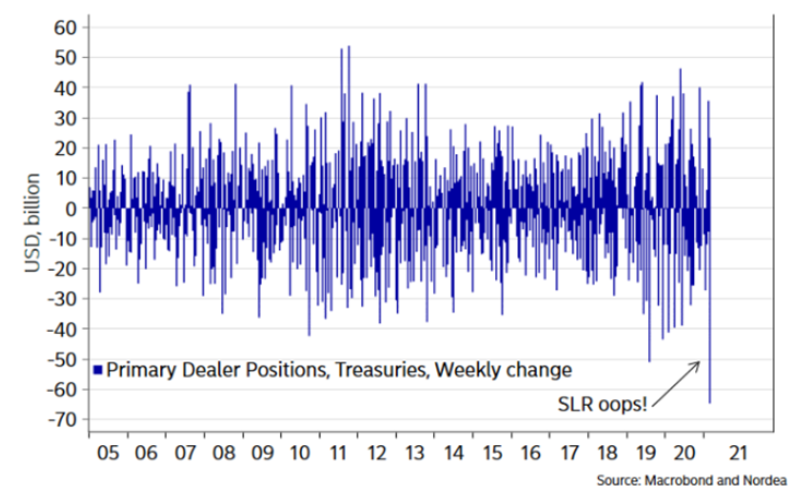
However, if the SLR exemption is not extended, $650 billion worth of U.S. Treasuries could be sold in the coming weeks.
Pressed on the issue during his Mar. 17 press conference, Powell responded: “We’ll have something to announce on that in coming days, and I’m not going to expound upon your questions. Why don’t you ask another question if you’d like to, because that one, I’m just going to say something in coming days.”
Quite the defensive response… Don’t you think?
Clearly a case of diminishing marginal returns, Powell is beginning to feel the pressure. Before, his words could control the narrative for several months. Now, as evidenced by markets’ erratic behavior over the last 48 hours, Powell’s remarks barely had a two-day shelf life.
Case in point: the SRVIX rallied again on Mar. 18 and the latest reading is only 8.8% below its March 2020 high.
Please see below:
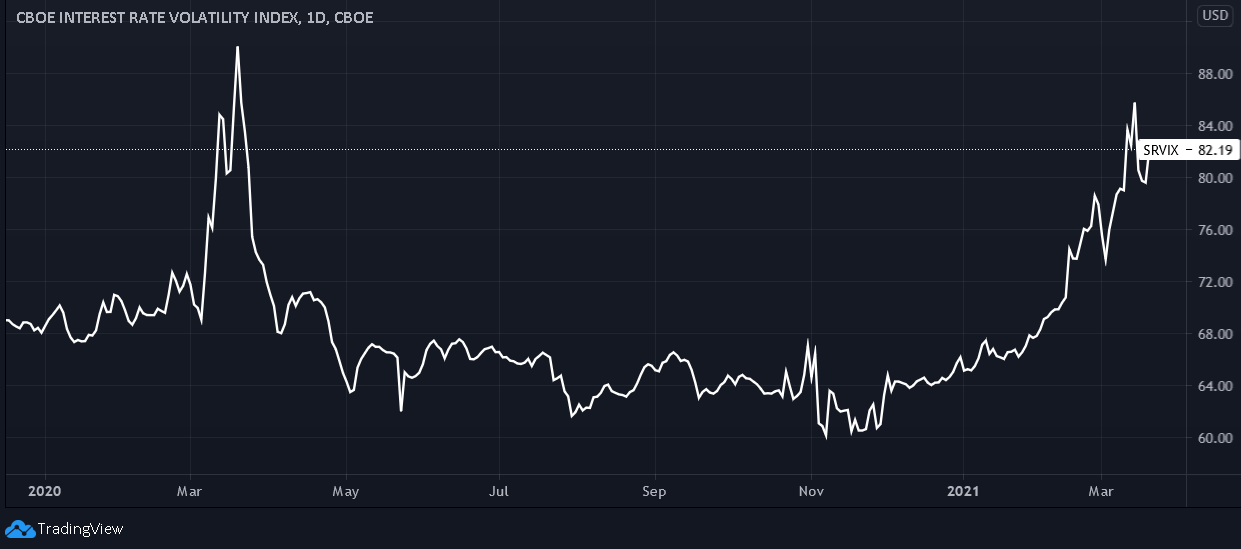
For context, the Cboe Interest Rate Swap Volatility Index (SRVIX) quantifies volatility in the expected forward swap rate (a future interest rate that investors can lock in today).
But why are U.S. interest rates so important?
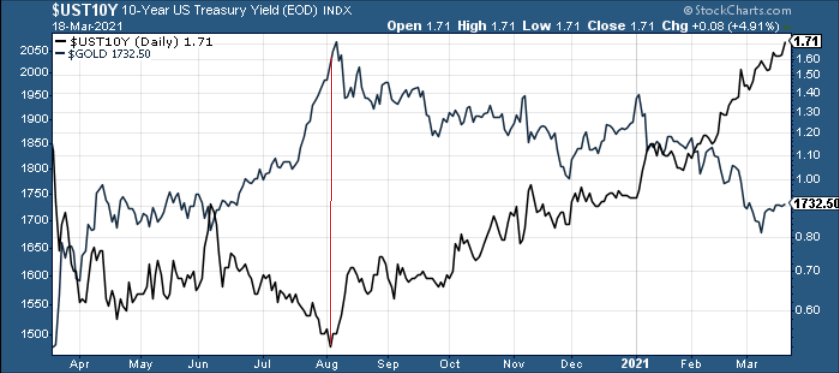
Because if you analyze the chart below, you can see that gold peaked (on Aug. 7), exactly one day after the U.S. 10-Year Treasury yield bottomed (Aug. 6). Furthermore, the two have demonstrated a material divergence ever since.
And while I can’t stress this enough, because central bankers are clueless to the indirect effect of their policies, U.S. Treasury yields are unlikely to calm down anytime soon. On Mar. 11, the European Central Bank (ECB) announced that its weekly PEPP purchases would “be conducted at a significantly higher pace.”
Please see below:
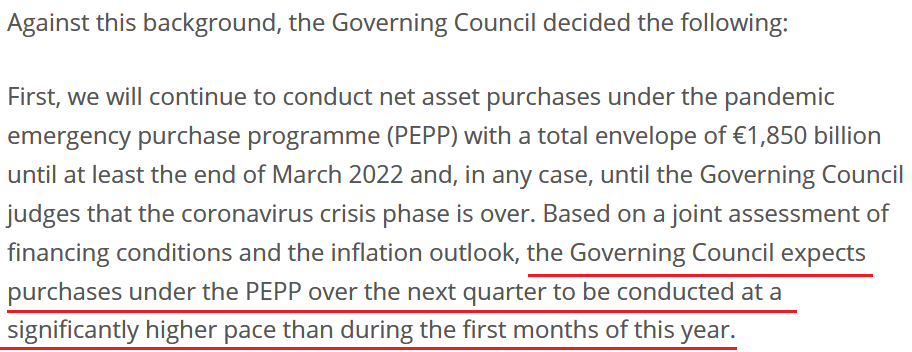 Source: ECB
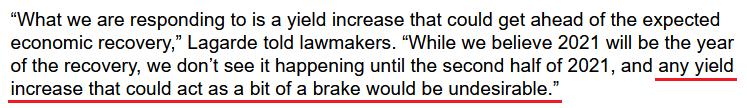
And on Mar. 18, ECB President Christine Lagarde explained the decision, saying that “what we are responding to is a yield increase that could get ahead of the expected economic recovery.” However, analyzing the ‘cause’ and not the ‘effect,’ excessive money printing is the reason why bond yields are rising.
For a humorous explanation of the central bank circus, please see the graphic below:
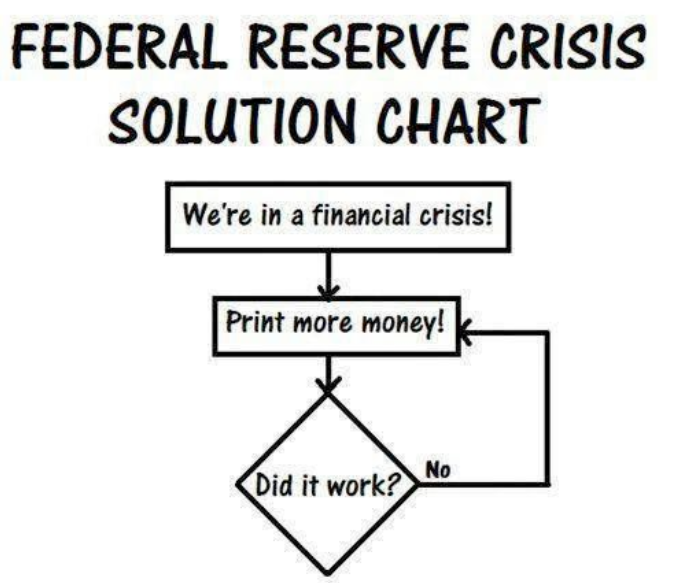 Source: Ben Rickert
To explain, central bankers increase the money supply in an attempt to stimulate their economies. However, the strategy is a mirage because funds don’t end up in the hands of those that need it most. Contrary to fiscal spending – which provides welfare and childcare benefits as well as provides job training for less-fortunate citizens – monetary policy only pushes stock and bond prices above their fundamental values. And because central bankers’ favorite solution is ultimately their only solution, after realizing that the initial liquidity had little effect, they just print more.
However, by disrupting the bond markets’ fulcrum, flooding the system with liquidity is eliciting a rational response from bond investors. Think about it: with Powell doing everything in his power to “overshoot” the FED’s 2% inflation target, why would bond investors continue to hold securities that earn a 0% nominal return and a – 4% (assuming 4% inflation is Powell’s break point) real return? Thus, central banks’ strategy of suppressing interest rates by increasing bond purchases isn’t working anymore. Moreover, despite their lack of foresight, for those that have been paying attention, the writing was on the wall several months ago.
Now you may be wondering… Doesn’t rising inflation benefit the PMs?
The short answer is yes. However, when nominal interest rates rise at a faster pace than inflation expectations, real interest rates also rise. And with real interest rates surging since the New Year, a continuation of the theme is extremely bearish for the PMs. Case in point: on Mar. 18, the U.S. 10-Year Treasury yield ended the day at 1.71%, while the U.S. 10-Year breakeven inflation rate ended the day at 2.27%. Doing a little math (1.71 – 2.27), the U.S. 10-Year real yield ended the day at – 0.56%. In stark contrast, the U.S. 10-Year real yield ended 2020 at – 1.06%.
Even more ominous for the PMs, U.S. Treasuries’ yield surge has elicited little response from the USD Index. Despite rising in tandem since the New Year, the U.S. 10-Year Treasury yield’s drastic outperformance of the USD Index remains a historical anomaly. On a more granular level, the EUR/USD – which accounts for nearly 58% of the movement in the USD Index – is also foolishly overvalued.
However, I warned on Mar. 16 that the tide is beginning to turn.
I wrote:
With non-commercial (speculative) futures traders reducing their long positions by more than 15,000 contracts and increasing their short positions by nearly 9,000 contracts, euro bulls are quietly retreating to their stables.
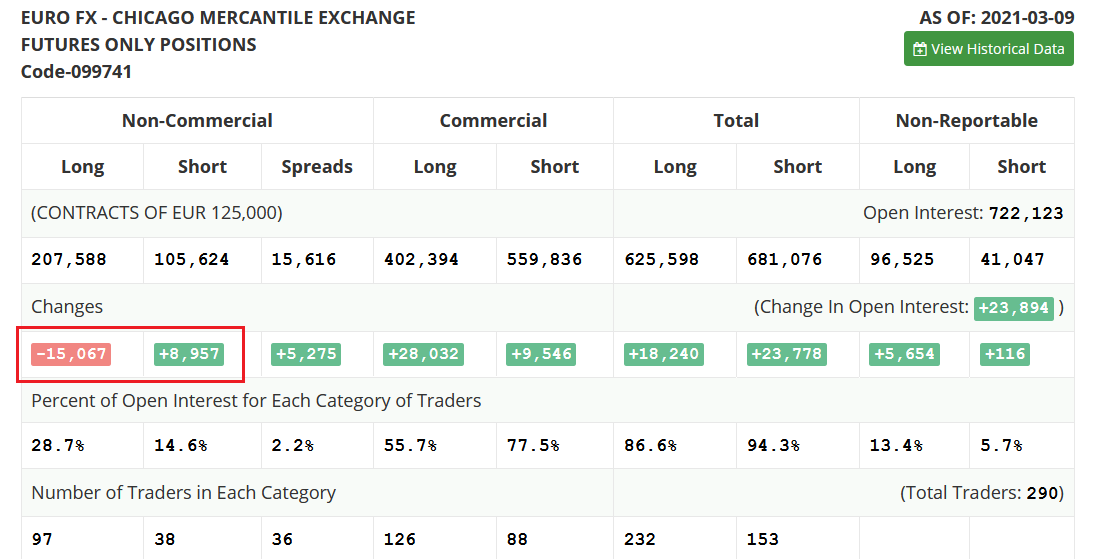 Source: COT
And though we’re still in the early innings of a material shift, Vanda Research’s latest FX Outlook signals that U.S.-Eurozone interest rate differentials could crack the EUR/USD.
Please see below:
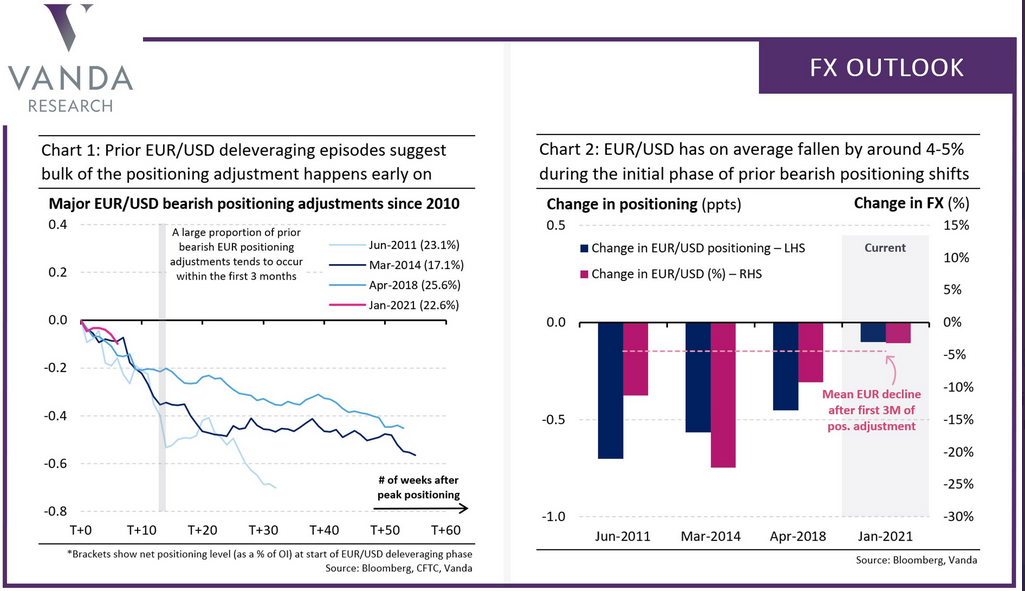
To explain, the last three times EUR/USD net-futures positioning shifted from bullish to bearish, 40%-50% of the overall shift occurred within the first three months and the EUR/USD declined by an average of 4%-5%. Thus, if history rhymes, the “first stop for EUR/$ is 1.1700/50 on an initial positioning unwind.”
In conclusion, the PMs may seem like they’re on solid footing, but over the medium-term, the outlook remains profoundly bearish. With U.S. Treasury yields boiling beneath the surface and the USD Index still regaining its confidence, a material move higher of both variables should continue to haunt the PMs. Over the medium-term, the PMs have a strong negative correlation with the USD Index, while rising Treasury yields reduce their attractiveness relative to government bonds. As a result, until the above mosaic runs its course, the PMs are unlikely to find a lasting bottom.
Overview of the Upcoming Part of the Decline
- It seems to me that we are already after the initial bottom and the initial correction. If not, then it seems likely to me that the corrective upswing will be completed within a week. It’s more likely that the next big move lower is already underway, though.
- After miners slide once again in a meaningful and volatile way, but silver doesn’t (and it just declines moderately), I plan to switch from short positions in miners to short positions in silver (this could take another 1-2 weeks to materialize). I plan to exit those short positions when gold shows substantial strength relative to the USD Index, while the latter is still rallying. This might take place with gold close to $1,450 - $1,500 and the entire decline (from above $1,700 to about $1,475) would be likely to take place within 1-12 weeks and I would expect silver to fall hardest in the final part of the move. This moment (when gold performs very strongly against the rallying USD and miners are strong relative to gold – after gold has already declined substantially) is likely to be the best entry point for long-term investments in my view. This might happen with gold close to $1,475, but it’s too early to say with certainty at this time. In other words, the entire decline could take between 1 and 12 weeks, while silver declines particularly fast in the final 1-2 weeks.
- If gold declines even below $1,500 (say, to ~$1350 or so), then it could take another 10 weeks or so for it to bottom, but this is not what I view as a very likely outcome.
- As a confirmation for the above, I will use the (upcoming or perhaps we have already seen it?) top in the general stock market as the starting point for the three-month countdown. The reason is that after the 1929 top, gold miners declined for about three months after the general stock market started to slide. We also saw some confirmations of this theory based on the analogy to 2008. All in all, the precious metals sector would be likely to bottom about three months after the general stock market tops . If the mid-February 2020 top was the final medium-term top, then it seems that we might expect the precious metals sector to bottom in mid-May or close to May’s end.
- The above is based on the information available today and it might change in the following days/weeks.
Letters to the Editor
Q: I believe it was in March 2019 that the Fed unexpectedly lowered interest rates because of fears of a recession. That cut caused gold to spike and you to reverse your bearish predictions for gold and precious metal stocks. I see by your second alert today that you don’t foresee that at the moment.
What would cause you to change your mind? I noted in your extensive Monday report that the slow stochastic graph of the HUI Index was near the bottom of it range, but you compared it to an earlier similarity in the graph when the similar pattern didn’t portend a rebound of the HUI Index, but a continuing weakness. What’s happening to the stochastics on the HUI now, and how do the GDX and GDXJ stochastic graphs compare? Thanks again. I find your thorough analyses the only trustworthy ones I read.
A: Thank you for the compliment on the quality of our analyses – your opinion is important to me.
Starting with your first question - “what would cause you to change your mind” – it’s one of the boomerang questions that I get on a regular basis, and – unfortunately – it’s also one that has no good reply. The reason is that there are myriads of potential situations that could make me change my mind. The flagship Gold & Silver Trading Alerts include a lengthy discussion of tens of factors that contribute to the current outlook.
A change in one or a few of those factors can alter the outlook from being bearish to being unclear, and a change in even more of them could make the outlook bullish. Just as it might not be possible to list all the reasons one might stop liking a given person and start to dislike them, it’s impossible to list all the reasons due to which I’d change my mind regarding the precious metals market.
The obvious reason is that the situation develops more or less in tune with my expectations and gold soars while the USD Index continues to show strength, and this happens close to $1,500. Of course, if gold soars above its 2020 highs while the USD Index does nothing, it will mean that the next massive upswing in gold is already underway. Of course, I wouldn’t wait for this breakout to happen in order to exit the current short positions – I’d close or reverse them sooner.
Another potential idea - gold stocks would show strength relative to gold for weeks, without a bullish lead from the general stock market – this might also be bullish and meaningful enough for me to change my outlook for the precious metals market.
The change might also be induced by something outside of the world of charts – e.g., external factors such as the hypothetical breakout of a regional or global conflict, or something similarly epic.
Having said that, let’s take a look at the HUI Index.
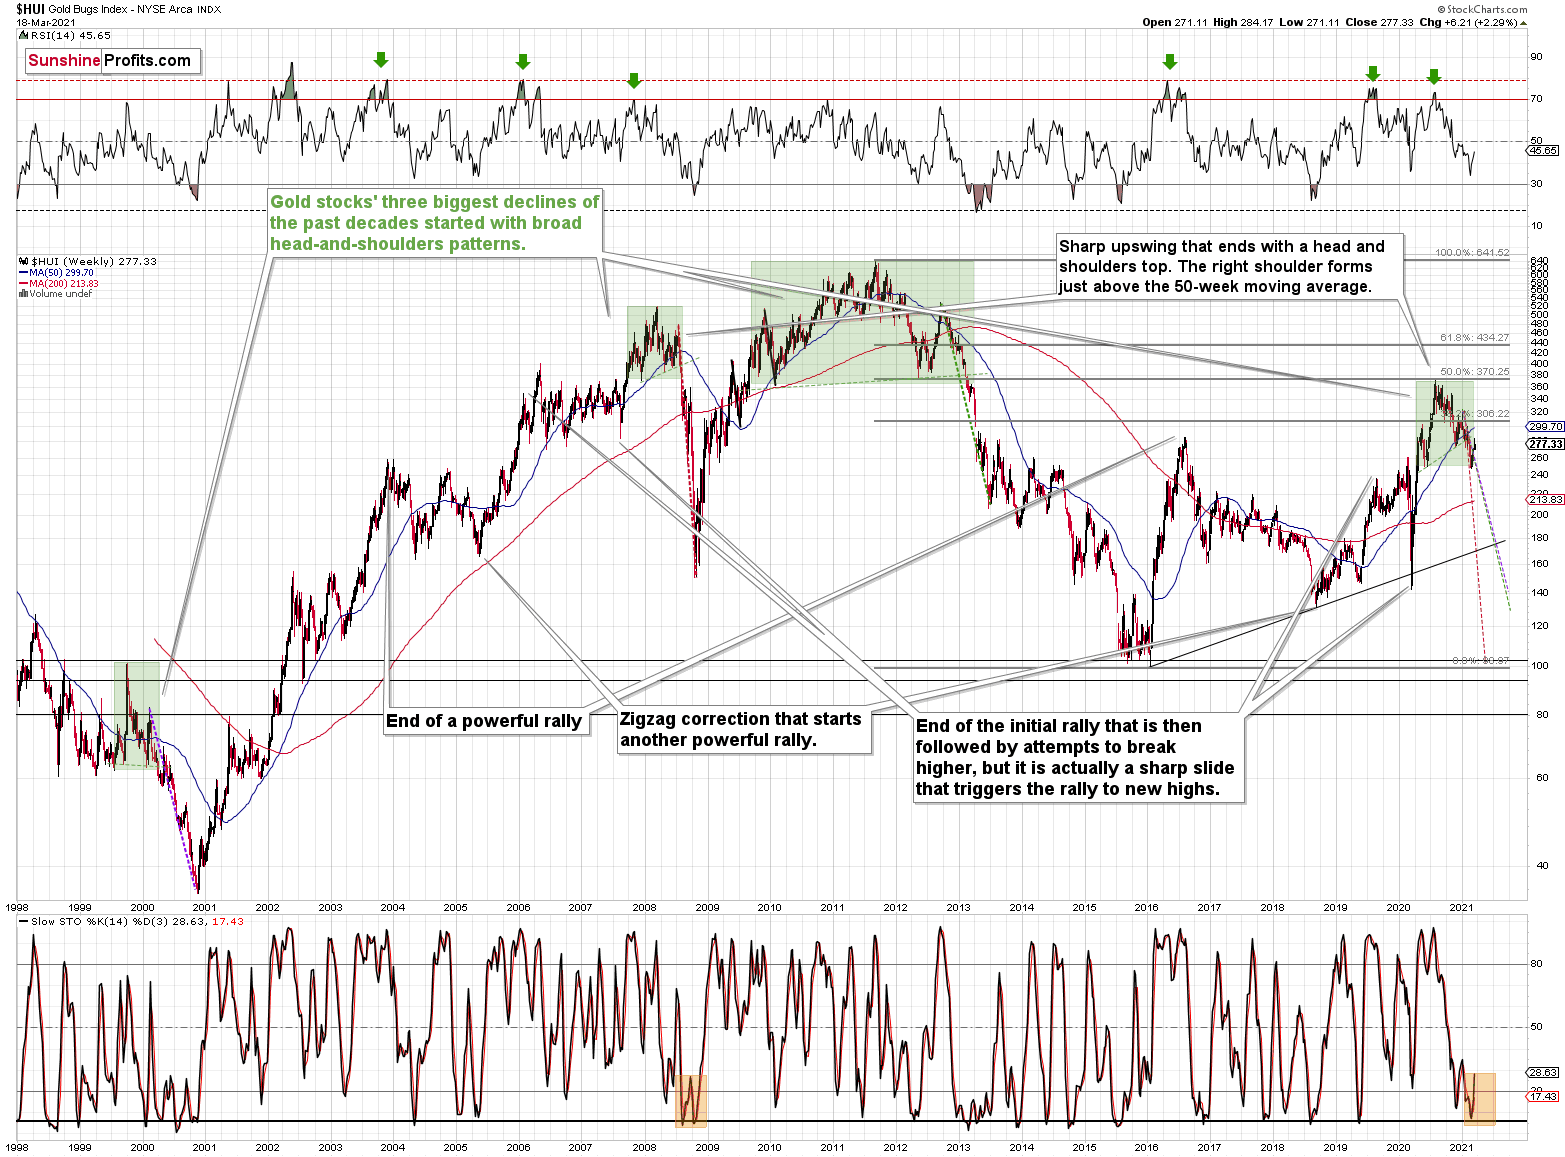
The stochastic indictor based on the HUI Index ended yesterday’s session at 28.63, which is close to where it had closed in late September 2008 – before the final part of the decline. Does it mean that the corrective upswing is already over, just as it was already over back in September 2008? That’s possible, but it’s not clear on a very short-term basis – at least not based on the above chart.
Please note that the above chart is based on the weekly candlesticks, so the stochastic indicator is also based on the weekly closing prices. This week is not yet over (it will be after today’s session), so the 28.63 value is just an indication of where the stochastic would have been if the HUI Index ended the week where it had ended yesterday’s session. So, something might change today, but I don’t expect to see big changes. And even if the stochastic indicator closed slightly higher or lower, it wouldn’t matter much, because it’s the general similarity that matters, not the 100% precise indicator levels.
The GDXJ wasn’t trading in 2008 (it was launched in late 2009), so we can’t compare it to the HUI Index with regard to similarity to this year, but let’s take a look at the GDX ETF.
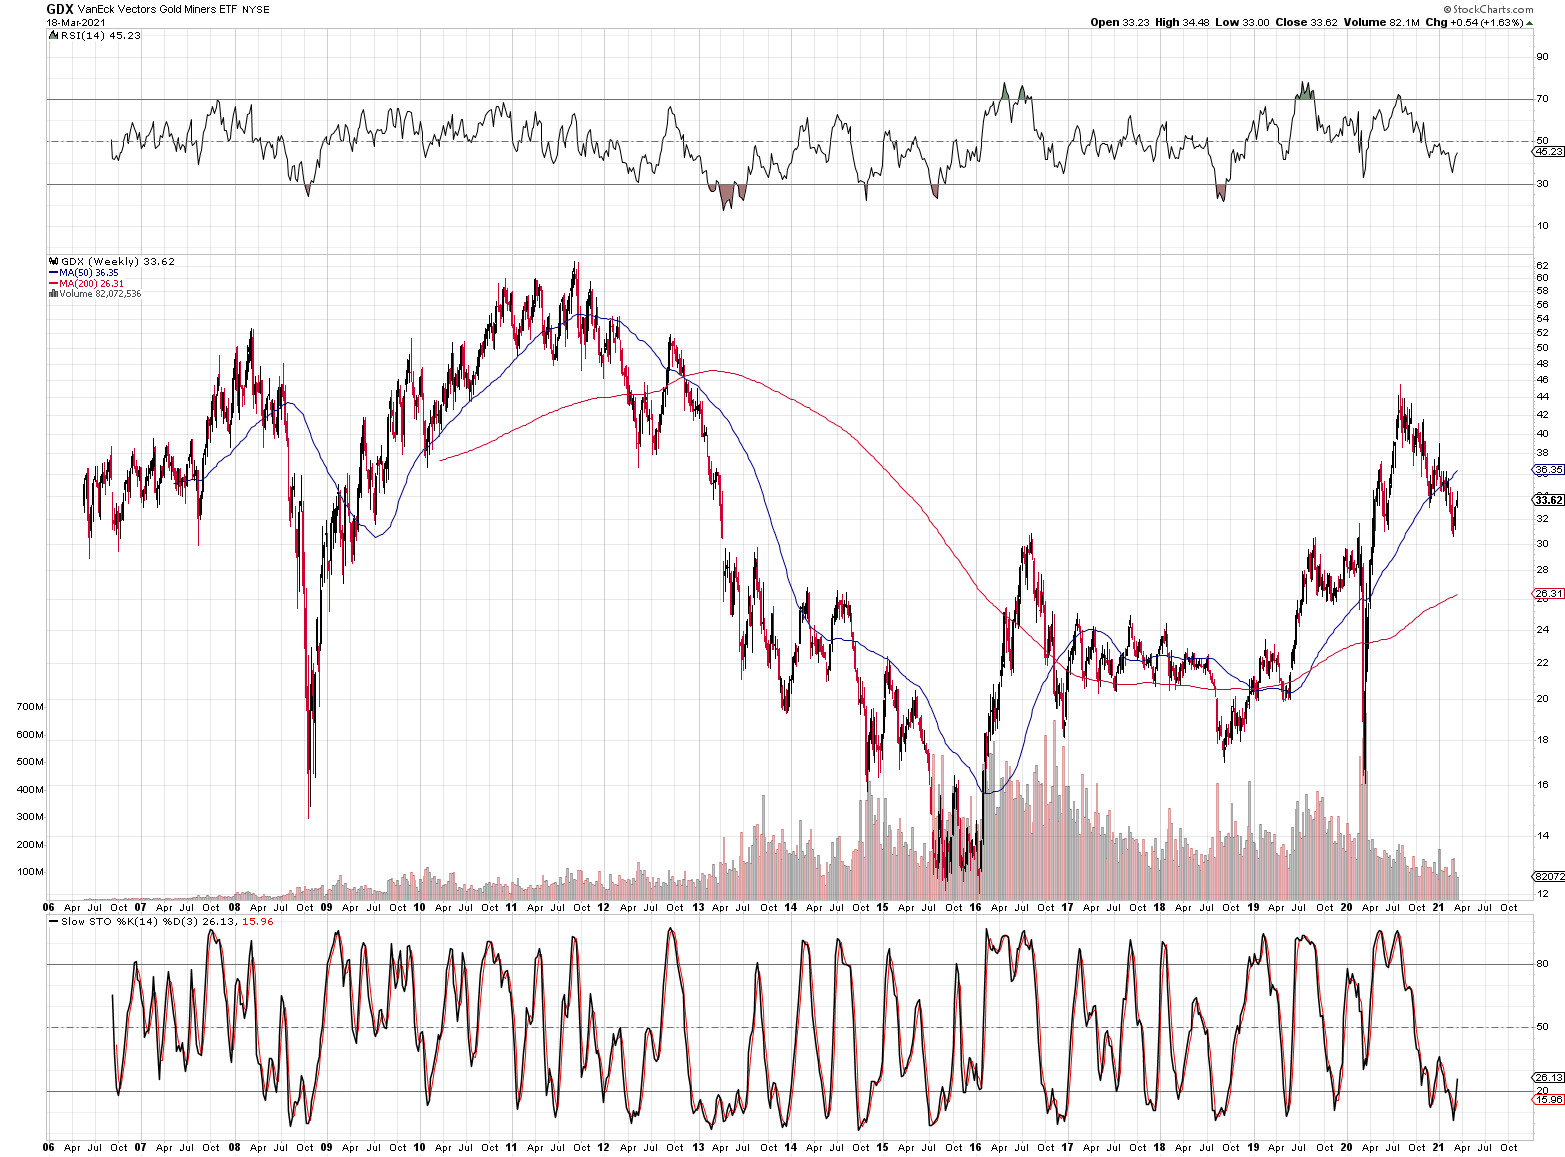
For an apples-to-apples comparison, I’m also using the GDX ETF chart that’s based on weekly price changes - the one that I’m usually using is based on daily closing prices, which is why the indicators based on it look differently than the ones on the above chart.
As you can see, there’s also a similarity in the performance of the stochastic indicator now and in 2008. In both cases (just like on the HUI Index), the stochastic indicator moved slightly back above the 20 level. Therefore, the implications of the analysis of the HUI Index remain intact.
Summary
To summarize, the PMs’ medium-term decline is well underway, and based on the recent performance of the USD Index, gold and mining stocks, it seems that the corrective upswing is already over (or about to be over). The next big move lower seems to be already underway or about to start.
In addition, because we’re likely entering the “winter” part of the Kondratiev cycle (just like in 1929 and then the 1930s), the outlook for the precious metals’ sector remains particularly bearish during the very first part of the cycle, when cash is king.
The confirmed breakout in the USD Index is yet another confirmation of the bearish outlook for the precious metals market.
After the sell-off (that takes gold to about $1,450 - $1,500), we expect the precious metals to rally significantly. The final part of the decline might take as little as 1-5 weeks, so it's important to stay alert to any changes.
Most importantly, please stay healthy and safe. We made a lot of money last March and it seems that we’re about to make much more on this March decline, but you have to be healthy to enjoy the results.
As always, we'll keep you - our subscribers - informed.
By the way, we’re currently providing you with a possibility to extend your subscription for a year, two years or even three years with a special 20% discount. This discount can be applied right away, without the need to wait for your next renewal – if you choose to secure your premium access and complete the payment upfront. The boring time in the PMs is definitely over and the time to pay close attention to the market is here. Naturally, it’s your capital, and the choice is up to you, but it seems that it might be a good idea to secure more premium access now, while saving 20% at the same time. Our support team will be happy to assist you in the above-described upgrade at preferential terms – if you’d like to proceed, please contact us..
To summarize:
Trading capital (supplementary part of the portfolio; our opinion): Full speculative short positions (300% of the full position) in mining stocks are justified from the risk to reward point of view with the following binding exit profit-take price levels:
Mining stocks (price levels for the GDXJ ETF): binding profit-take exit price: $24.12; stop-loss: none (the volatility is too big to justify a stop-loss order in case of this particular trade)
Alternatively, if one seeks leverage, we’re providing the binding profit-take levels for the JDST (2x leveraged) and GDXD (3x leveraged – which is not suggested for most traders/investors due to the significant leverage). The binding profit-take level for the JDST: $39.87; stop-loss for the JDST: none (the volatility is too big to justify a SL order in case of this particular trade); binding profit-take level for the GDXD: $94.87; stop-loss for the GDXD: none (the volatility is too big to justify a SL order in case of this particular trade).
For-your-information targets (our opinion; we continue to think that mining stocks are the preferred way of taking advantage of the upcoming price move, but if for whatever reason one wants / has to use silver or gold for this trade, we are providing the details anyway.):
Silver futures upside profit-take exit price: unclear at this time - initially, it might be a good idea to exit, when gold moves to $1,512.
Gold futures upside profit-take exit price: $1,512.
Long-term capital (core part of the portfolio; our opinion): No positions (in other words: cash
Insurance capital (core part of the portfolio; our opinion): Full position
Whether you already subscribed or not, we encourage you to find out how to make the most of our alerts and read our replies to the most common alert-and-gold-trading-related-questions.
Please note that we describe the situation for the day that the alert is posted in the trading section. In other words, if we are writing about a speculative position, it means that it is up-to-date on the day it was posted. We are also featuring the initial target prices to decide whether keeping a position on a given day is in tune with your approach (some moves are too small for medium-term traders, and some might appear too big for day-traders).
Additionally, you might want to read why our stop-loss orders are usually relatively far from the current price.
Please note that a full position doesn't mean using all of the capital for a given trade. You will find details on our thoughts on gold portfolio structuring in the Key Insights section on our website.
As a reminder - "initial target price" means exactly that - an "initial" one. It's not a price level at which we suggest closing positions. If this becomes the case (like it did in the previous trade), we will refer to these levels as levels of exit orders (exactly as we've done previously). Stop-loss levels, however, are naturally not "initial", but something that, in our opinion, might be entered as an order.
Since it is impossible to synchronize target prices and stop-loss levels for all the ETFs and ETNs with the main markets that we provide these levels for (gold, silver and mining stocks - the GDX ETF), the stop-loss levels and target prices for other ETNs and ETF (among other: UGL, GLL, AGQ, ZSL, NUGT, DUST, JNUG, JDST) are provided as supplementary, and not as "final". This means that if a stop-loss or a target level is reached for any of the "additional instruments" (GLL for instance), but not for the "main instrument" (gold in this case), we will view positions in both gold and GLL as still open and the stop-loss for GLL would have to be moved lower. On the other hand, if gold moves to a stop-loss level but GLL doesn't, then we will view both positions (in gold and GLL) as closed. In other words, since it's not possible to be 100% certain that each related instrument moves to a given level when the underlying instrument does, we can't provide levels that would be binding. The levels that we do provide are our best estimate of the levels that will correspond to the levels in the underlying assets, but it will be the underlying assets that one will need to focus on regarding the signs pointing to closing a given position or keeping it open. We might adjust the levels in the "additional instruments" without adjusting the levels in the "main instruments", which will simply mean that we have improved our estimation of these levels, not that we changed our outlook on the markets. We are already working on a tool that would update these levels daily for the most popular ETFs, ETNs and individual mining stocks.
Our preferred ways to invest in and to trade gold along with the reasoning can be found in the how to buy gold section. Furthermore, our preferred ETFs and ETNs can be found in our Gold & Silver ETF Ranking.
As a reminder, Gold & Silver Trading Alerts are posted before or on each trading day (we usually post them before the opening bell, but we don't promise doing that each day). If there's anything urgent, we will send you an additional small alert before posting the main one.
Thank you.
Przemyslaw Radomski, CFA
Founder, Editor-in-chief

