

Briefly: In our opinion, full (150% of the regular size of the position) speculative short positions in gold, silver and mining stocks are justified from the risk/reward perspective at the moment of publishing this alert. In other words, we are further increasing the size of the position based on additional bearish signs.
The gold volatility index moved to a new all-time low and there was no meaningful action in gold recently. Well, we profited on the decline and on the following upswing, but the price action that we saw was nothing to call home about. For months, gold has been moving around the $1,300 level and it’s trading relatively close to it also today. But, will this action persist for much longer? Not likely. It seems that something is about to hit the fan.
Before this week, there were many signs pointing to lower prices of precious metals in the following weeks, but not necessarily in the following days. This week, we are finally seeing the bearish short-term confirmations. We discussed them yesterday and in today’s analysis, we provide a big update.
Let’s start with the gold chart (chart courtesy of http://stockcharts.com).
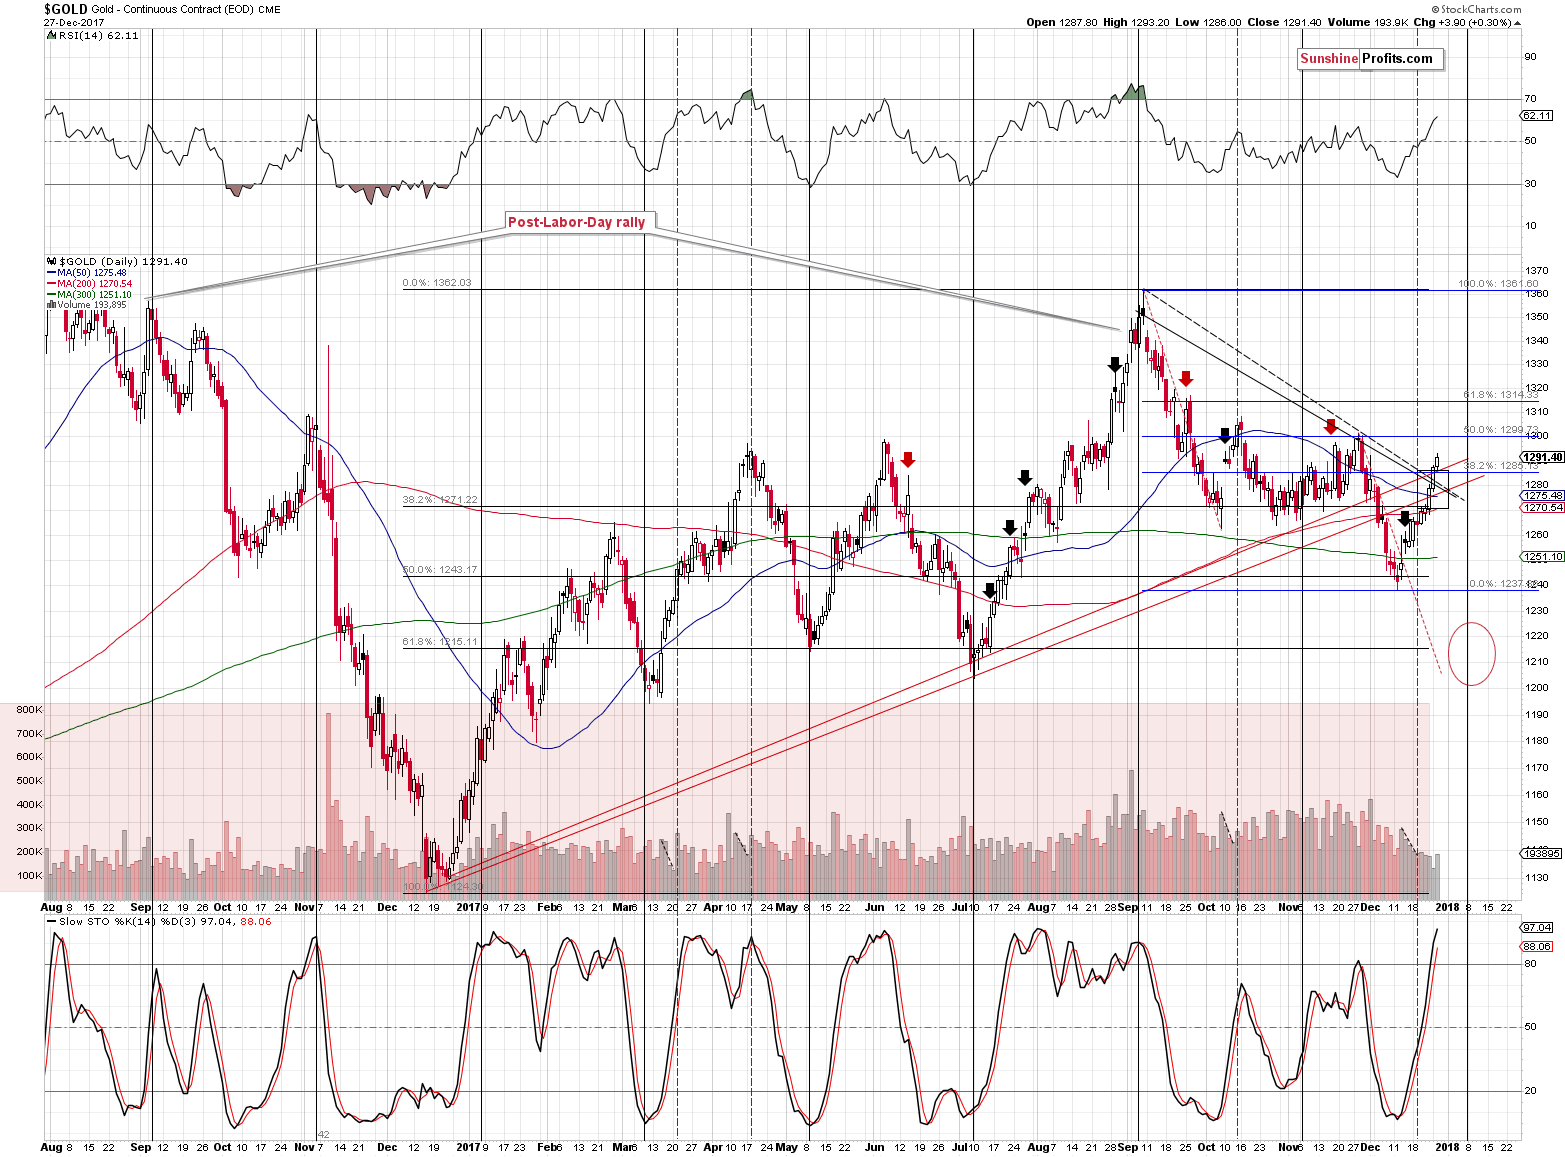
Gold moved above the combination of resistance levels, but it doesn’t seem to be a big deal. The reasons are the proximity of another combination of resistance levels just several dollars higher and the fact that we have multiple other bearish indications in place.
As far as the combination of resistance levels is concerned, we have the 50% Fibonacci retracement, the November and (approximately) October highs and the psychologically important $1,300 level.
In terms of time, we have the apex of the triangle based on the intraday extremes (declining black dashed line and the lower of the rising red lines) pointing to a turning point at the end of the year. We also have gold’s turning point around January 8th. Given silver’s outperformance and miners’ small decline that we saw yesterday, it seems that the former time target is more likely to mark the final top for this corrective upswing. This is particularly the case since we saw a turning point in the first days of 2017 but the bottom actually formed in December.
So, it seems that the end of the year might also mark the end of gold’s rally.
Also, there was no breakout above the rising resistance lines in the case of gold priced in terms of the euro.
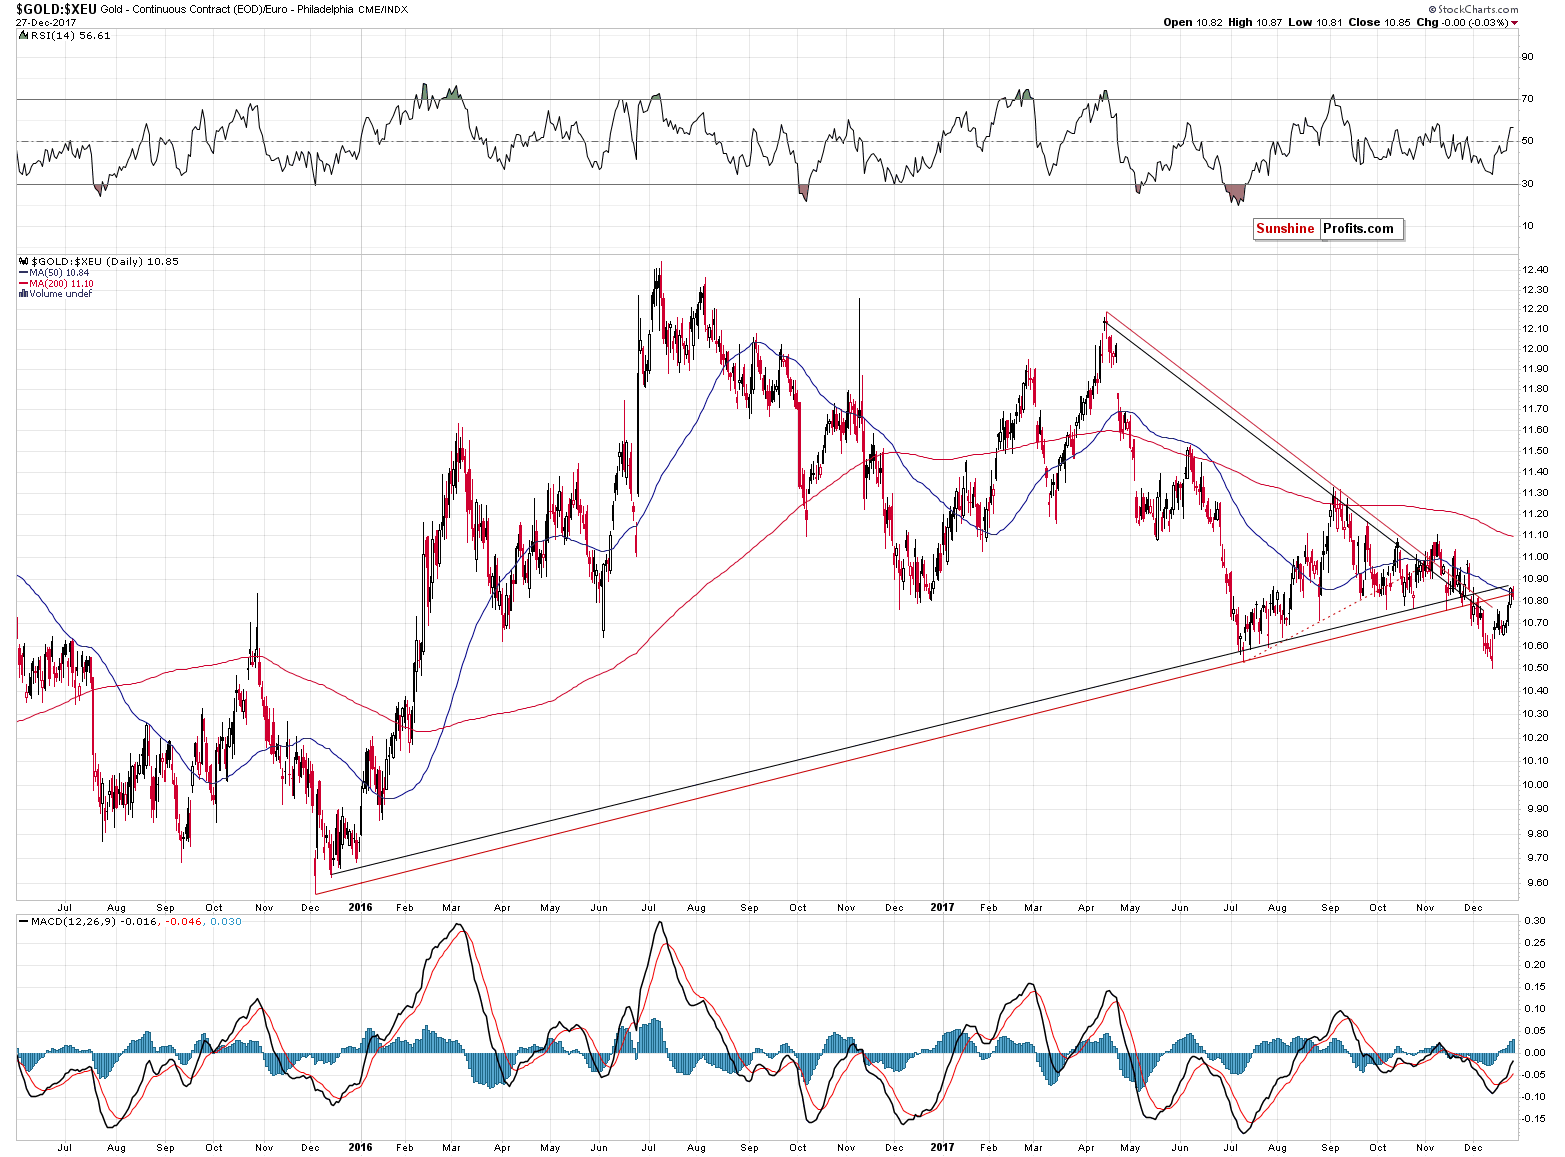
The yellow metal remains below the rising resistance lines, so the implications remain clearly bearish.
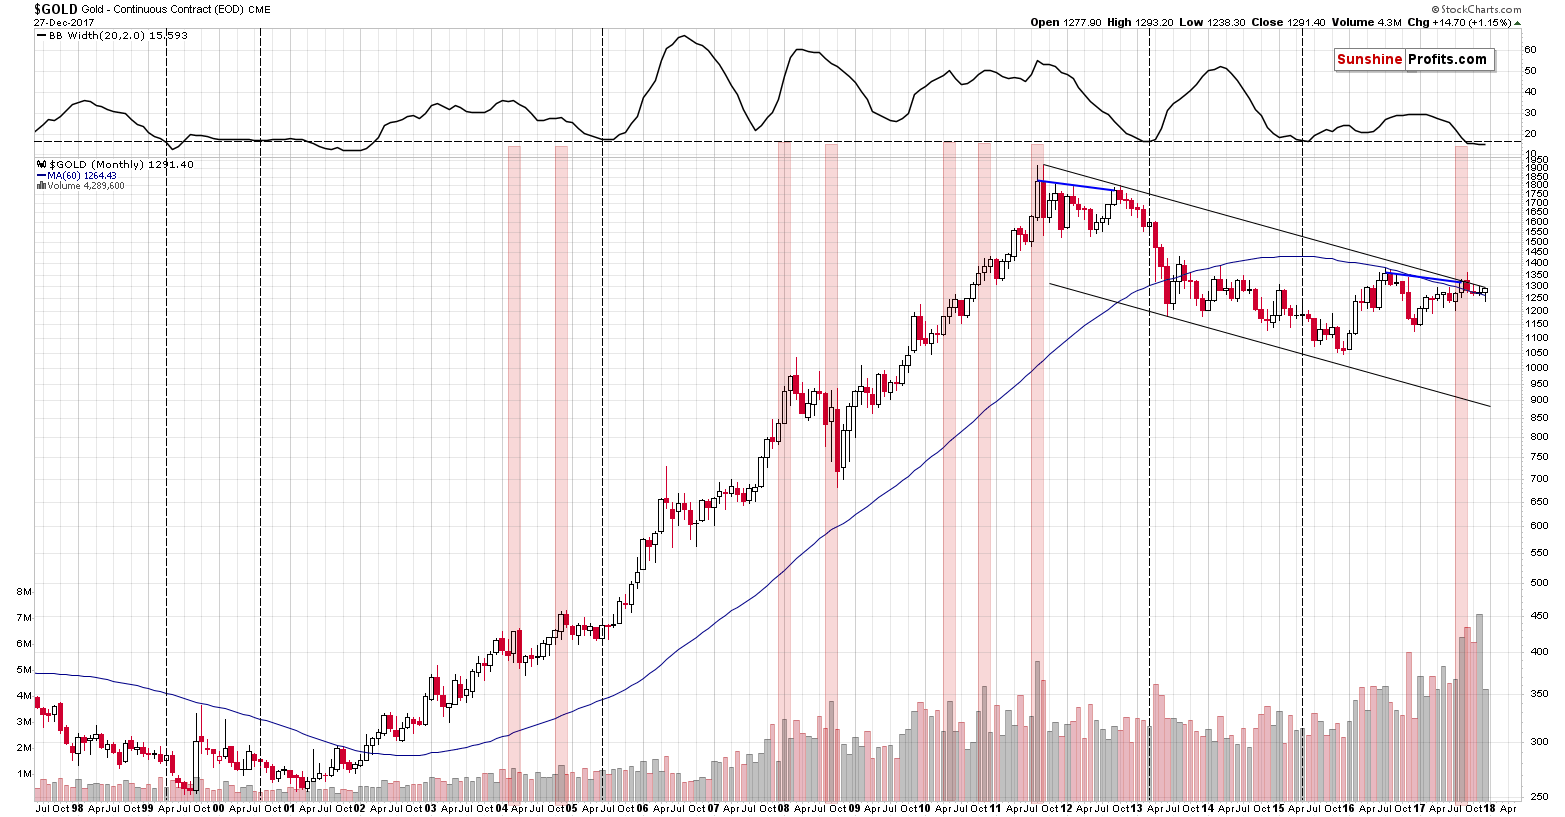
In terms of the monthly price changes, the current situation in gold became even more critical.
In yesterday’s alert, we wrote the following:
We described the analogy multiple times, but the key thing about the analogy is still right in front of us. The long-story-short version is this: the blue lines that connect the two key tops before the slide are analogous and their follow-up action is very similar as well. This makes it likely for the 2013 decline to be repeated either to the letter or on an approximate basis.
There was only one up month during the 2012 – 2013 decline and it was right before the most volatile and powerful part of the slide. This December is an up month so far, so unless gold declines shortly, we will have a very strong bearish indication for the following weeks. There are only three sessions left until the end of the year, so the above seems quite likely.
Combining the above with the timing target based on the apex of the triangle makes things very interesting. Gold is likely to reverse tomorrow, at the end of the year, which means that December is very likely to be an up month for gold. This in turn means that gold is likely to decline very sharply in January.
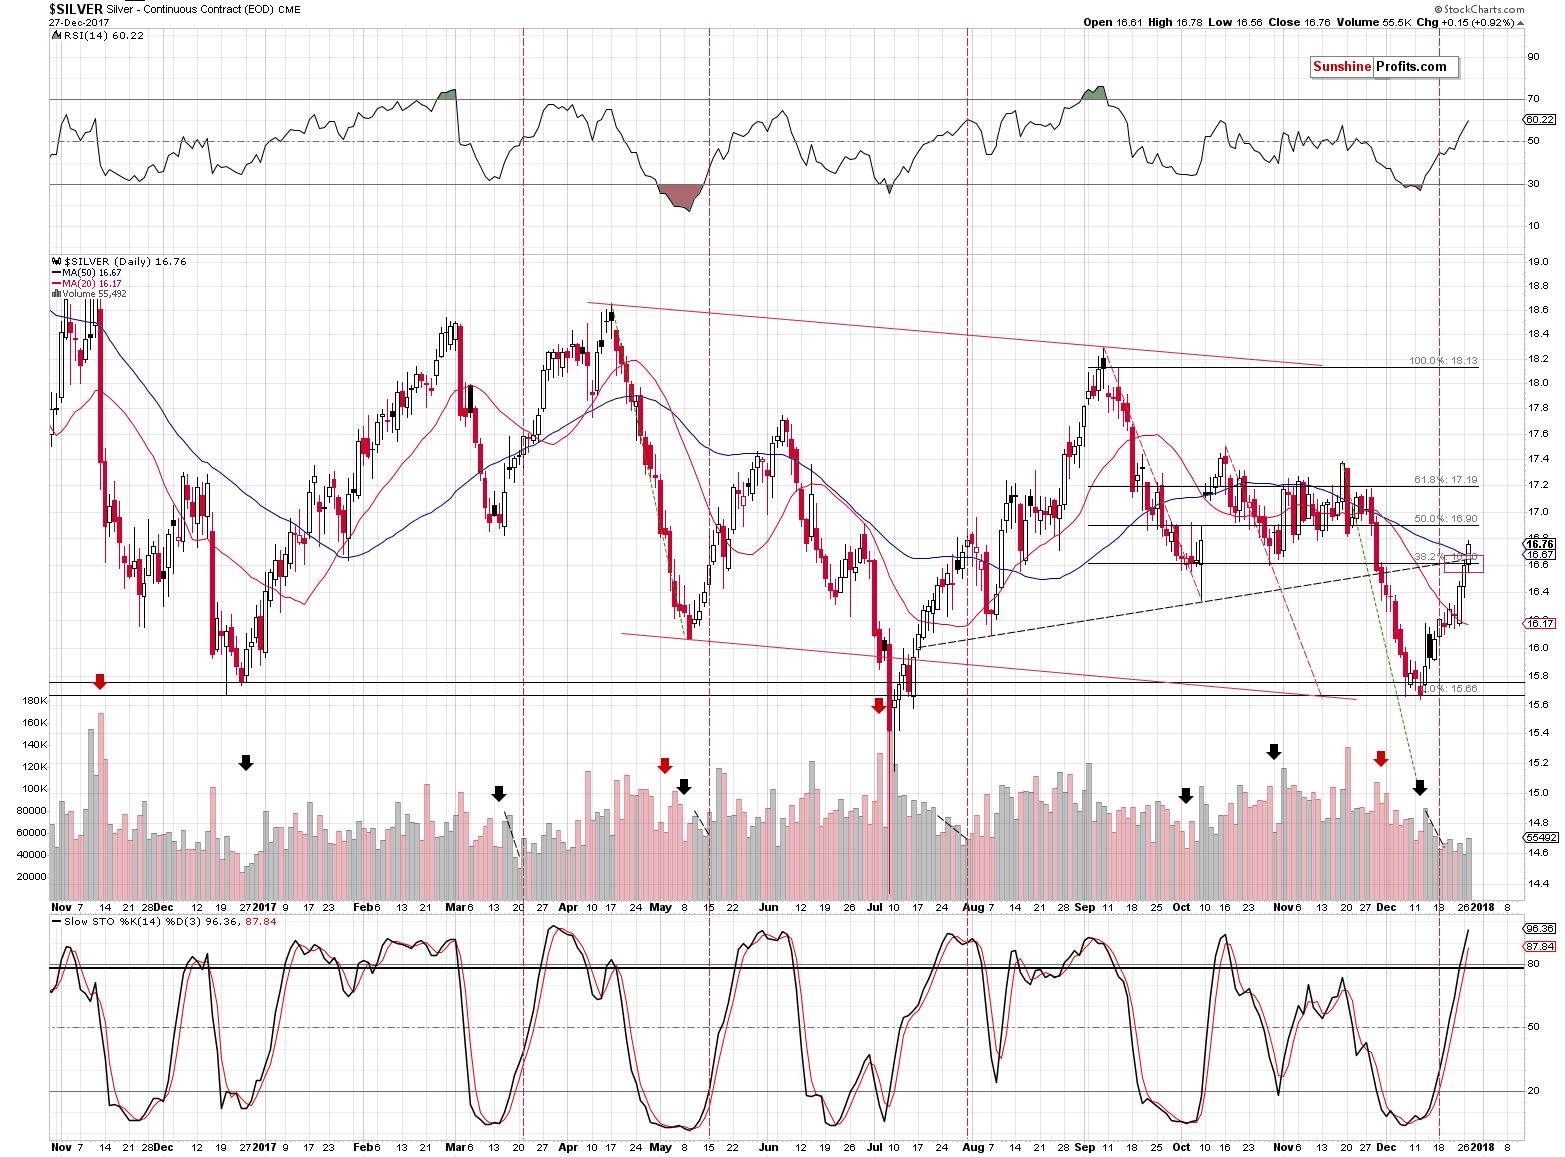
In yesterday’s alert we wrote the following about silver:
Silver moved to its target area as well. In fact, yesterday’s intraday top formed right in this area. Does this indicate that the top is in? Yes, but is it the confirmation from the silver market that we’ve been waiting for? Somewhat.
As a reminder, we’ve been waiting for silver to outperform gold and – in particular – mining stocks on a very short-term basis. Did we see this happen recently? In a way – yes. The last two trading days took silver higher and the entire size of the rally was quite significant compared to the gains that we saw in the previous several days.
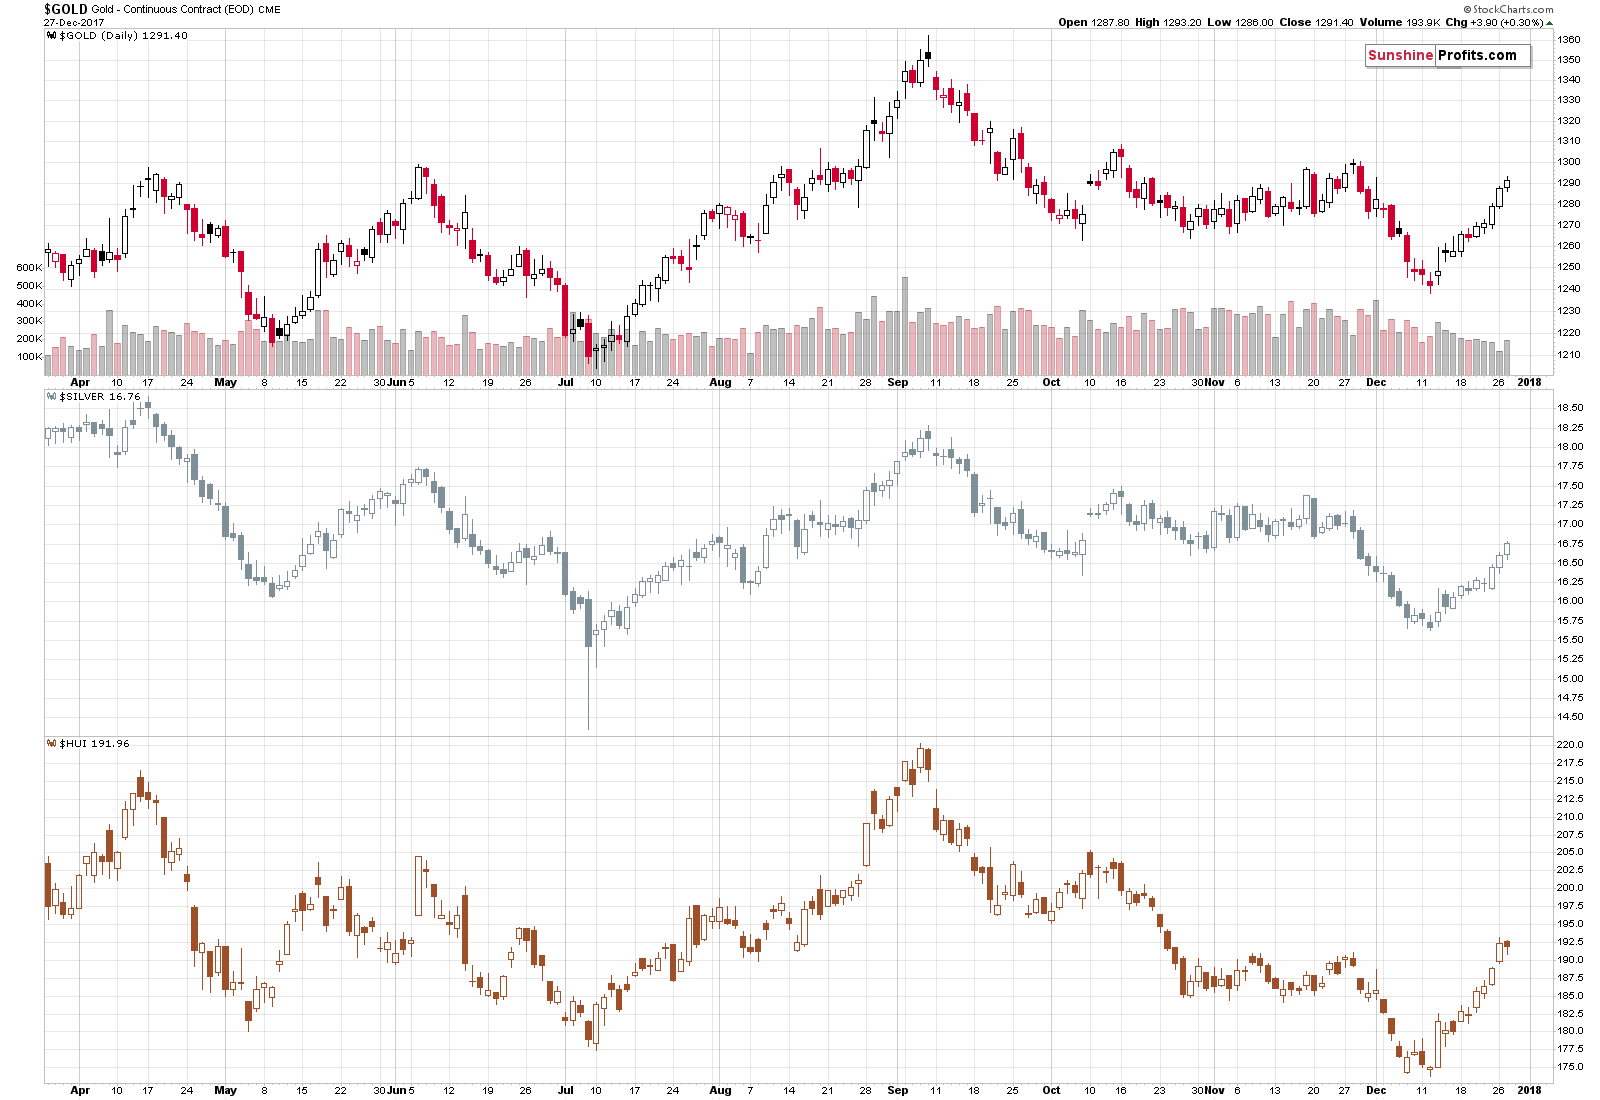
In terms of closing prices, between December 12 and December 21:
- Silver moved from $15.668 to $16.239 (3.64%)
- Gold moved from $1,241.70 to $1,270.60 (2.33%)
- The HUI Index moved from 174.97 to 186.34 (6.50%)
In the last two trading days:
- Silver moved from $16.239 to $16.60 (2.22%)
- Gold moved from $1,270.60 to $1,287.50 (1.33%)
- The HUI Index moved from 186.34 to 192.34 (3.22%)
Dividing the percentage gains in the past 2 trading days by the previous gains, we get the following:
- 2.22 / 3.64 = 61%
- 1.33 / 2.33 = 57%
- 3.22 / 6.50 = 50%
So, silver did rally most significantly in the past two days on a relative basis, but the strength of the outperformance was moderate (just a little stronger than gold). Based on our experience, it’s an early warning sign, not a confirmed sell signal.
Silver’s outperformance continued after we published the above and thus we increased the size of the short positions later on, especially that the action was accompanied by miners’ weakness.
Silver’s strength continues today, so let’s check how the above percentages changed based on what happened yesterday and what’s happening in today’s pre-market trading.
In the last three trading days + today’s pre-market trading (in the case of gold and silver):
- Silver moved from $16.239 to $16.75 (3.15%)
- Gold moved from $1,270.60 to $1,290.70 (1.58%)
- The HUI Index moved from 186.34 to 191.96 (3.02%)
Dividing the percentage gains in the past 3 trading days + today’s pre-market trading by the previous gains, we get the following:
- Silver: 3.15 / 3.64 = 87%
- Gold: 1.58 / 2.33 = 68%
- The HUI Index: 3.02 / 6.50 = 46%
Silver’s outperformance is now much clearer and so is miners’ lack of strength. Therefore, the bearish implications for the short term are also much stronger.
On a side note, due to the fractal nature of the markets, the above outperformance-underperformance analysis can also be applied to big moves in the precious metals sector and we are finishing our research in this area. We created a new indicator dedicated to it and we’ll be happy to present it once we’re done testing it.
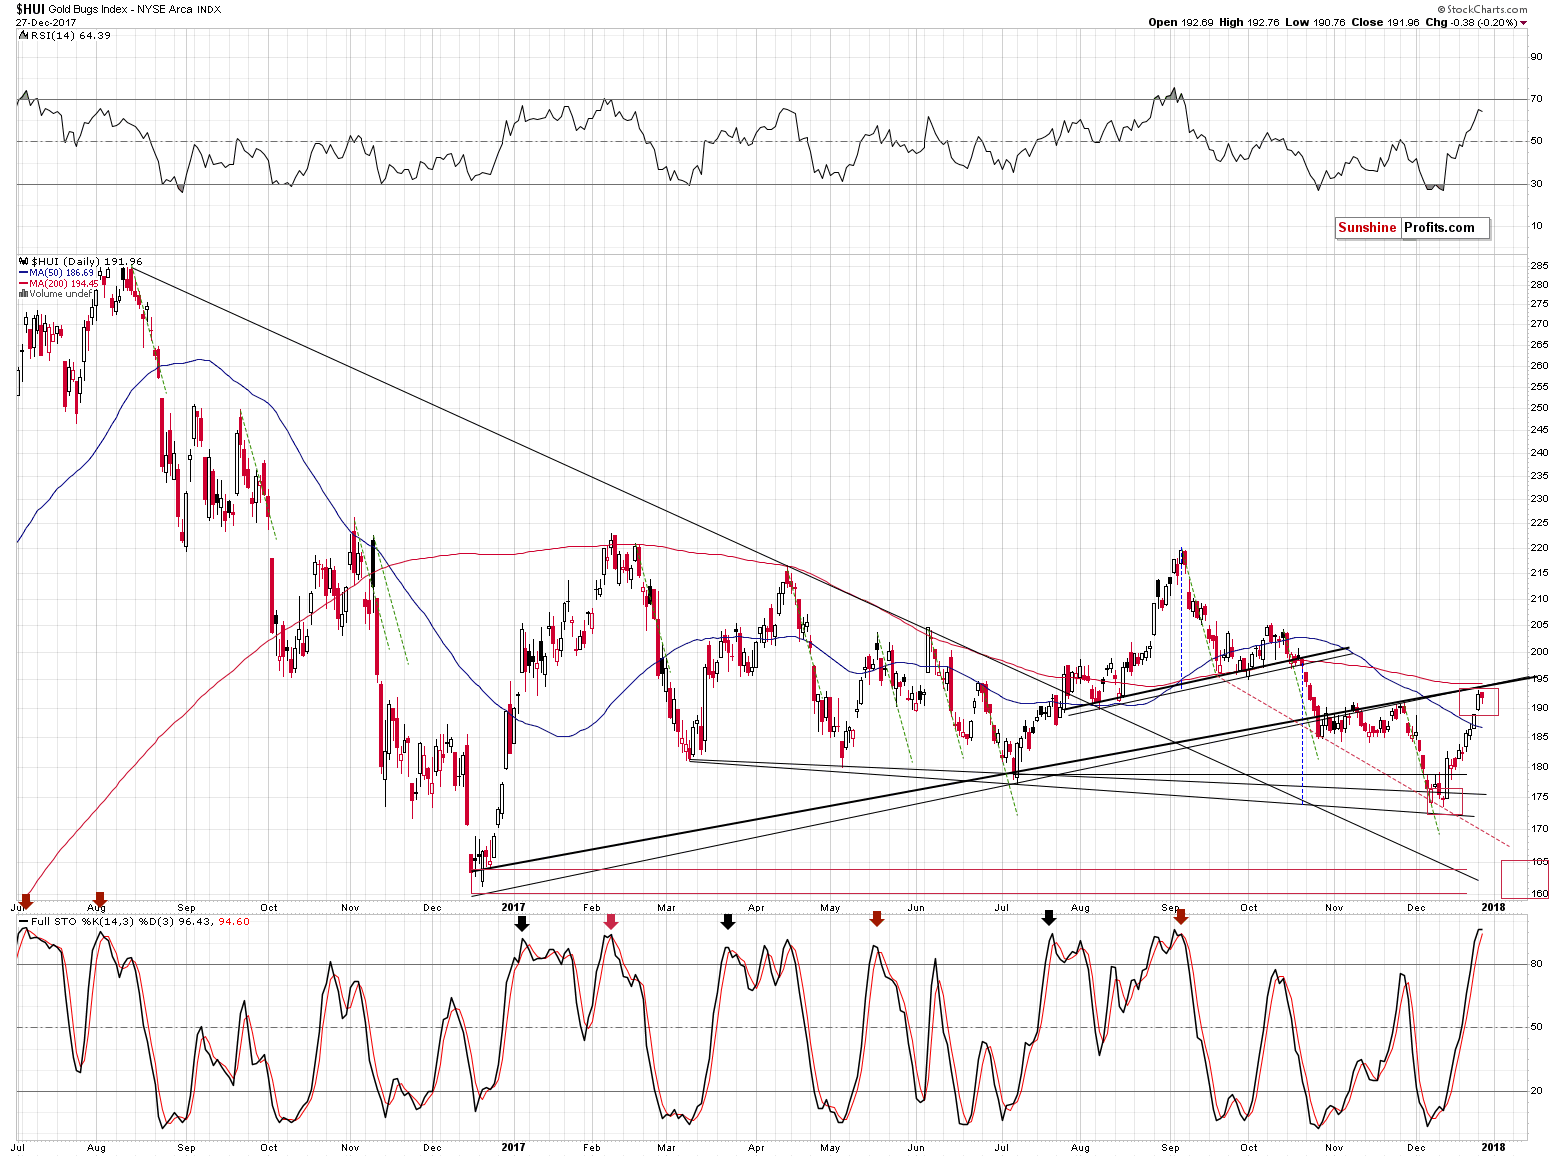
Gold stocks declined a bit yesterday, but since the 200-day moving average and the rising resistance lines were not reached, we wouldn’t be surprised to see a move to these levels before another powerful decline starts.
Still, it doesn’t seem that we will have to wait for much longer and it’s based on more than just the above, silver’s outperformance and the specific situation in gold.
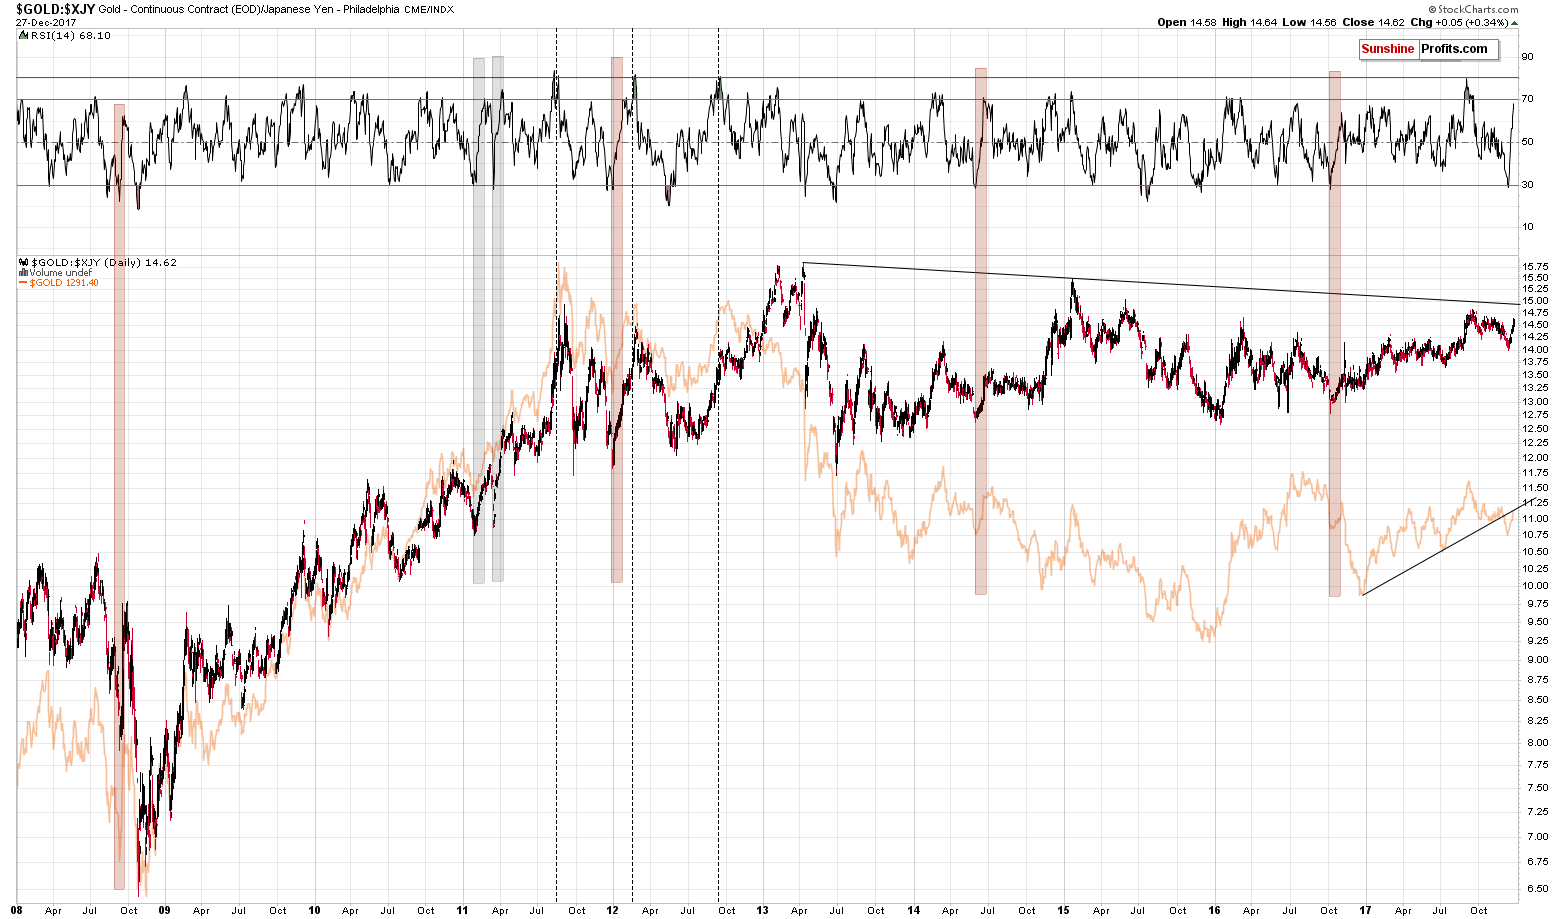
The situation in gold priced in the Japanese yen just became even more extreme. In yesterday’s alert, we described the above chart in the following way:
What we discuss below is what’s generally below the investment surface. It’s the things that people usually don’t write about because they are not aware of these relationships or that they don’t care enough to analyze them thoroughly. We do.
(…)
The next thing that’s rarely monitored is gold’s price in terms of the Japanese yen. Even if it is monitored, then the dynamics of the RSI indicator plotted on it are never or almost never discussed.
Gold very often moves in tune with the Japanese yen. We even received a few messages in the past years saying that analyzing gold is pointless as all it does is track the yen. On a side note, the above chart shows that between 2009 and the 2011 top, gold was much more than that.
Whenever gold doesn’t move in tune with the USD/JPY rate, the price of gold in terms of the Japanese yen changes. It recently changed significantly and the question is: “What can we infer from this kind of movement?”
Indicators are useful in many cases, including for making comparisons between price moves. Without them it would be more difficult to discuss similarities. In the current case, the RSI is after a sudden increase from below 30 to almost 70. There were only several such cases in the past decade. Two cases were seen after a multi-year rally while gold was rising within a relatively steep uptrend. We marked those cases with grey rectangles – they are not very similar to what happened recently. Gold has been trading sideways for a few years an it’s after a breakdown below the medium-term support line.
Consequently, the areas marked with red rectangles are much more similar as they were accompanied by similar developments. In these cases, gold was just finishing its corrective upswing. Sounds familiar? Exactly, that’s exactly what all the other charts are indicating.
The thing that we would like to emphasize today is that the maximum level that the RSI indicator achieved during its sudden rallies was just a bit above the 70 level and based on yesterday’s price action, the RSI moved to 68.10. Naturally, the current case can be the odd one and the RSI could rally further. All is possible in the market, but is it likely? No. What’s likely is that the RSI will stop shortly and the same thing is likely for gold priced in the Japanese yen, which makes the same likely for gold priced in the USD.
The above serves as a perfect confirmation of the scenario in which gold tops at the end of the year.
The turnaround might be at hand also in the currency market.
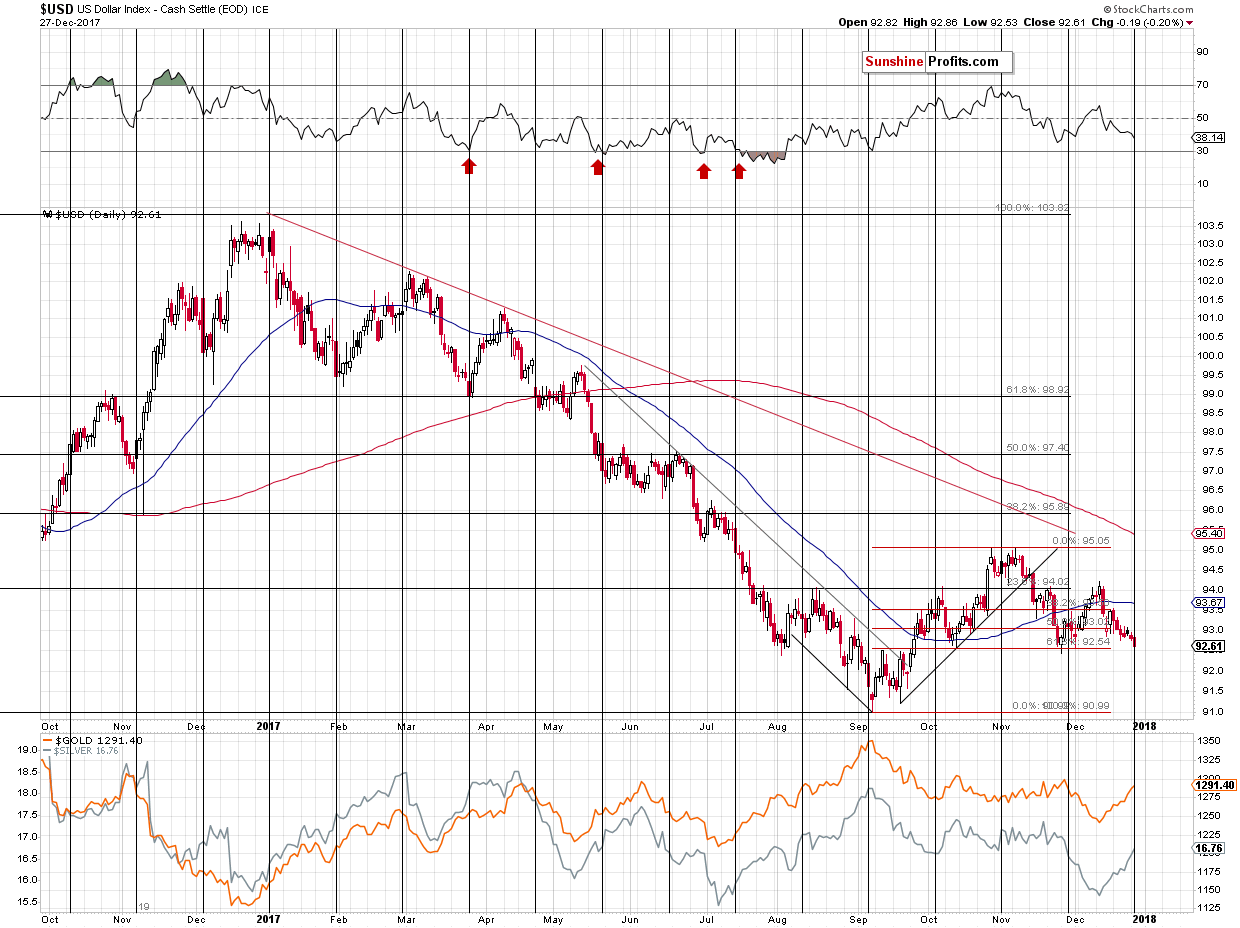
The USD Index is at its previous bottoms and since the head-and-shoulders patterns are rarely completed in it, we might be in for a major reversal shortly. Speaking of reversals – the USD Index is right at its cyclical turning point, which makes it likely that the rally will be seen either immediately or shortly.
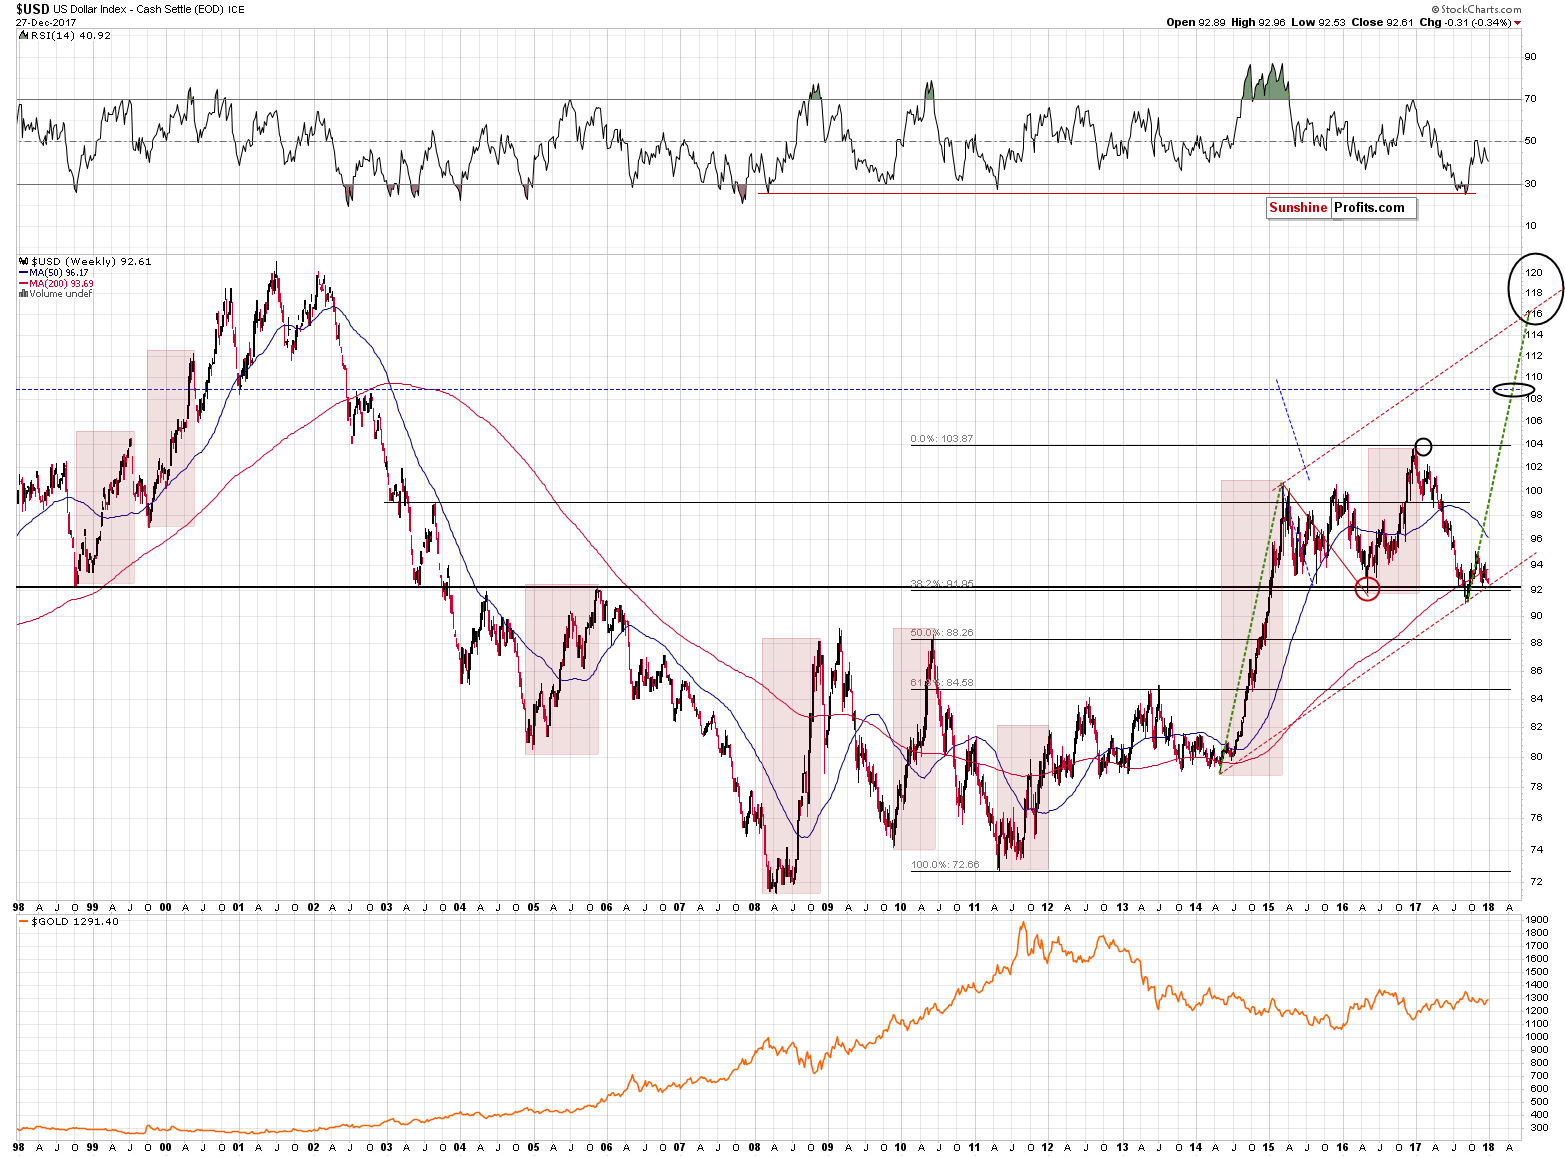
If that was not enough, the USD Index is also at its long-term rising support line. Again, that’s something likely to trigger a rally.
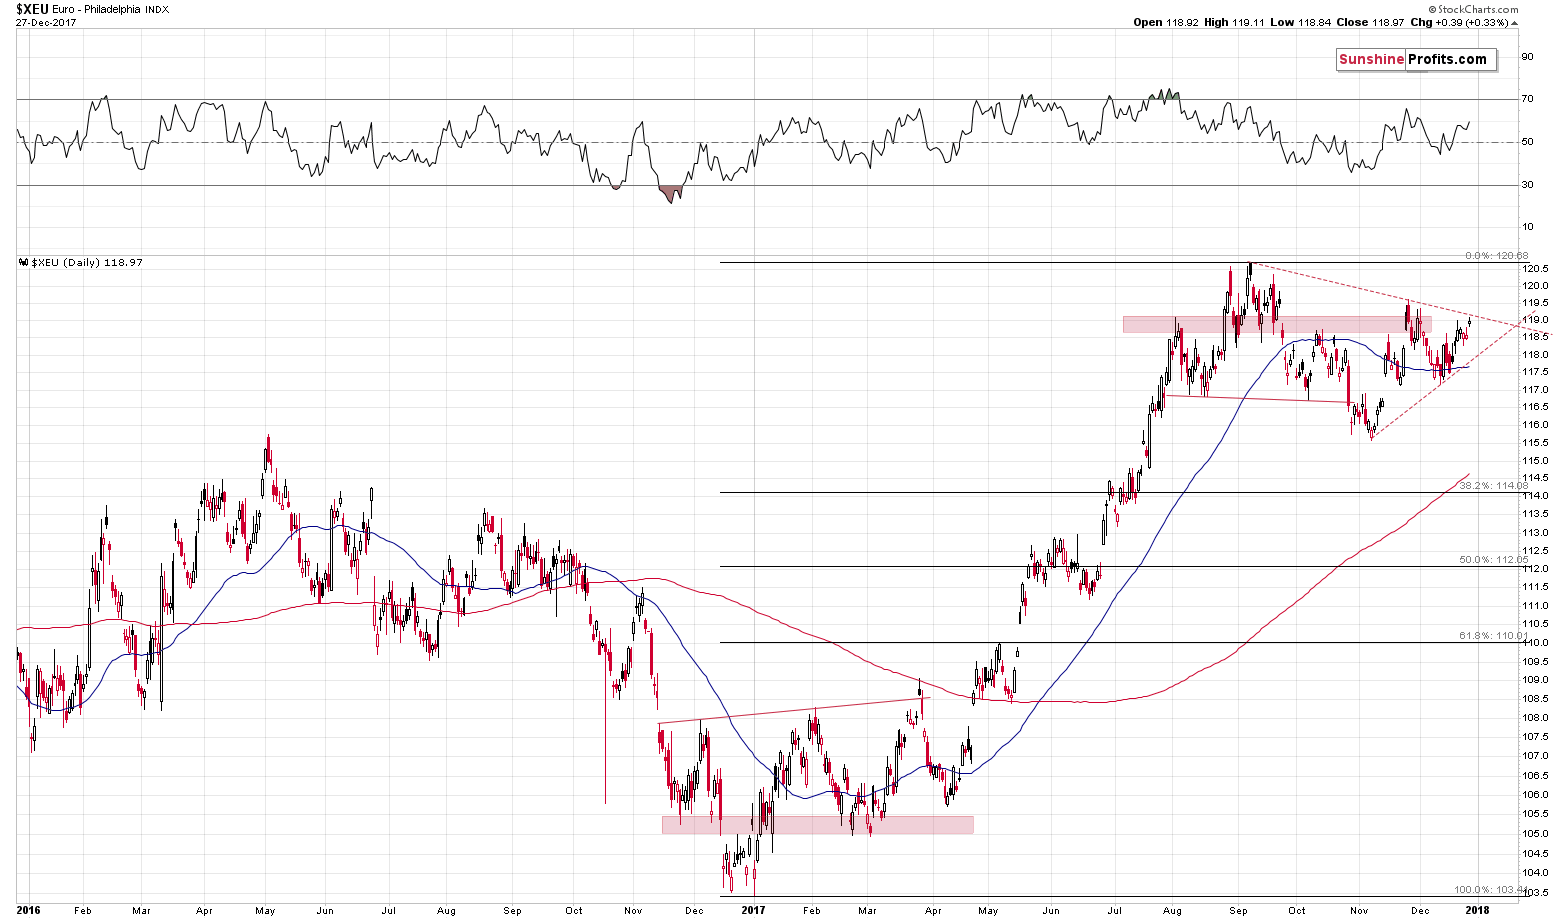
It’s not visible on the chart, though, as the euro moved to this level in today’s pre-market trading, but the EUR/USD is at its upper border of the declining resistance line. There was no breakout so the implications are bearish. They are bearish also for gold as the latter is likely to result in a move higher in the USD Index.
What might be even more important, however, is that the mentioned resistance line together with the rising support line create a triangle that has an apex in the second half of January. This indicates that we can expect some kind of turnaround at that time. This wouldn’t be much of a deal if…
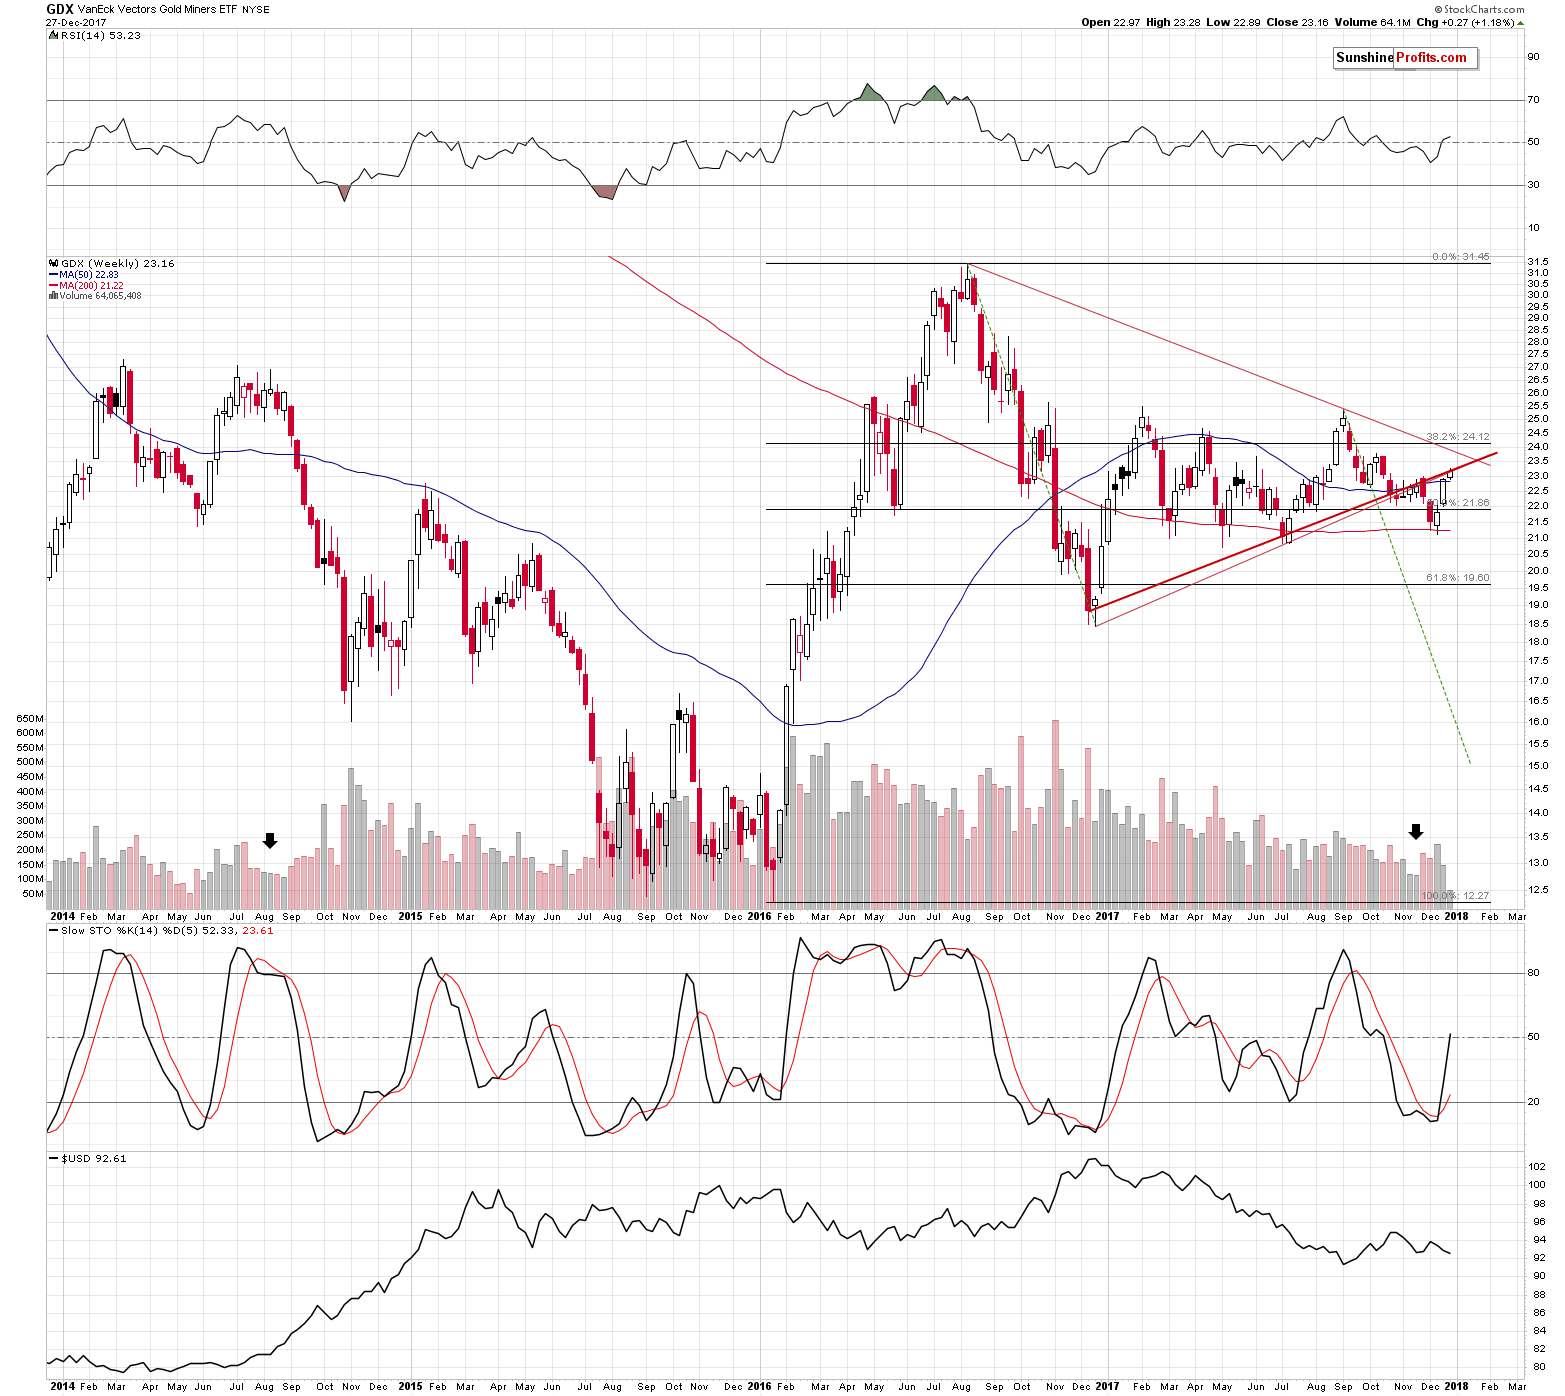
If we didn’t get exactly the same indications from an entirely different triangle in mining stocks. The size of the triangle and the parts of the capital market are entirely different so both patterns perfectly confirm each other.
Some kind of a big turnaround is likely to take place in the 3rd week of January or very close to it. It’s far from certain, but many factors seem to point to the scenario in which gold tops shortly and then takes a big dive in the first part of January and then forms a short-term bottom in the 3rd week of January. Then, after a corrective upswing, the decline continues. Please note that it’s also in perfect tune with what happened in 2013. Back then the corrective upswing after the first sharp slide was about 50% of the slide, so being aware of when such a correction could take place is indispensable.
Finally, before summarizing, let’s take a look at the sign that started the current corrective upswing. The big weekly decline in platinum.
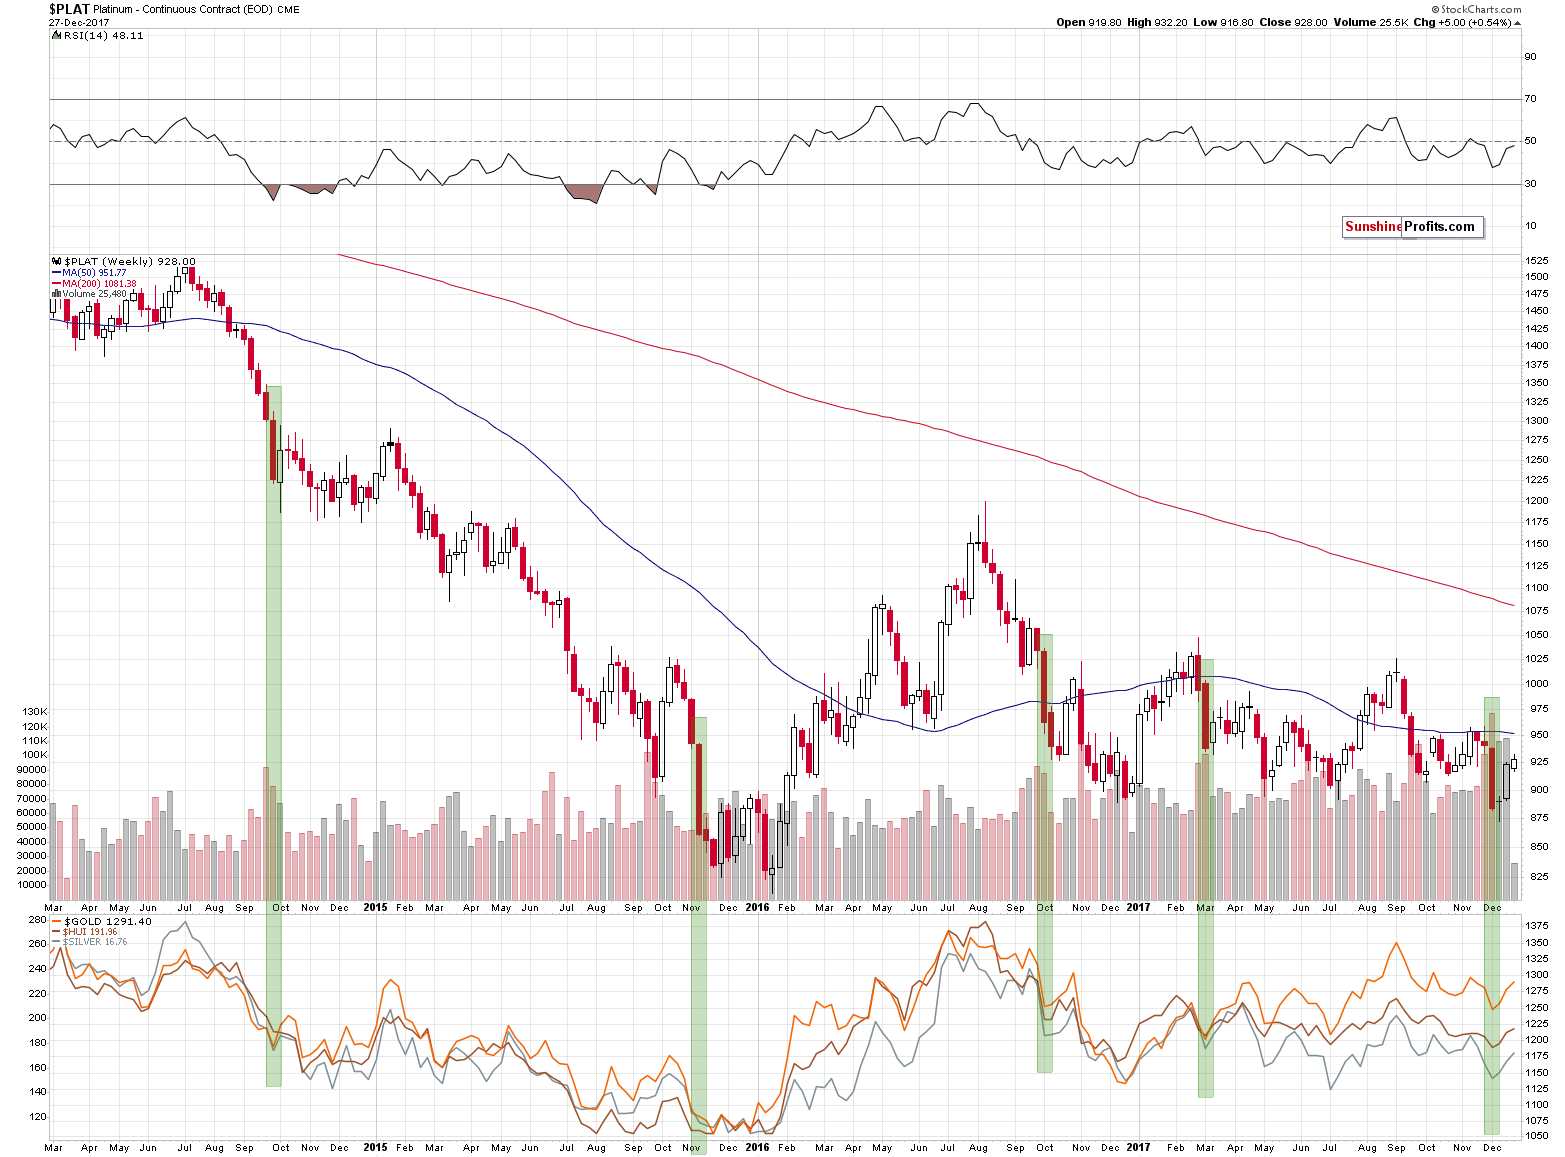
In the December 11 Gold & Silver Trading Alert, we commented on platinum’s slide in the following way:
As odd as it may sound, whenever platinum declined in a very profound way (about 5% in a week), it meant that either a corrective upswing was about to start in the following week (2014, 2016) or that a decline had just ended (2015, March 2017). We’ve seen this phenomenon 4 times in the recent years and in each case, it had bullish implications. 4 out of 4, meaning 100% efficiency is not something that should be ignored.
Does it mean that the precious metals sector will soar immediately? No. The above chart is based on weekly candlesticks in the case of platinum and weekly closing prices in the case of gold, silver and the HUI Index that are visible in the lower part of the above chart. Consequently, whatever implications the above chart has, they are in terms of the next week’s closing prices. So, gold, silver and mining stock are likely to end the next week higher, but not necessarily rally in its first part.
We previously mentioned that the Fed interest rate decision day could mark a turning point or we could see the interim bottom very close to it. The above chart supports this outlook and it suggests that we should be prepared to either exit the short positions or to switch to long ones. We are considering both options and which decision we take will depend on the confirmations that we get in the meantime.
The situation developed in line with the above and the reason that we are bringing this topic back today is to check if the follow-up action that was likely to be seen, was already seen. We discussed the potential size of the rally in the December 14 Alert:
Back in September 2014, gold rallied about $50, in 2016 it soared by about $80 (but about $50 in terms of weekly closing prices) and earlier this year gold moved higher by about $90. The 2015 bottom resulted in much bigger temporary gains.
The difference between the above cases is quite significant. The reason could be that in two cases, the big weekly decline in platinum took place during bigger declines and in two cases it took place either at the end of the big decline or within a bigger rally.
Since there are multiple reasons to believe that the precious metals sector is in a bigger decline, it seems that we should focus on the analogy to the 2014 and 2016 analogies.
As we wrote earlier, in the first case gold rallied about $65 in terms of intraday highs and about $50 in weekly closing prices. In the second case, it rallied by $80 or $50, using analogous measures. What does it tell us? It’s gives a hint that gold is likely to rally $50 - $80 from the bottom and that the lower part of this range is more likely.
The bottom formed around $1,240 which means that gold was likely to move higher to $1,290 - $1,320, with the lower part of this range as something more likely. According to kitco.com, today’s intraday high in gold was $1,292.50 (at least that’s the case at the moment of writing these words). It’s certainly likely that the top in gold is already in or at hand.
Summing up, the medium-term outlook for the precious metals market remains bearish as confirmed by multiple factors, and based on the most recent short-term factors, it seems that the corrective upswing in gold, silver and mining stocks is either over or close to being over. Moreover, based on yesterday’s intraday action, yesterday’s closing prices, and based on how gold, silver and the USD Index are performing so far today, it seems that the situation is now extremely bearish with the possibility of seeing a big, volatile downswing shortly. Consequently, it seems that increasing the size of the current short position further is now justified from the risk-to-reward point of view.
On an administrative note, due to your Editor’s Holiday- and year-end travel plans there will be no regular Gold & Silver Trading Alerts on January 2nd. In other words, this week the alerts are posted on Wednesday, Thursday and Friday, and following that, the next Alert will be posted on Wednesday, January 3rd.
However, since the situation in the precious metals is tense, we will be monitoring the market and if anything urgent happens, we’ll send you a quick message with our comments.
As always, we will keep you – our subscribers – informed.
To summarize:
Trading capital (supplementary part of the portfolio; our opinion): Full short positions (150% of the full position) in gold, silver and mining stocks are justified from the risk/reward perspective with the following stop-loss orders and initial target price levels:
- Gold: initial target price: $1,218; stop-loss: $1,322; initial target price for the DGLD ETN: $53.98; stop-loss for the DGLD ETN $40.98
- Silver: initial target price: $14.63; stop-loss: $17.62; initial target price for the DSLV ETN: $33.88; stop-loss for the DSLV ETN $21.78
- Mining stocks (price levels for the GDX ETF): initial target price: $19.22; stop-loss: $26.14; initial target price for the DUST ETF: $39.88; stop-loss for the DUST ETF $19.78
In case one wants to bet on junior mining stocks' prices (we do not suggest doing so – we think senior mining stocks are more predictable in the case of short-term trades – if one wants to do it anyway, we provide the details), here are the stop-loss details and initial target prices:
- GDXJ ETF: initial target price: $27.82; stop-loss: $38.22
- JDST ETF: initial target price: $94.88 stop-loss: $37.78
Long-term capital (core part of the portfolio; our opinion): No positions (in other words: cash)
Insurance capital (core part of the portfolio; our opinion): Full position
Important Details for New Subscribers
Whether you already subscribed or not, we encourage you to find out how to make the most of our alerts and read our replies to the most common alert-and-gold-trading-related-questions.
Please note that the in the trading section we describe the situation for the day that the alert is posted. In other words, it we are writing about a speculative position, it means that it is up-to-date on the day it was posted. We are also featuring the initial target prices, so that you can decide whether keeping a position on a given day is something that is in tune with your approach (some moves are too small for medium-term traders and some might appear too big for day-traders).
Plus, you might want to read why our stop-loss orders are usually relatively far from the current price.
Please note that a full position doesn’t mean using all of the capital for a given trade. You will find details on our thoughts on gold portfolio structuring in the Key Insights section on our website.
As a reminder – “initial target price” means exactly that – an “initial” one, it’s not a price level at which we suggest closing positions. If this becomes the case (like it did in the previous trade) we will refer to these levels as levels of exit orders (exactly as we’ve done previously). Stop-loss levels, however, are naturally not “initial”, but something that, in our opinion, might be entered as an order.
Since it is impossible to synchronize target prices and stop-loss levels for all the ETFs and ETNs with the main markets that we provide these levels for (gold, silver and mining stocks – the GDX ETF), the stop-loss levels and target prices for other ETNs and ETF (among other: UGLD, DGLD, USLV, DSLV, NUGT, DUST, JNUG, JDST) are provided as supplementary, and not as “final”. This means that if a stop-loss or a target level is reached for any of the “additional instruments” (DGLD for instance), but not for the “main instrument” (gold in this case), we will view positions in both gold and DGLD as still open and the stop-loss for DGLD would have to be moved lower. On the other hand, if gold moves to a stop-loss level but DGLD doesn’t, then we will view both positions (in gold and DGLD) as closed. In other words, since it’s not possible to be 100% certain that each related instrument moves to a given level when the underlying instrument does, we can’t provide levels that would be binding. The levels that we do provide are our best estimate of the levels that will correspond to the levels in the underlying assets, but it will be the underlying assets that one will need to focus on regarding the signs pointing to closing a given position or keeping it open. We might adjust the levels in the “additional instruments” without adjusting the levels in the “main instruments”, which will simply mean that we have improved our estimation of these levels, not that we changed our outlook on the markets. We are already working on a tool that would update these levels on a daily basis for the most popular ETFs, ETNs and individual mining stocks.
Our preferred ways to invest in and to trade gold along with the reasoning can be found in the how to buy gold section. Additionally, our preferred ETFs and ETNs can be found in our Gold & Silver ETF Ranking.
As a reminder, Gold & Silver Trading Alerts are posted before or on each trading day (we usually post them before the opening bell, but we don't promise doing that each day). If there's anything urgent, we will send you an additional small alert before posting the main one.
=====
Latest Free Trading Alerts:
S&P 500 index gained 0.1% on Wednesday, as it remained within an over-week-long consolidation. Is this a topping pattern or just some relatively flat correction before another leg higher?
Positive Expectations, But Will S&P 500 Continue Higher?
Although USD/JPY came back above the long-term line, we didn’t notice significant increases in the following days. Will this show of currency bulls’ weakness result in another repetition of what we already saw in the past?
USD/JPY - Similarities to the Past
=====
Hand-picked precious-metals-related links:
Silver goes first, gold goes second: 2018 outperformers
UAE’s VAT may hurt India’s gold jewellery exports
India gets its own gold reference standard
=====
In other news:
Dollar Touches 1-Month Low as It Heads for Worst Year Since 2003
Flattening U.S. Yield Curve Nears Decade Lows in Final 2017 Push
World stocks in year-end rally as dollar retreats, copper surges
5 Questions for the Fed in 2018
Bitcoin Tumbles Over Exchange-Closure Fears
Bitcoin is losing its dominance over the crypto market
Italy Sets Stage for March Elections and Highlights Europe's Biggest 2018 Risk
=====
Thank you.
Sincerely,
Przemyslaw Radomski, CFA
Founder, Editor-in-chief, Gold & Silver Fund Manager
Gold & Silver Trading Alerts
Forex Trading Alerts
Oil Investment Updates
Oil Trading Alerts

