

Briefly: in our opinion, full (250% of the regular size of the position) speculative short positions in gold, silver and mining stocks are justified from the risk/reward perspective at the moment of publishing this alert.
We wrote quite a lot this week and it seems that we covered the key issues regarding the current situation in the precious metals market and what caused it. On Monday, we discussed the multiple factors that have been pointing to lower precious metals prices for months. Yesterday, we explained how we expect gold to decline, rebound and then decline once again in the following weeks and what the optimal (in our view) strategy to make purchases would be at that time. Additionally, we showed you how high gold could rally in the following years, making the upcoming bottom an excellent buying opportunity. If you haven’t read all of the above analyses, we strongly suggest that you do.
Consequently, there’s not that much that we can add today as all that we wrote this week (and in the previous weeks as well to a large extent) remains up-to-date. Still, there are two things that we would like to comment on today: yesterday’s relative valuations, and the situation in mining stocks. Let’s start with the former (charts courtesy of http://stockcharts.com).
Gold vs. Silver vs. Mining Stocks
On Wednesday, we commented on the above chart in the following way:
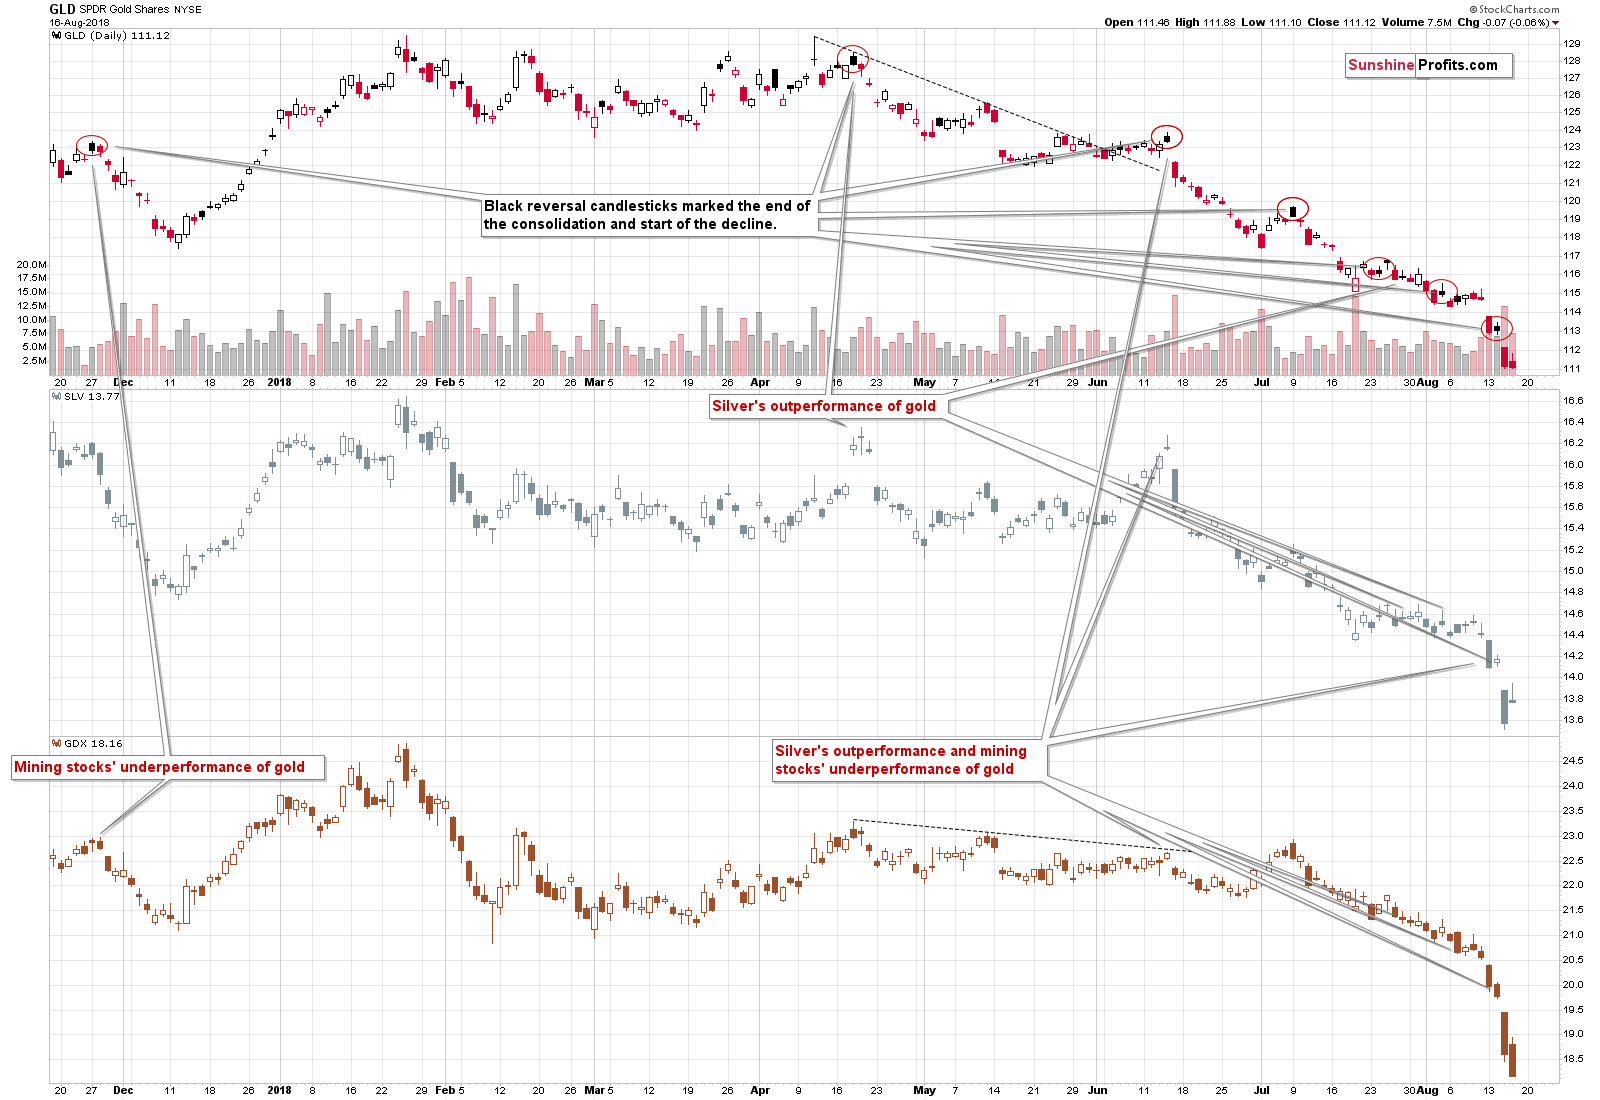
The relative strength of silver and relative weakness of mining stocks provided us with multiple profitable sell signals in the past several months. The opposite could be a bullish signal, but we haven’t seen one. We saw yet another bearish confirmation. Silver showed some short-term strength by moving a bit higher, gold was practically flat, and miners underperformed. That’s the most bearish combination that we could get as miners tend to underperform before declines and silver tends to outperform.
Interestingly, gold formed a black candlestick, which means that it closed higher than on the previous trading day, but below the opening prices. These sessions served as bearish confirmations previously and the implications are once again bearish at this time.
We wrote the above right before the biggest price slide of the week, so the signals were followed by exactly what was likely to follow. And we have just seen this kind of extreme performance again. It’s not an exaggeration – the discrepancy between silver’s daily rally and the mining stocks’ daily decline was huge. The silver bulls may not want to hear this, but the rally that we saw in silver yesterday was actually a bearish sign as it outperformed gold and at the same time miners strongly underperformed.
This does not look like the end of the decline. It looks like a pause before another big slide.
Mining Stocks’ Near-term Outlook
In the previous Alerts, we discussed the nearby targets for the HUI Index in the following way:
From the long-term point of view, we (…) have the 2008 bottom at 150, but it’s too close to be analogous to gold at $1,120 -$1,130 and we have the late 2015 top at about 140. There were also several local tops at about 120.
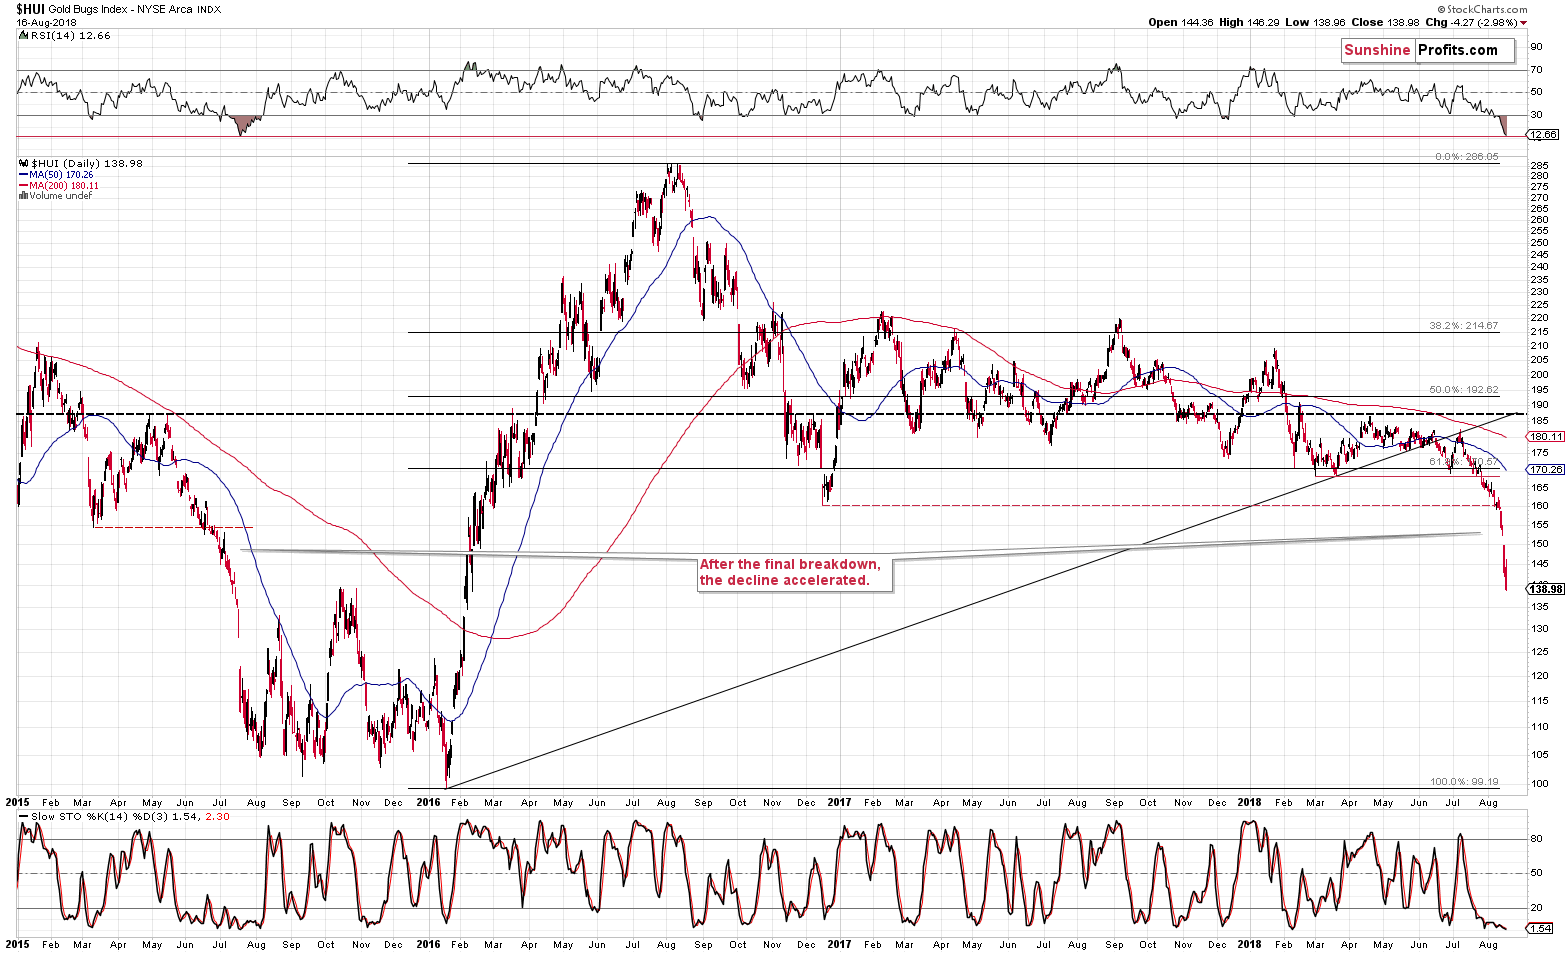
The HUI Index easily broke below 150, which shows just how weak this market is. The 2008 bottom stopped the decline twice in 2014, but it didn’t manage to do anything this time. Mining stocks are sliding dramatically, just like we described numerous times in the previous months. There is little support between the December 2016 low of 160 and the December 2015 support close to 100.
Let’s see what the relative dynamics tell us.
Gold’s highest closing price of July was $1,259.60, and it closed at $1,198.90 yesterday.
The HUI’s highest closing price of July was $179.70, and it closed at 154.52 yesterday.
Gold declined by 4.82%, while the HUI declined by 14.01%. This means that gold stocks magnified gold’s decline by 2.91. In other words, the HUI Index declined approximately 200% more than gold.
If this remains in place and we expect gold to decline from $1,198.90 to $1,125 (by 6.16%), we can expect HUI to decline by 200% more. This means a decline of 2.91 * 6.16% = 17.93%. Since HUI closed at 154.52, this means a move to 126.81.
This level doesn’t directly correspond to any other significant extreme, but it shows us more or less what to expect.
Based on our research (we will release a big research report on this in the following weeks), mining stocks tend to be the first to move in both directions, up or down, while silver tends to catch up in the final part of the move. This is more visible in the case of rallies, but this might also be useful during the current decline.
This is the early part of the decline, which suggests that mining stocks may get ahead of themselves and perhaps decline more than the relative dynamics suggest. This means that the next target would be between 100 and 120. That’s a rather wide target area but based on the details that we have right now we simply don’t have greater clarity.
As far as the GDX is concerned, this means a target between $13 and $15.
But, the most important signal will come from the gold market. If it moves below $1,150, we’ll check what nearby support levels we have for silver and mining stocks and these will become our target prices.
In yesterday’s Alert, we added:
The above remains up-to-date with a slightly more bearish bias. If we consider only this month, we get the following relative dynamics:
Gold’s July 31st closing price was $1,233.60, and it closed at $1,185 yesterday.
The HUI’s July 31st closing price of July was 166.36, and it closed at 143.25 yesterday.
Gold declined by 3.94%, while the HUI declined by 13.89%. This means that gold stocks magnified gold’s decline by 3.53. In other words, the HUI Index declined approximately 250% more than gold.
If this remains in place and we expect gold to decline from $1,185 to $1,125 (by 5.06%), we can expect the HUI to decline by 250% more. This means a decline of 3.53 * 5.06% = 17.86%. Since the HUI closed at 143.25, this means a move to 117.67.
Considering yesterday’s very bad performance of mining stocks, we might need to adjust the above even further.
Gold’s July 31st closing price was $1,233.60, and it closed at $1,184 yesterday.
The HUI’s July 31st closing price of July was 166.36, and it closed at 138.98 yesterday.
Gold declined by 4.02%, while the HUI declined by 16.46%. This means that gold stocks magnified gold’s decline by 4.09. In other words, the HUI Index declined approximately 310% more than gold.
If this remains in place and we expect gold to decline from $1,184 to $1,125 (by 4.98%), we can expect the HUI to decline by 310% more. This means a decline of 4.09 * 4.98% = 20.37%. Since the HUI closed at 138.98, this means a move to 110.67.
It’s now clear that the 2015 lows are definitely something that could realistically be reached if gold continues to move lower. And it’s likely to move lower.
The failed attempt to move higher in the GDX ETF definitely confirms the bearish outlook.
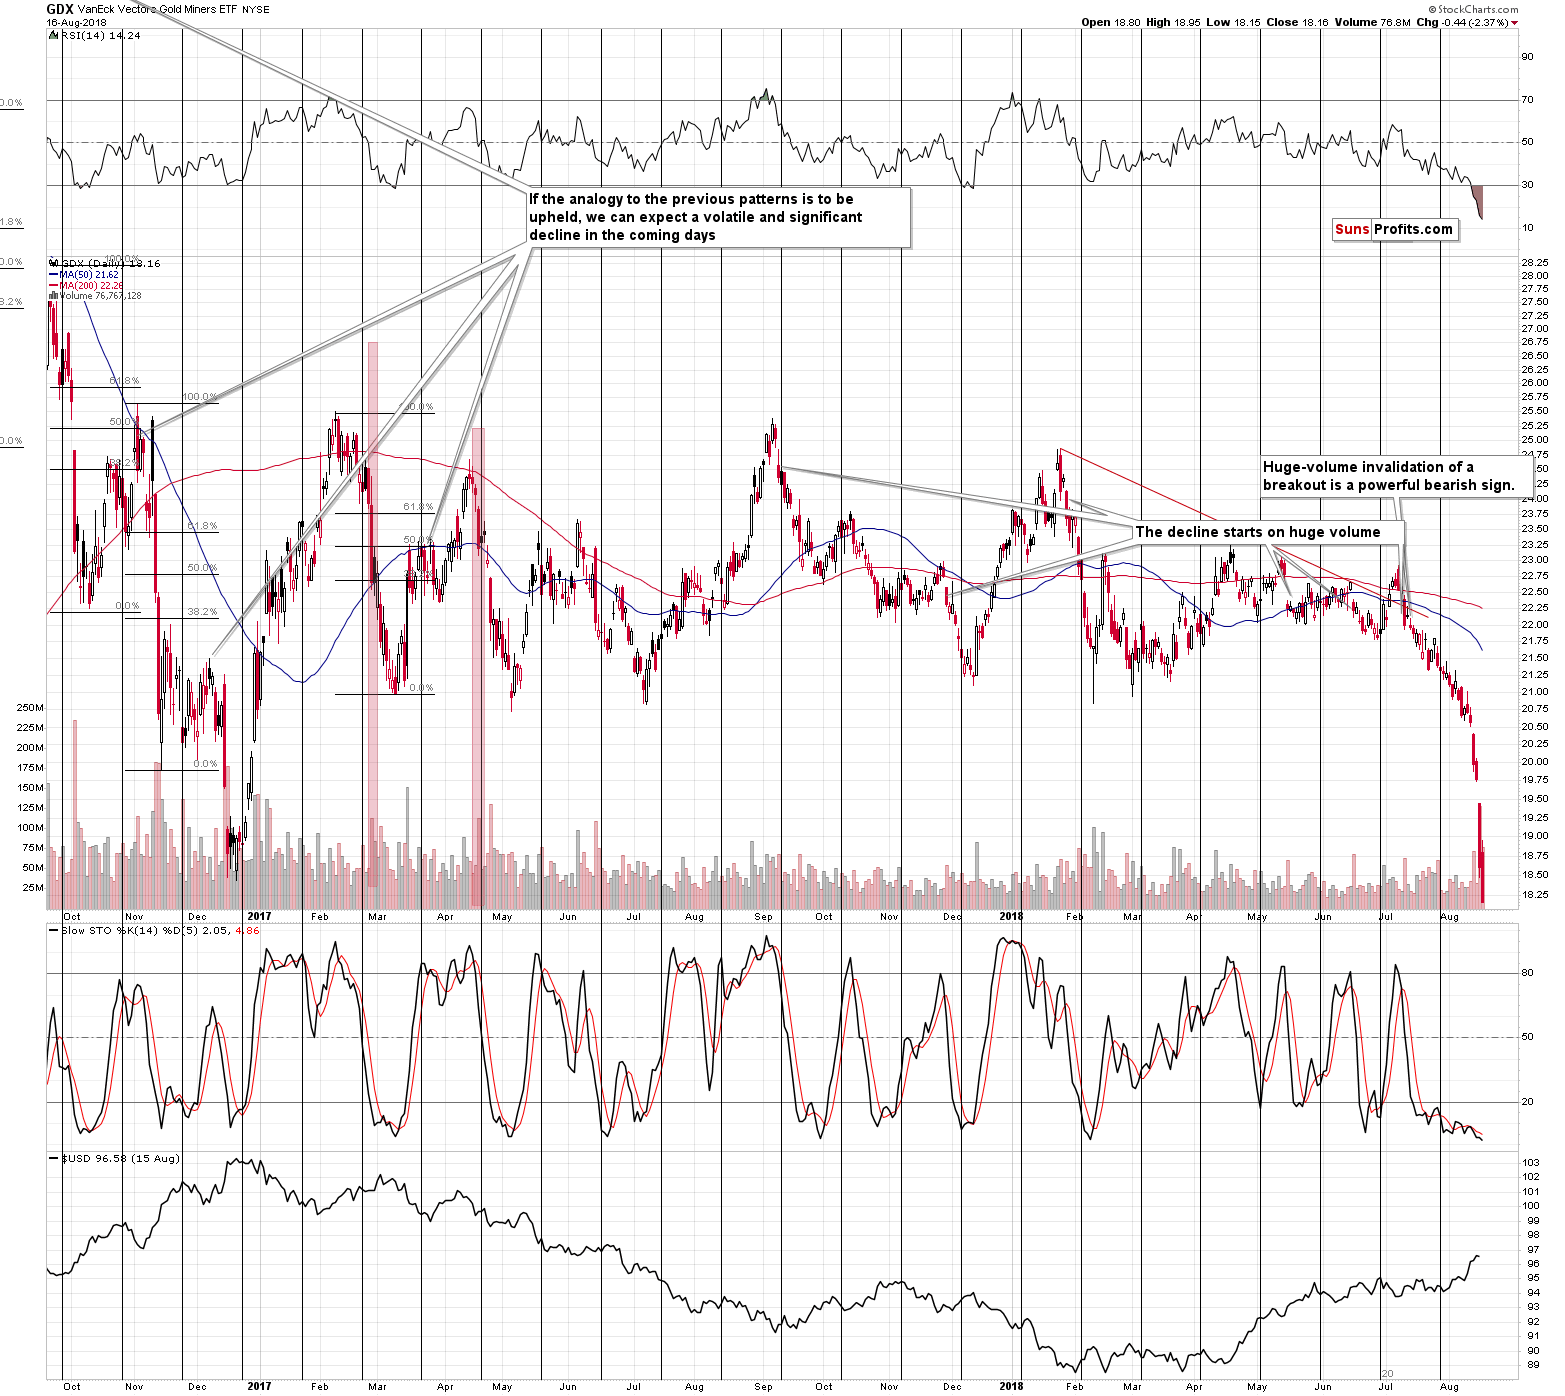
In yesterday’s Alert, we wrote the following:
The GDX ETF is also after a breakdown. It just closed below the December 2016 low in terms of the daily closing prices and the breakdown took place on strong volume. The implications are clearly bearish, even though we might see a move back to the December 2016 low before the slide continues.
The move higher was very brief, and it was quickly invalidated and followed by a move to new lows. The weakness in mining stocks is truly breathtaking.
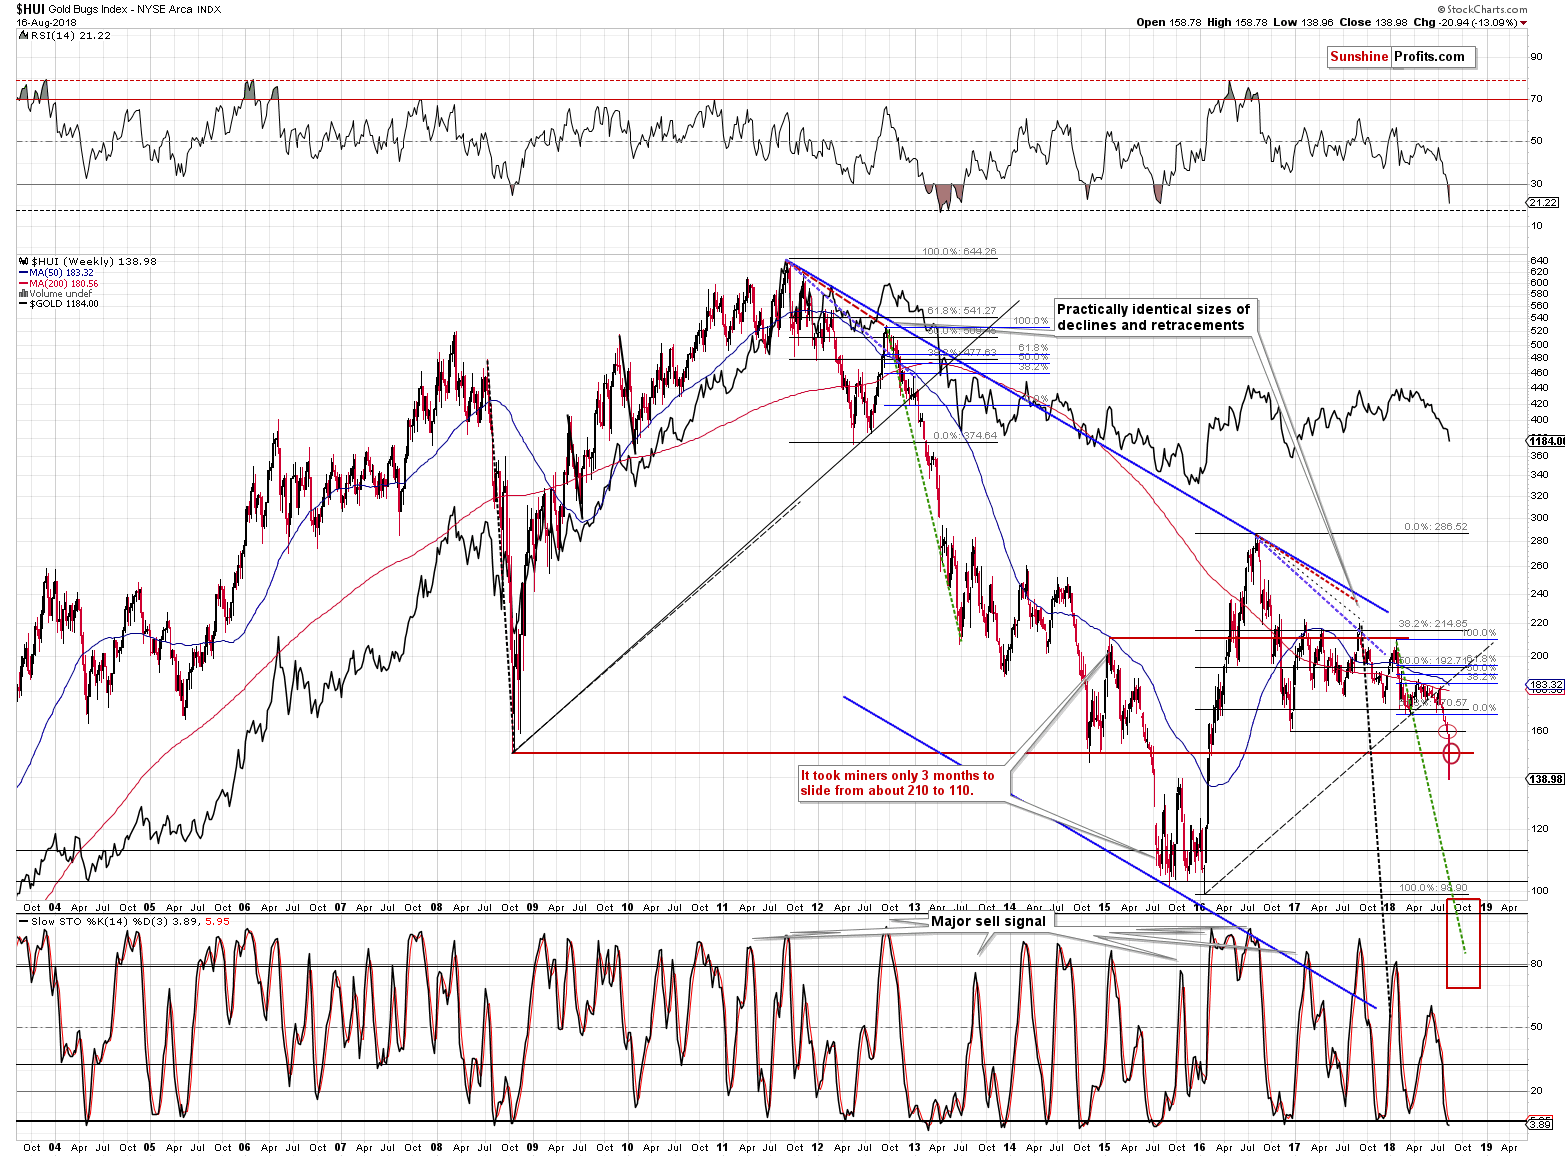
Some may still say the RSI indicator is so oversold that a rally is almost certain from the current levels. That’s not true and the following chart shows why.
The current decline is very similar to what we saw in 2015. They both started from similar index values, in both cases the HUI Index declined in a rather regular manner and in both cases this changed after the breakdown. The freefall followed in July 2015 and in August 2018. Back in 2015, the RSI moved to about 10, but it didn’t mean the end of the decline. It meant that the pace of decline slowed, but overall gold stocks kept on falling for another 2 weeks. Consequently, just because the RSI moved close to 10, it doesn’t mean that we’ll see a rally shortly, or that the upcoming bottom will be the final one. Conversely, we are likely to see lower mining stock values shortly.
Summary
Summing up, there are multiple very meaningful reasons (for instance yesterday’s outperformance of silver and underperformance of mining stocks) due to which the precious metals sector is likely to move lower in the following weeks and months and this week’s declines show that the slide has already begun. In other words, it seems that our sizable profits on the short positions are going to become even bigger shortly. We may have a local bottom later this month, though, and we’ll keep you informed regarding the possibility of seeing a bigger turnaround.
At the same time, it’s important to keep the very long-term picture in mind. We have recently published our report on gold’s long-term upside targets and if you haven’t read it so far, we suggest that you do so today. You can read more about our long-term upside target for gold here.
On a different note, we would like to remind you that it is still possible to subscribe to our services using the lifetime subscription type. This means no more price increases, no hassle with updating card details and no risk of disrupting the access to our service. And it’s cheaper over the very long run. The profits on the current position (and in this year overall) are likely huge and the above might be a very good way to re-invest the gains in the signals that contributed to them. If you’re interested, please contact us for details.
As always, we’ll keep you – our subscribers – informed.
To summarize:
Trading capital (supplementary part of the portfolio; our opinion): Full short positions (250% of the full position) in gold, silver and mining stocks are justified from the risk/reward perspective with the following stop-loss orders and exit profit-take price levels:
- Gold: profit-take exit price: $1,062; stop-loss: $1,221; initial target price for the DGLD ETN: $82.96; stop-loss for the DGLD ETN $54.27
- Silver: profit-take exit price: $12.72; stop-loss: $15.56; initial target price for the DSLV ETN: $46.97; stop-loss for the DSLV ETN $28.87
- Mining stocks (price levels for the GDX ETF): profit-take exit price: $13.12; stop-loss: $20.81; initial target price for the DUST ETF: $80.97; stop-loss for the DUST ETF $30.87
Note: the above is a specific preparation for a possible sudden price drop, it does not reflect the most likely outcome. You will find more detailed explanation in our August 1 Alert. In case one wants to bet on junior mining stocks’ prices (we do not suggest doing so – we think senior mining stocks are more predictable in the case of short-term trades – if one wants to do it anyway, we provide the details), here are the stop-loss details and target prices:
- GDXJ ETF: profit-take exit price: $17.52; stop-loss: $30.72
- JDST ETF: initial target price: $154.97 stop-loss: $62.78
Long-term capital (core part of the portfolio; our opinion): No positions (in other words: cash)
Insurance capital (core part of the portfolio; our opinion): Full position
Important Details for New Subscribers
Whether you already subscribed or not, we encourage you to find out how to make the most of our alerts and read our replies to the most common alert-and-gold-trading-related-questions.
Please note that the in the trading section we describe the situation for the day that the alert is posted. In other words, it we are writing about a speculative position, it means that it is up-to-date on the day it was posted. We are also featuring the initial target prices, so that you can decide whether keeping a position on a given day is something that is in tune with your approach (some moves are too small for medium-term traders and some might appear too big for day-traders).
Plus, you might want to read why our stop-loss orders are usually relatively far from the current price.
Please note that a full position doesn’t mean using all of the capital for a given trade. You will find details on our thoughts on gold portfolio structuring in the Key Insights section on our website.
As a reminder – “initial target price” means exactly that – an “initial” one, it’s not a price level at which we suggest closing positions. If this becomes the case (like it did in the previous trade) we will refer to these levels as levels of exit orders (exactly as we’ve done previously). Stop-loss levels, however, are naturally not “initial”, but something that, in our opinion, might be entered as an order.
Since it is impossible to synchronize target prices and stop-loss levels for all the ETFs and ETNs with the main markets that we provide these levels for (gold, silver and mining stocks – the GDX ETF), the stop-loss levels and target prices for other ETNs and ETF (among other: UGLD, DGLD, USLV, DSLV, NUGT, DUST, JNUG, JDST) are provided as supplementary, and not as “final”. This means that if a stop-loss or a target level is reached for any of the “additional instruments” (DGLD for instance), but not for the “main instrument” (gold in this case), we will view positions in both gold and DGLD as still open and the stop-loss for DGLD would have to be moved lower. On the other hand, if gold moves to a stop-loss level but DGLD doesn’t, then we will view both positions (in gold and DGLD) as closed. In other words, since it’s not possible to be 100% certain that each related instrument moves to a given level when the underlying instrument does, we can’t provide levels that would be binding. The levels that we do provide are our best estimate of the levels that will correspond to the levels in the underlying assets, but it will be the underlying assets that one will need to focus on regarding the signs pointing to closing a given position or keeping it open. We might adjust the levels in the “additional instruments” without adjusting the levels in the “main instruments”, which will simply mean that we have improved our estimation of these levels, not that we changed our outlook on the markets. We are already working on a tool that would update these levels on a daily basis for the most popular ETFs, ETNs and individual mining stocks.
Our preferred ways to invest in and to trade gold along with the reasoning can be found in the how to buy gold section. Additionally, our preferred ETFs and ETNs can be found in our Gold & Silver ETF Ranking.
As a reminder, Gold & Silver Trading Alerts are posted before or on each trading day (we usually post them before the opening bell, but we don't promise doing that each day). If there's anything urgent, we will send you an additional small alert before posting the main one.
=====
Latest Free Trading Alerts:
Nine years. That’s how old is our current economic expansion. Is it enough? Do expansions die of old age? We invite you to read our today’s article about the 109 months of economic prosperity and find out whether we are on the verge of the next recession.
Foreigners. They are always plotting. This time, they hit Turkey. And gold at the same time. Will Erdogan save the country and support the yellow metal?
Will Erdogan Save Turkey and Help Gold?
=====
Hand-picked precious-metals-related links:
PRECIOUS-Gold nudges up, but set for biggest weekly fall in 15 months
Gold Seen Fighting Back in Battle With Dollar for Haven Role
=====
In other news:
Trump Changes Tune on Dollar After Talking Down the Currency
Turkish lira tumbles 7 percent to dollar on sanction worries
Kremlin plays down rouble drop, says Russian economy and finances stable
Growing trade risks may soon sour foreign appetite for Asian bonds
BOJ may be 'stealth tapering' in stock markets, analysts say
Euro zone inflation confirmed above ECB target in July
Can Turkey rewrite the rulebook for crises in emerging markets?
Oil heads for weekly loss on economic growth concerns
Dorado: Australia's biggest oil discovery this century
=====
Thank you.
Sincerely,
Przemyslaw Radomski, CFA
Founder, Editor-in-chief, Gold & Silver Fund Manager
Gold & Silver Trading Alerts
Forex Trading Alerts
Oil Investment Updates
Oil Trading Alerts

