

Briefly: in our opinion, full (300% of the regular position size) speculative short positions in junior mining stocks are justified from the risk/reward point of view at the moment of publishing this Alert. Moreover, while I see very little chance of those levels behind hit, I’m adding stop-loss orders for our current short positions. Since I’m placing them below the entry levels, they are effectively profit-protect orders. In other words, we are locking-in part of the profits, while letting them grow even more.
Welcome to this week's flagship Gold & Silver Trading Alert. Predicated on last week’s price moves, our most recently featured outlook remains the same as the price moves align with our expectations. On that account, there are parts of the previous analysis that didn’t change at all in the earlier days, which will be written in italics.
Our short position in junior miners is already very profitable, but it seems that the profits will grow even more, before we see a short-term reversal.
Let’s start today’s analysis with a recap of what recently happened on the fundamental front.
In short, the carnage continued on Wall Street, as gold declined by 0.56%, silver by 1.86% and the GDX ETF by 3.73% (7.69% so far this week). Moreover, with the GDXJ ETF also declining by 3.73% (10.06% so far this week) and the S&P 500 falling by 0.88%, the junior miners underperformed the general stock market once again. As a result, the developments are profoundly bearish.
In addition, while the USD Index retreated by 0.37%, the dollar basket remains in an uptrend and should seek higher ground over the medium term.
The Weekly Fundamental Roundup
While the week began with short squeezes and renewed optimism, the pension fund rebalance trade ended in ruins. Moreover, with commodities cratering and the GDXJ ETF following suit, our short position continues to produce profits. Likewise, with panic over inflation morphing into recession fears, lower lows for commodities, the S&P 500 and the GDXJ ETF should be on the horizon.
For example, the Atlanta Fed released its latest GDPNow estimate on Jun. 30, and the forecast has ominous implications for financial assets.
Please see below:
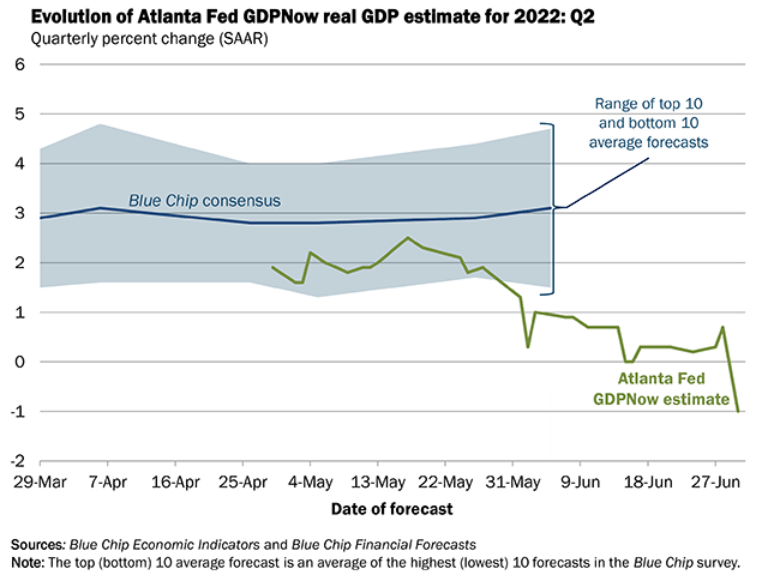
To explain, the blue line above tracks the Blue Chip (investment banks) second-quarter GDP growth estimate, while the green line above tracks the Atlanta Fed’s forecast. If you analyze the right side of the chart, you can see that the GDPNow estimate has sunk to -1%. As a result, the Atlanta Fed expects a second consecutive economic contraction in Q2, which would amount to a technical recession.
Furthermore, economic confidence has evaporated, and this points to more pain for risk assets in the coming months.
Please see below:
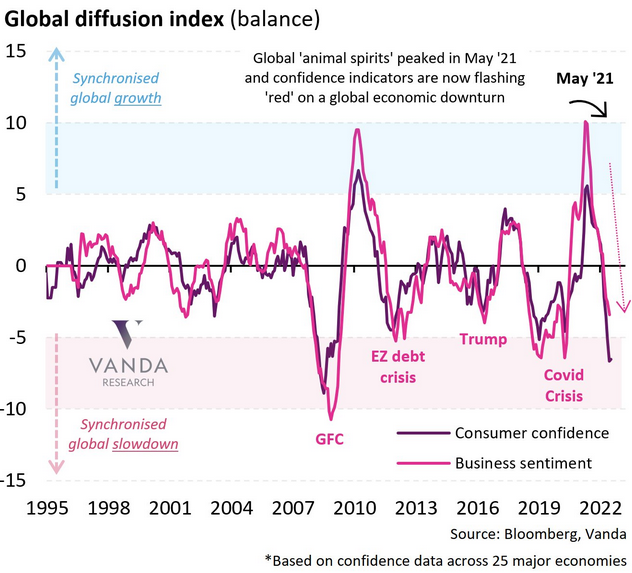
To explain, the purple line above tracks global consumer confidence, while the pink line above tracks global business sentiment. If you analyze the right side of the chart, you can see that the former is near the GFC lows, while the latter isn’t far behind. Moreover, when you add unanchored inflation and a hawkish Fed to the equation – dynamics that weren’t present from 2010 to 2020 – the medium-term fundamental outlook is even more precarious.
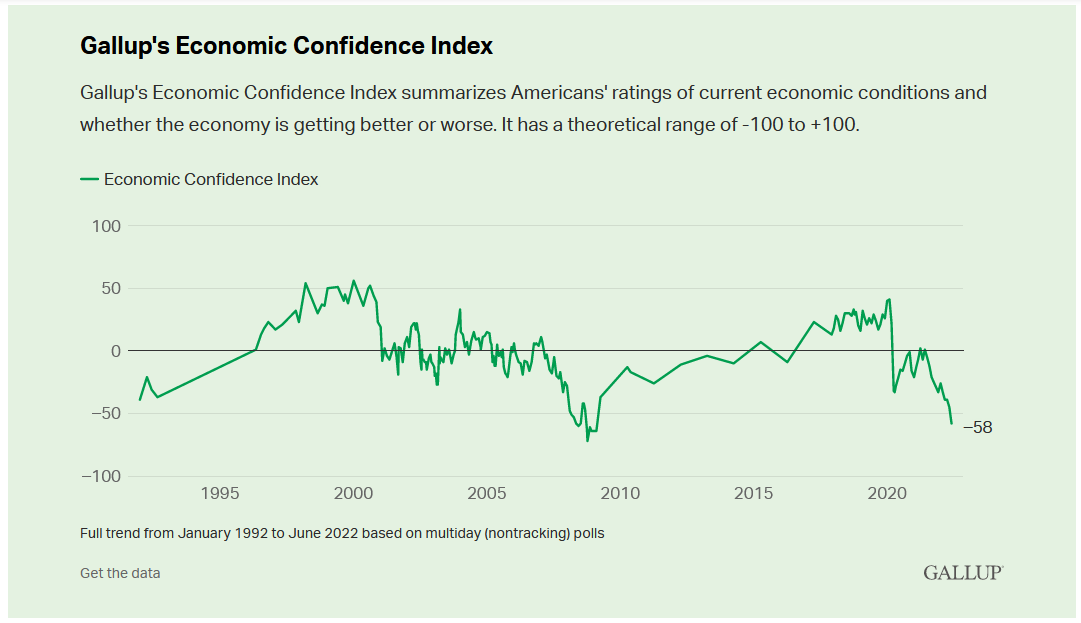
As further evidence, Gallup released its latest economic survey on Jun. 28. The report revealed:
“As gas prices have become more burdensome for Americans, their view of the U.S. economy has continued to dim, as indicated by Gallup's Economic Confidence Index (ECI). The index, which is a summary of Americans' ratings of current economic conditions and outlook for the economy, has sunk 13 points over the past month to -58....
“Today's -58 ECI score represents a substantially negative skew in public opinion about the economy and is the lowest measured since a -64 reading in February 2009. At the time, the country was still embroiled in the 2007-2009 recession and confidence was starting to recover after hitting the all-time low of -72 in October 2008.”
Please see below:
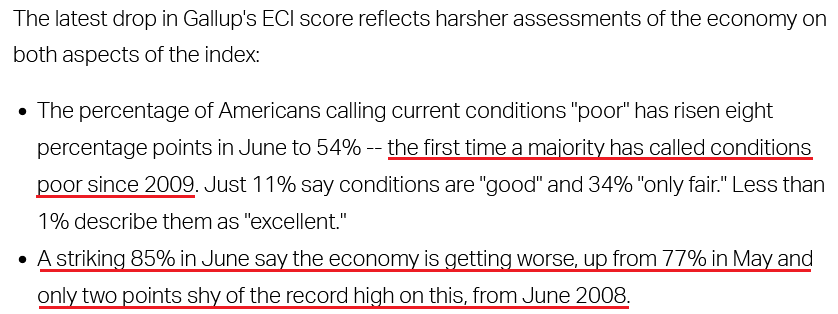
Also noteworthy:
“Currently, 40% of U.S. adults mention some aspect of the economy when asked to name the country's chief problem, including 18% mentioning the high cost of living or inflation and 5% citing gas prices explicitly. Another 13% say the economy in general is the top problem, and 1% say it's the "recession" among a handful of other aspects of the economy mentioned by no more than 1% for each.”
As a result, the U.S. economic outlook continues to dwindle at a time when the Fed is nowhere near solving its inflation conundrum. Thus, with officials stuck between a rock (weakening growth) and a hard place (unanchored inflation), plenty of fundamental fireworks should erupt over the next few months.
 Source: Gallup
The Jobs Divergence
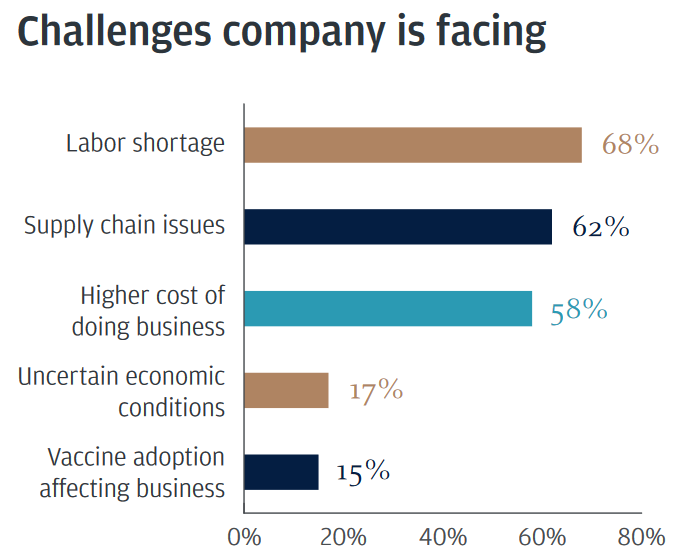
While sentiment and economic growth have faltered, the U.S. labor market remains robust. As a result, the inflation and employment outlook should keep the Fed’s foot on the hawkish accelerator. To explain, JPMorgan released its 2022 Business Leaders Outlook report on Jun. 29. For context, more than 1,500 executives across midsize businesses with annual sales of $20 million to $500 million were surveyed. An excerpt read:
“More than two-thirds (68%) of midsize business leaders said finding workers is their biggest challenge.”
Please see below:
 Source: JPMorgan
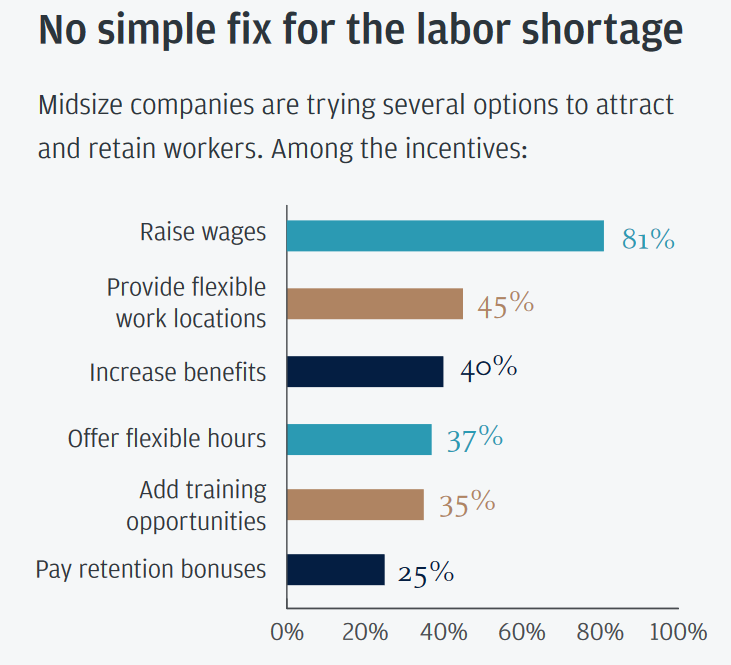
In addition, with respondents claiming “the worker shortage is the biggest challenge they’re facing,” 81% noted that wage increases are the primary solution. As a result, the data adds fuel to the hawkish fire.
Please see below:
 Source: JPMorgan
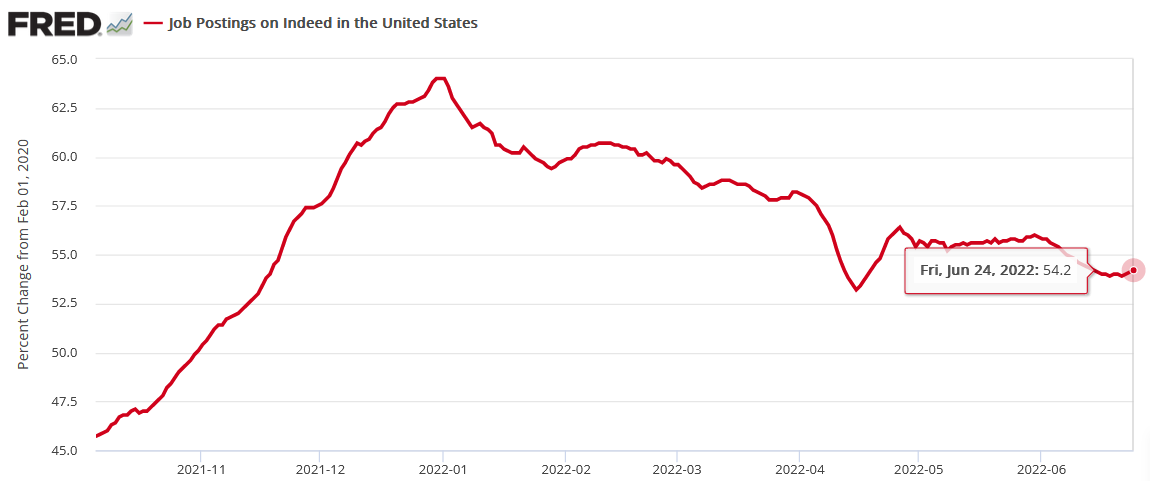
Furthermore, Indeed released its June 2022 Labor Market Update on Jun. 30. Moreover, while the researchers encouraged readers to “keep an eye on layoffs,” they noted that current “layoffs are near a multi-decade low.”
Please see below:
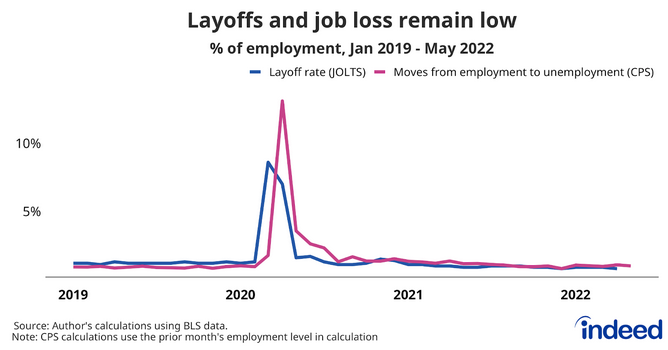
Therefore, while a recession may tilt the scale in an ominous direction, the current environment is much more optimistic. For example, the report stated:
“The U.S. labor market remains hot. As the US economy has bounced back from the initial COVID-19 shock, demand for labor has grown much more quickly than supply. Employment has rebounded, wages are growing quickly, and joblessness is approaching pre-pandemic levels.”
Moreover:
“Employer demand for workers remains strong, with Indeed job postings as of June 24, 2022 54.2% above their pre-pandemic baseline. New job postings, defined as those on Indeed for seven days or less, are also well above their pre-pandemic baseline, up 68.3%. While job postings growth has slowed, the leveling out has been moderate.”
Please see below:
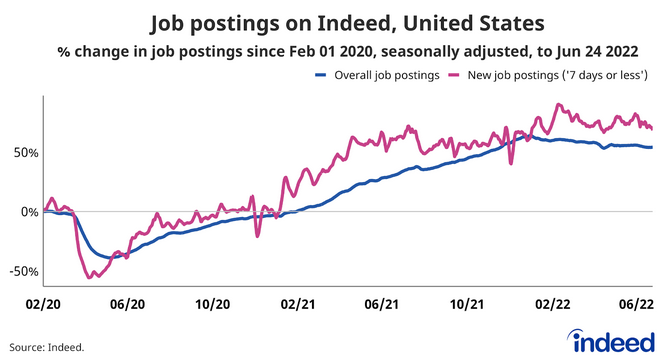
Thus, while the report highlights that “the labor market is showing some signs of normalizing as demand cools, supply increases and wage growth levels off,” the important point is that the deceleration has been limited. As a result, the Fed has room to amplify its hawkish policy without destroying the U.S. labor market.
Moreover, the Fed needs the blue line above to decline to restore the supply/demand imbalance and curb wage inflation. Thus, we’re likely far from the kind of labor catastrophe that would elicit a dovish pivot.
To that point, when Indeed updated its job postings data on Jun. 30, the metric increased from its recent low of 53.9%. Thus, while the Fed has hiked interest rates six times in 2022 (25 basis point increments), the damage has been minimal.
Please see below:
To explain, the red line above is a zoomed-in version of the blue line from the preceding Indeed chart. If you analyze the left side of the chart, you can see that the job openings percentage increase peaked at 64% in January 2022. Moreover, the metric has been in a downtrend since the Fed turned hawkish. However, with the metric increasing from 53.9% to 54.2%, there were more job openings on Indeed for the week ended Jun. 24 than the prior week. As a result, if the U.S. labor market remains resilient, the outlook for Fed policy is bullish.
PMIs Point to More Rate Hikes
While the hyper-inflationists assumed that the Fed couldn’t stomach higher interest rates, I’ve long warned that unanchored inflation is the most important fundamental issue, with the U.S. labor market a close second. Therefore, sputtering growth isn’t enough for the Fed to back off.
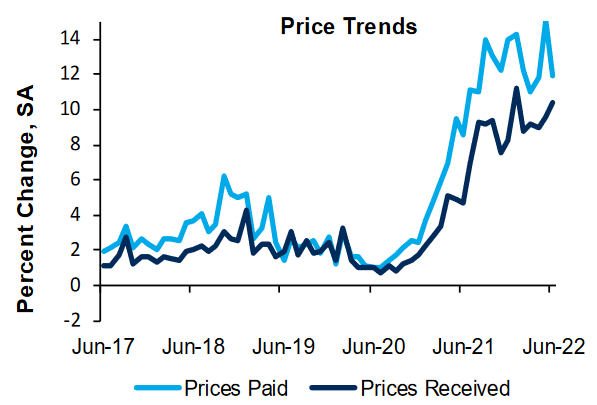
To that point, the Richmond Fed released its Fifth District Survey of Manufacturing Activity on Jun. 30. The headline index declined from -9 in May to -11 in June, as recessionary conditions were present.
However, “the employment index rose from 8 in May to 16 in June, and while “the average growth rate of prices paid decreased somewhat… firms reported higher average growth in prices received.”
Please see below:
 Source: Richmond Fed
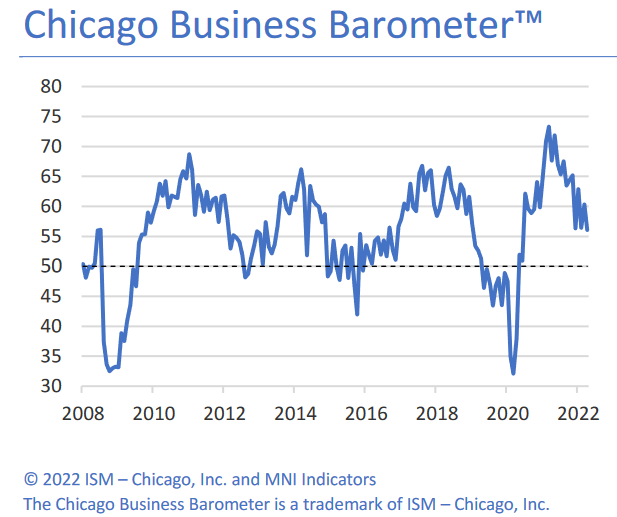
Likewise, the Institute for Supply Management (ISM) released its Chicago Business Barometer on Jun. 30. The headline index “tumbled to the lowest since August 2020 in June, giving back last month’s recovery.”
However, “All main indicators decreased except for employment, which hit the highest level since November 2021.”
Therefore, while growth fared better in Chicago than Richmond, inflation and employment point to more hawkish policy in the coming months.
The Bottom Line
With the Fed’s catch-22 on full display, the growth-inflation conundrum pulls officials in competing directions. However, with Chairman Jerome Powell rightfully emphasizing that a recession that kills inflation is preferable to a hyper-inflationary collapse, prudent medicine for the U.S. economy is profoundly bearish for the S&P 500 and the GDXJ ETF.
Moreover, while I warned in April that investors’ inflation expectations were in la-la land, the U.S. 10-Year breakeven inflation rate continued its free fall on Jun. 30. Thus, with the GDXJ ETF following suit, fundamental realities have caught up to liquidity-fueled assets.
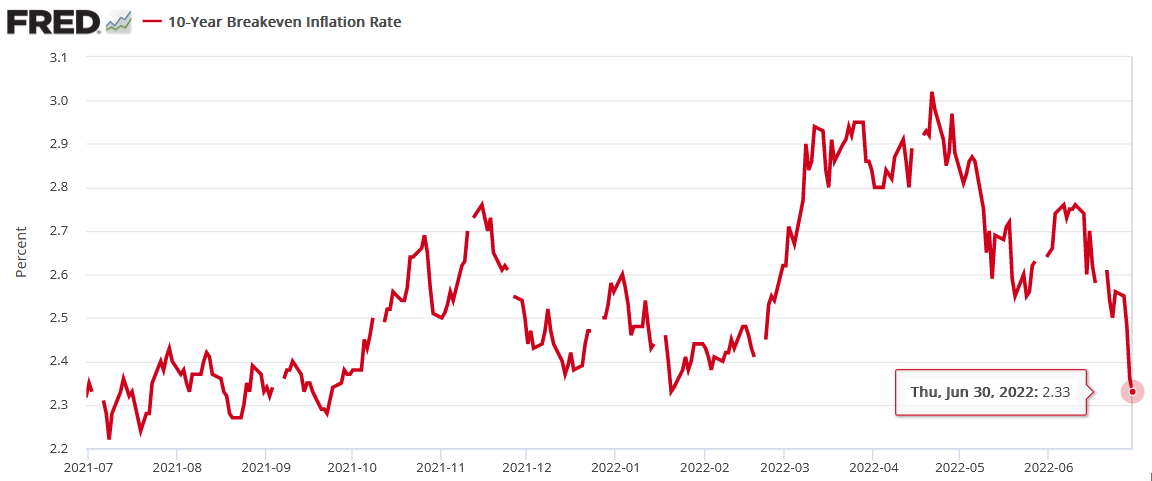
In conclusion, the PMs declined on Jun. 30, as downside volatility has accelerated across many asset classes. Moreover, while some progress has been made, there is still more work to do to normalize inflation. As a result, more rate hikes should be on the horizon, and the main beneficiaries are the USD Index and U.S. real yields, not the PMs.
What to Watch for Next Week
With more U.S. economic data releases next week, the most important are as follows:
- Jul. 6: S&P Global Composite PMI, ISM Services PMI, JOLTS job openings
With S&P Global and the ISM’s data derived from nationwide surveys, the growth, employment and inflation results will be early indicators of future government data. In addition, while the JOLTS data lags by a month, it’s prudent to ensure the government report confirms the results from Indeed and business surveys.
- Jul. 8: Nonfarm payrolls, average hourly earnings
Maximum employment is one-half of the Fed’s dual mandate, so a decent payrolls report should keep officials hawked up. Likewise, average hourly earnings will shed more light on wage inflation.
All in all, economic data releases impact the PMs because they impact monetary policy. Moreover, if we continue to see higher employment and inflation, the Fed should keep its foot on the hawkish accelerator. If that occurs, the outcome is profoundly bearish for the PMs.
Technically Speaking
Let’s start today’s technical discussion with a quick check on copper prices.
Practically, everything that I wrote about it last week remains up-to-date:
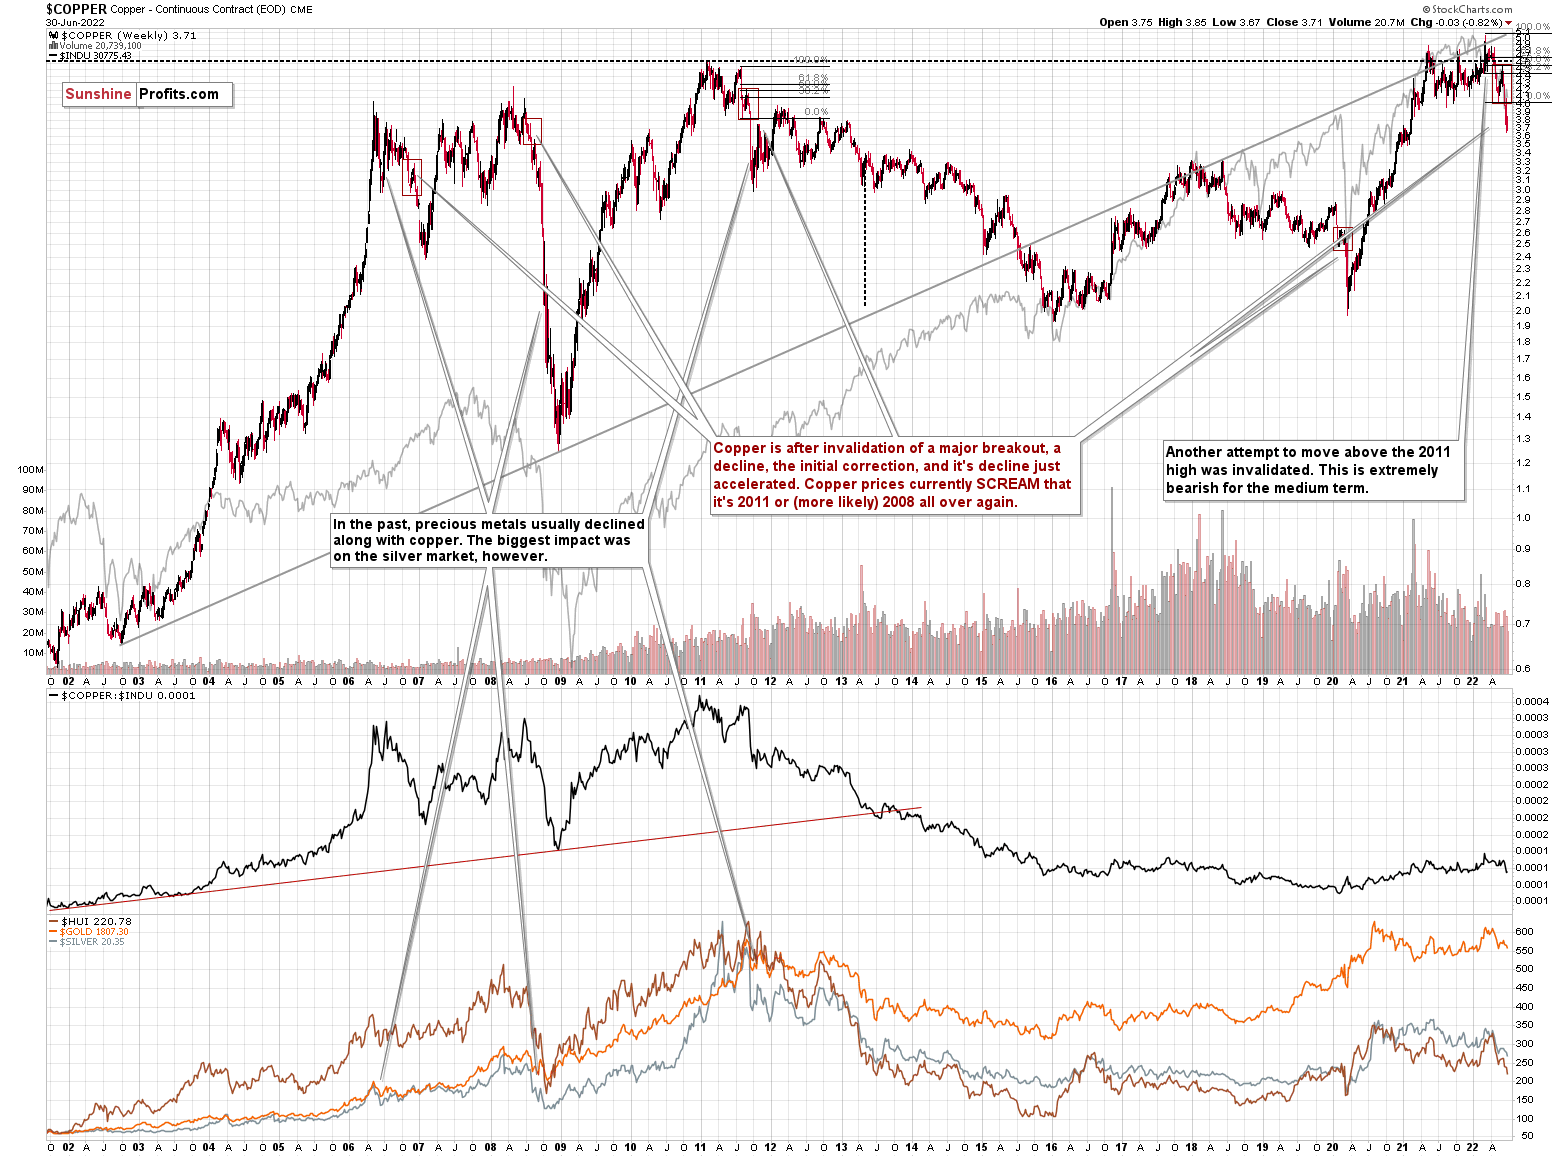
Copper recently CLEARLY invalidated another attempt to move above its 2011 high. This is a very strong technical sign that copper (one of the most popular commodities) is heading lower in the medium term.
The interest rates are going up, just like they did before the 2008 slide. What did copper do before the 2008 slide? It failed to break above the previous (2006) high, and it was the failure of the second attempt to break higher that triggered the powerful decline. What happened then? Gold declined, but silver and mining stocks truly plunged.
Again, copper is after invalidation of a major breakout, a decline, the initial correction, and it's decline just accelerated. Copper prices currently SCREAM that it's 2011 or (more likely) 2008 all over again. This is extremely bearish for mining stocks (especially juniors) and silver.
Consequently, what we saw recently is just a confirmation of the bearish analogy.
Having said that, let’s check junior miners’ really big picture.
I previously commented on the above chart in the following way:
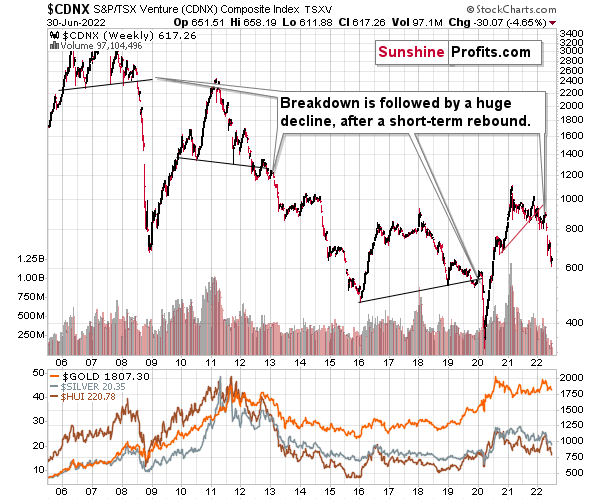
The Toronto Stock Exchange Venture Index includes multiple junior mining stocks. It also includes other companies, but juniors are a large part of it, and they truly plunged in 2008.
In fact, they plunged in a major way after breaking below their medium-term support lines and after an initial corrective upswing. Guess what – this index is after a major medium-term breakdown and a short-term corrective upswing. It’s likely ready to fall – and to fall hard.
So, what’s likely to happen? We’re about to see a huge slide, even if we don’t see it within the next few days.
The index corrected just like the PMs, but it didn’t change anything with regard to the medium term.
What has happened recently?
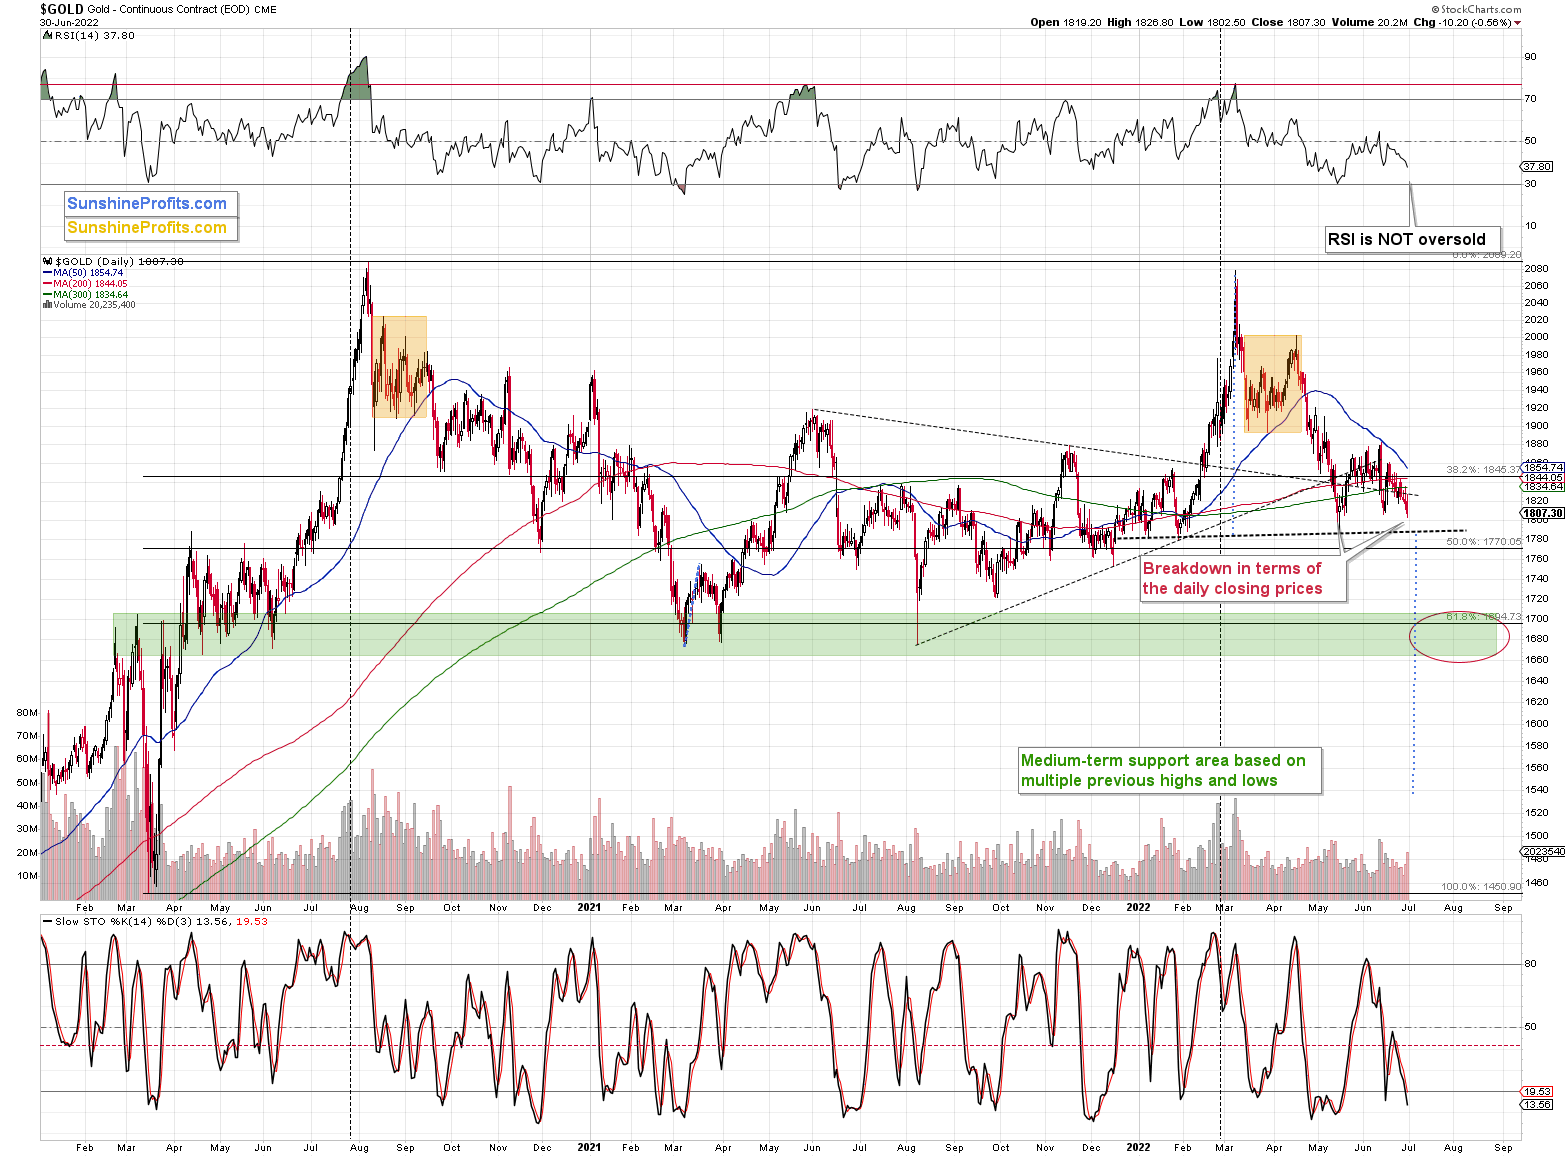
Gold just broke below the May 2022 low in terms of the closing prices. While it might not appear to be a big deal at the first glance – it is. And the fact that gold is already down by about $10 in today’s pre-market trading (so far) appears to confirm the bearishness of yesterday’s development.
Now, once gold declines more and confirms a breakdown below ~$1,790 (the neck line of the head and shoulders pattern that I marked with a dashed line), we’ll have yet another indication that gold is moving lower in the following weeks.
This will be a big deal also from another point of view. Remember when gold price started to climb due to the pre-war tensions in the first part of this year (and when I told you that this rally was likely unsustainable)? Well, the war continues to take place and gold is practically back to where it was before the topic even became popular. Silver and mining stocks are already below those analogous levels. A decline in gold that’s so big that it takes it below the pre-war-tension levels will be a crystal-clear sign for many investors and traders that gold is indeed about to fall hard.
At the moment of writing these words, gold futures are trading just ~$5 above the above-mentioned neck level, so this breakdown could be easily achieved shortly.
The next short-term target area for gold is close to (mostly below) the $1,700 level. So, yes, I think that a ~$100 slide in gold price is just around the corner. In fact, it might already be underway.
Why do I think that gold would drop that low and then correct? Because that’s where we have really strong support and consequently, if gold gets there in a fast manner (which is likely given the situation in the USD Index), it’s likely to rebound. That’s how strong support levels work.
Why would this support area be so strong? Because of two primary reasons:
- That’s where gold topped and bottomed multiple times (approximately there). This means that many people will think that gold will rally strongly once again given similar set of circumstances and… They are likely to be right… For a while – and just for a while.
- That’s where we have the all-important 61.8% Fibonacci retracement level based on the 2020 rally. If we based this retracement on the 2020-2022 rally, it would be very close, anyway.
Also, please note that gold tends to reverse its course when the RSI indicator based on it moves either to 30 or somewhat below it. It’s not there yet, so it seems that gold’s decline has more room to run. Still, the odds are that once gold is indeed at or below $1,700, the RSI indicator based on it will already be at 30 or below it, thus flashing a short-term buy signal.
Before looking at mining stocks, let’s take a look at gold from a broader point of view.
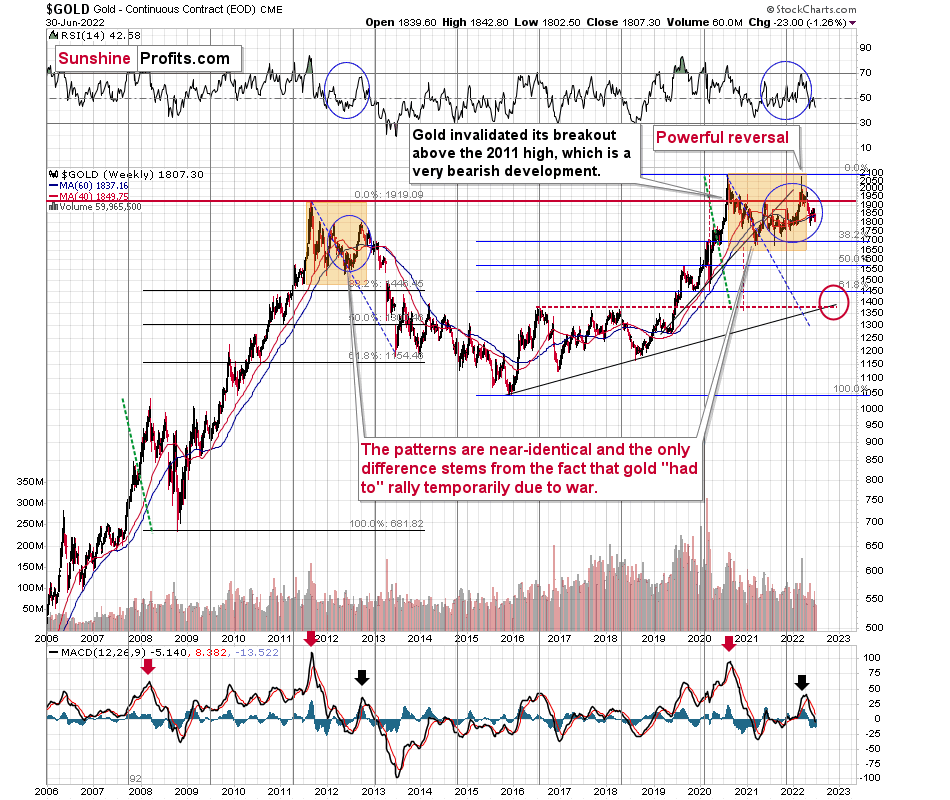
Let’s keep in mind that between 2020 and now, quite a lot happened, quite a lot of money was printed, and we saw a war breaking out in Europe. Yet, gold failed to rally to new highs.
In fact, it’s trading very close to its 2011 high, which tells you something about the strength of this market. It’s almost absent.
Truth be told, what we see in gold is quite in tune with what we saw after the 2011 top, and in particular, shortly after the 2012 top. The long-term gold price chart below provides details.
Please note that the 38.2% Fibonacci retracement based on the entire 2015-2020 rally is very close to $1,700, which makes the above-mentioned support area even stronger.
It seems that if it weren’t for the war in Europe, gold wouldn’t have been able to move above $2,000 and instead it would have topped close to its previous highs, which provided strong resistance.
The extraordinary thing about that is that that’s exactly what happened in 2012. Gold moved higher but only until it reached its previous highs, which happened in the second half of 2012.
This time the RSI was a bit higher, but it was close to 70, just like what we saw in 2012.
Yes, this time gold moved back to the previous high, but:
- This happened as a result of a geopolitical event (the war in Europe) and geopolitically-driven rallies are generally unsustainable;
- When gold reached its previous highs, it also formed a profound weekly reversal, which formed on huge volume, and that’s very bearish.
So, the current medium-term outlook for gold is very bearish.
There are also very interesting short-term takeaways from the above chart.
If the 2012-2013 is currently being replayed (at least to a significant extent), then let’s not forget that this decline initially took the shape of a back-and-forth decline with lower lows and lower highs (but there were notable short-term rallies within the decline).
One of those counter-trend rallies took place when gold touched its 40- and 60-week moving averages (marked with blue and red) in late 2012. The RSI was trading at about 50 at that time, and that’s more or less when we saw the clear sell signal from the MACD indicator (lower part of the above chart).
Let’s see how this applies to the current situation.
Basically, we saw the same thing. Gold has corrected, as it did in 2012. However, the correction didn’t last very long (it’s just a correction, after all).
Back then, it had ended a bit above the 40- and 60-week moving averages after the RSI moved back close to the 50 level (I mean the second rebound, not the first one). We’re seeing the same thing.
The difference now is that gold declined more in the short term before correcting, whereas back in 2012, it corrected twice. However, let’s not forget that this time the preceding rally was bigger (war tensions), so it’s no wonder that gold had more to correct in a shorter time. Consequently, it seems that the current correction is taking place “instead of” two 2012 corrections.
Anyway, after the correction was over, gold plunged, and the next rebound started once gold moved close to its previous medium-term lows. The analogous lows right now are the 2021 bottoms, which are below $1,700. That’s where I think gold is headed next.
Also, if the situation is now going to be more similar to what we saw in 2008, then we might expect gold to decline faster than in 2013. Silver and mining stocks are likely to be affected even more than gold, though.
Let’s take a look at the silver market.
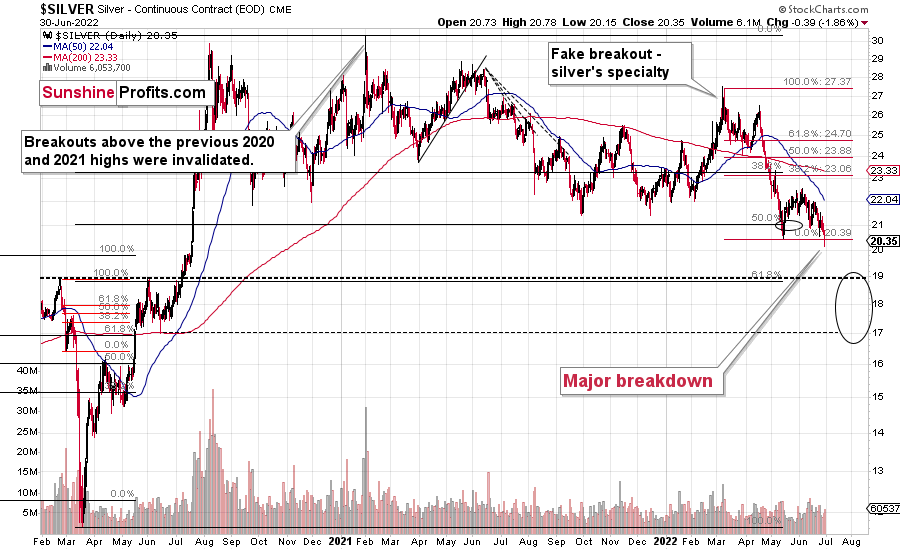
Silver just broke to new lows!
It’s also down by over $0.60 in today’s pre-market trading, which means that it’s trading below $20 for the first time since mid-2020.
This is a very bearish development, and a confirmation of the bearish indications from other charts.
There’s a strong support at about $19 as that’s where silver previously topped twice. However, based on how much gold is likely to fall, it seems unlikely that silver will be able to hold at about ~$19 for long. Instead, I expect it to move much lower. In the near term, the $17 level could prevent silver from declining without a short-term rally first.
However, if stocks (the S&P 500) slide, I wouldn’t rule out a situation in which the white metal declines even lower before correcting in a more visible manner. If silver doesn’t stop at $17, then $15 would be my next short-term target as that’s where it bottomed in May 2020.
As you see, the silver outlook is not as precise as it is for gold, as the support levels and targets based on multiple techniques don’t necessarily align. In case of gold, they do.
Fortunately, it’s very likely that the short-term correction in gold and silver (and miners) would start at more or less the same time. This means that when gold moves to its 2021 lows at about $1,700 or below it, then gold, silver, and mining stocks would be likely to correct. And monitoring what gold does will likely be more important for silver and mining stock traders/investors than monitoring those markets on their own.
Let’s not forget that gold is not the only precious metal that is repeating its 2012 performance right now, and you can see more details on silver’s long-term chart.
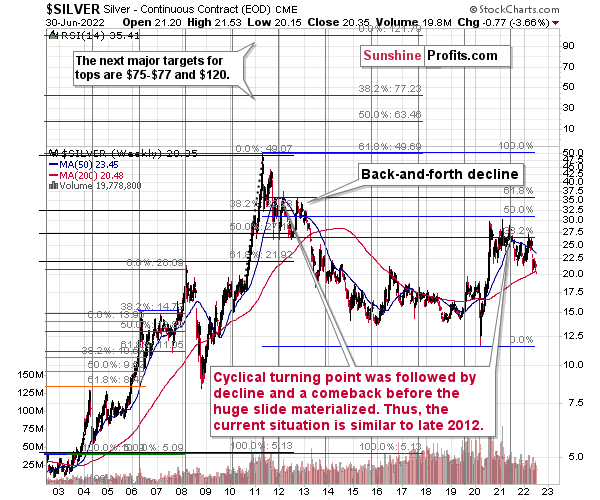
As you can see on the above chart, silver corrected about 50% of the previous downswing, and this correction ended at about $30, a long time ago. Ever since, silver has been declining, and even the outbreak of war in Europe didn’t make silver rally above that level.
On the above chart, you can see how silver first topped in 2011, then declined and formed another top at the cyclical turning point. Next, it declined once again – to the previous lows. After that, silver rallied (in 2012 and 2022), and it topped between its 50-week moving average (marked in blue) and the previous top. Now silver is declining in a back-and-forth manner (you can see it more clearly on the previous short-term silver chart).
Back in 2012, these were just the early days of a gargantuan decline, and the same appears likely to be the case this time. Interest rates are going up after all, and the Fed is determined to quench inflation.
Let’s not forget that rising interest rates are likely to negatively impact not just commodities, but practically all industries. This will likely cause silver’s price to decline profoundly, as silver’s industrial demand could be negatively impacted by lower economic growth (or a decline in economic activity).
Besides, please note that silver didn’t even manage to rally as much as copper (which tried to move to new highs recently) or most other commodities, thus being rather weak.
Consequently, it seems that silver will need to decline profoundly before it rallies (to new all-time highs) once again.
Having said that, let’s take a look at what happened in mining stocks.
Most importantly, let me emphasize that gold stocks are declining similarly to how they did in 2008.
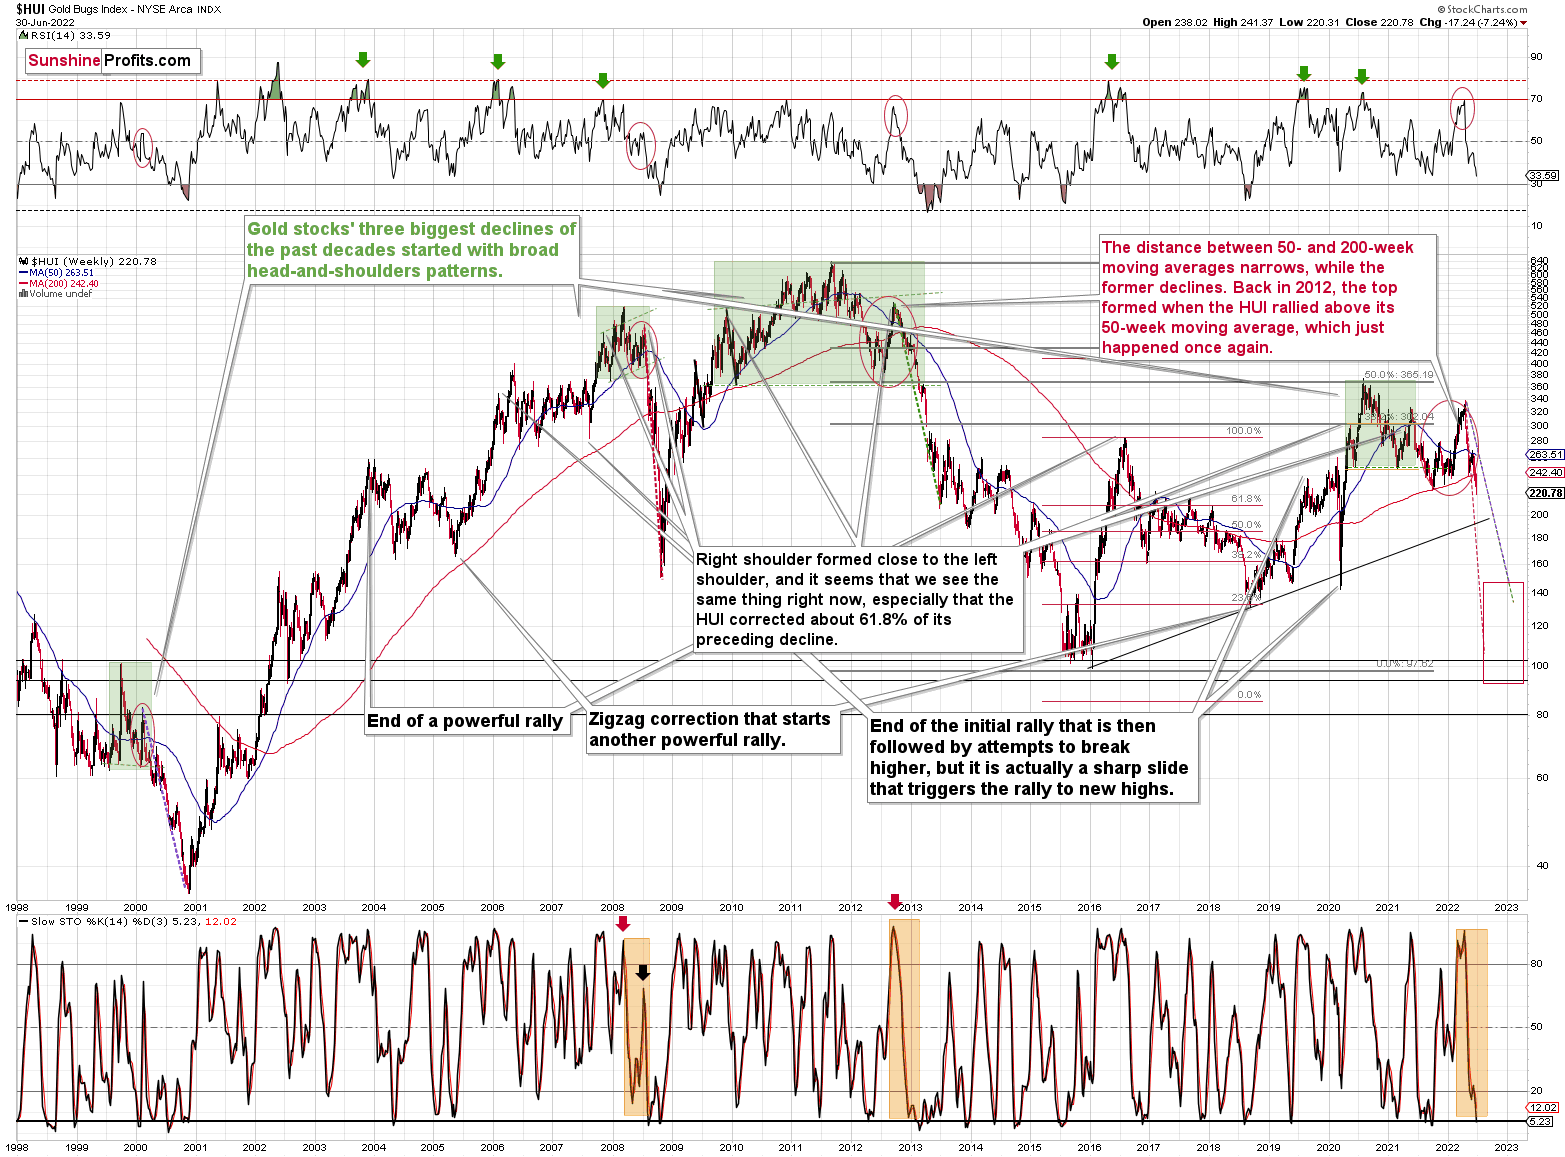
The Russian invasion triggered a rally, which was already more than erased, and if it wasn’t for it, the self-similarity would be very clear (note the head-and-shoulders patterns marked with green). Since the latter happened, it’s not as clear, but it seems that it’s still present. At least that’s what the pace of the current decline suggests.
I used a red dashed line to represent the 2008 decline, and I copied it to the current situation. They are very similar. We even saw a corrective upswing from more or less the 200-week moving average (red line), just like what happened in 2008.
We saw a breakdown to new short-term lows, which means that the volatile part of the slide is likely already underway.
Today’s decline in silver prices to new yearly lows definitely supports the above.
All right, let’s zoom in and see how mining stocks declined in 2008.

Back then, the GDXJ ETF was not yet trading, so I’m using the GDX ETF as a short-term proxy here.
The decline took about 3 months, and it erased about 70% of the miners’ value. The biggest part of the decline happened in the final month, though.
However, the really interesting thing about that decline – that might also be very useful this time – is that there were five very short-term declines that took the GDX about 30% lower.
I marked those declines with red rectangles. After that, a corrective upswing started. During those corrective upswings, the GDX rallied by 14.8-41.6%. The biggest corrective upswing (where GDX rallied by 41.6%) was triggered by a huge rally in gold, and since I don’t expect to see anything similar this year, it could be the case that this correction size is an outlier. Not paying attention to the outlier, we get corrections of between 14.8% and 25.1%.
The interesting thing was that each corrective upswing was shorter (faster) than the preceding one.
The first one took 12 trading days. The second one took seven trading days. The third one took 2 trading days, and the fourth and final one took just 1 trading day.
Fast forward to the current situation. Let’s take a look at the GDXJ ETF.
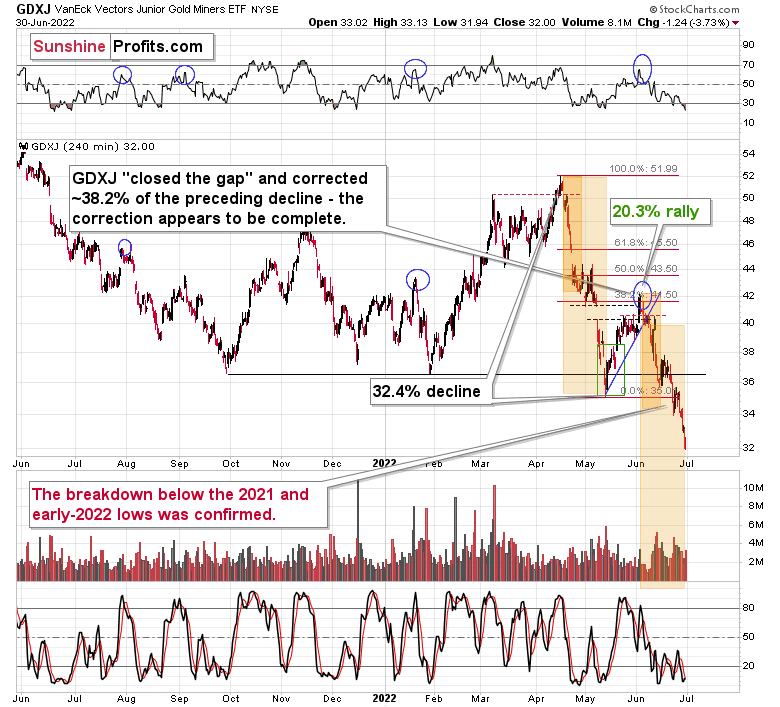
The GDXJ ETF declined by 32.4% and then corrected – it rallied by about 20.3%. The corrective upswing took 14 trading days.
The above is in perfect tune with the previous patterns seen in the GDX during the 2008 slide.
What does it tell us? It indicates that history can be rhymed, and while it will not be identical, we should pay attention to the indicators that worked in 2008. The next corrective upswing (a notable one, that is) might start when the GDXJ ETF declines by about 29-35% from its recent top. To clarify, I don’t claim that the above technique would be able to detect all corrective upswings, or that I aim to trade all of them. For instance, in my view, it was a good idea to enter a long position on May 12 and switch to a short position on May 26, but I wasn’t aiming to catch the intraday moves.
GDXJ could also decline a bit more than 29-35%, as let’s keep in mind that previous statistics are based on the GDX ETF and we are discussing the GDXJ here, and the latter is likely to decline even more than GDX as juniors are more correlated with the general stock market (and the latter is likely to slide).
So, let’s say that the GDXJ might decline between 29% and 40% from the recent high before triggering another notable corrective upswing (one that could take between 5 and 10 trading days based on how long the last one took and how big those corrections were in 2008).
The recent high was formed with the GDXJ ETF at $42.19. Applying the above-mentioned percentages to this price provides us with $24.78-29.32. And yes, the above would be likely to take place along with a big decline in gold prices.
Now, is there any meaningful support level in this area that could stop the decline?
Yes!
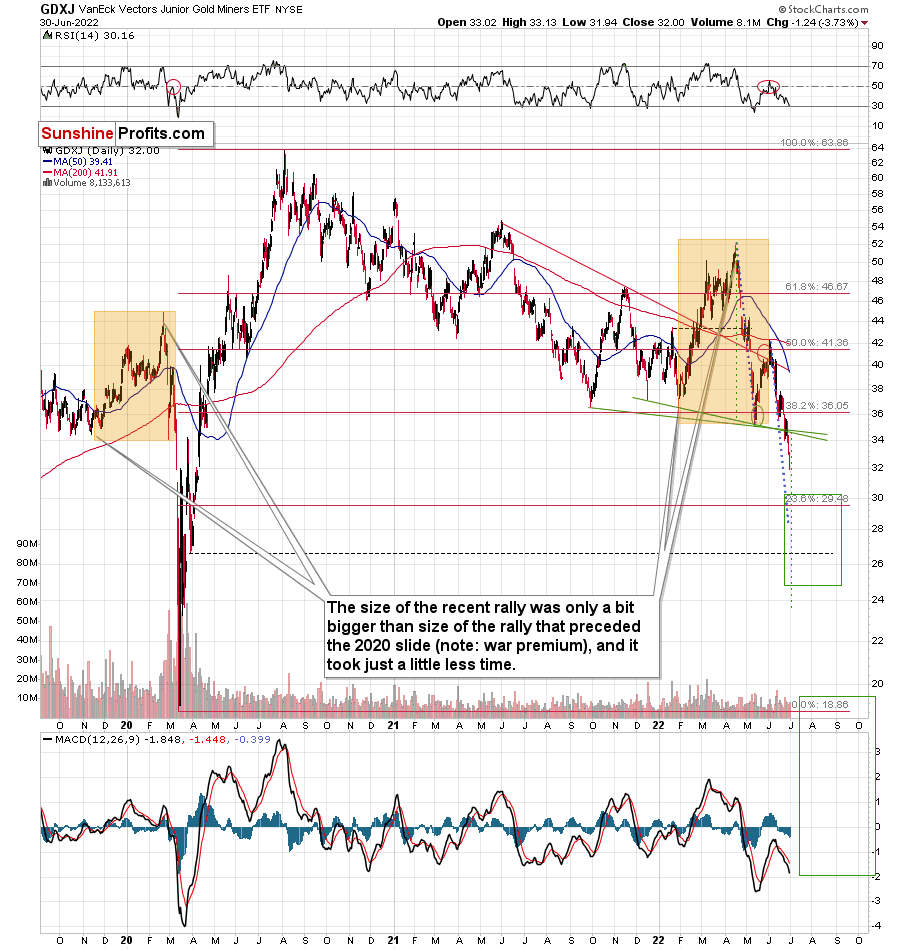
The late-March 2020 low is at $26.62, and it provides significant short-term support within the analogy-based target area.
Additionally, the above corresponds – more or less – to the size of the decline that would match the size of the April-May decline. It would be only somewhat bigger.
Let’s keep in mind that gold stocks don’t necessarily move on their own, but rather move along with gold. So, if gold moves to its strong medium-term support provided by the 2021 lows and then starts a brief rally, the same action would be likely in mining stocks.
The head and shoulders pattern confirms that the downside target is well below $30, perhaps even as low as ~$24.
There’s also an additional detail present on GDXJ’s very short-term chart.
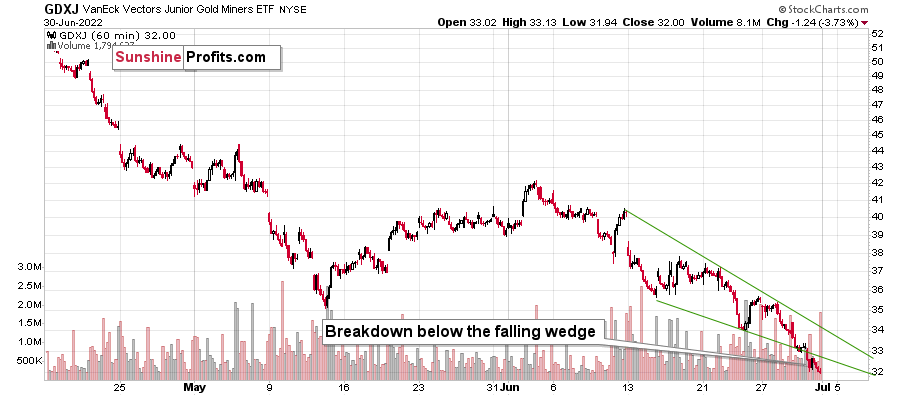
The GDXJ just broke below the declining wedge. While falling wedges are usually a bullish sign, they only become such after a break to the upside. What we witnessed was a relatively uncommon occurrence: a breakdown on the downside. The implications are therefore bearish instead of being bullish, and the profit potential for the current short position remains enormous.
Also, with regard to the analogy to 2008 in the GDX – remember GDX’s tendency to correct after declining by about 30%?
So far the GDX ETF declined by just 18.47% from its early-June high. Consequently, it seems that junior mining stocks have much further to fall, especially if gold is about to slide to $1,700 or slightly below it.
Given this week’s weakness in junior mining stocks relative to gold, we can’t even rule out a situation in which the GDXJ declines all the way down to its 2020 lows (at about $20) while gold declines a bit below $1,700. Note – I’m not saying that it’s the most likely outcome, but I’m saying that it’s not out of the question. It will be critical to monitor what gold does while juniors keep sliding.
Also, let’s not forget about the forest while looking at individual trees. By that, I mean looking at how gold stocks perform relative to gold. That’s one of the major indications that the current situation is just like what we saw at the 2012 top.
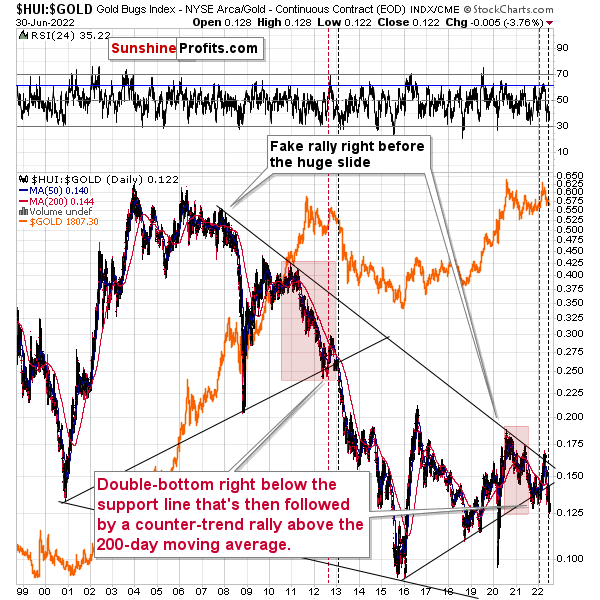
The situation in the gold stock to gold ratio is similar to what we saw in late 2012 and early 2013. The HUI to gold ratio invalidated its first attempt to break lower (marked with red, dashed lines), but after a corrective upswing, it then broke lower more decisively. That’s what I marked using black, dashed lines.
If the history is to rhyme, we’re about to see a profound decline.
Also, please note that the pattern that we currently see, which started in early 2016, is somewhat similar to what happened between 2003 and 2008.
Back in 2008, the breakdown from the consolidation resulted in sharply lower ratio values and much lower prices of gold stocks.
So, if the situation is analogous to 2012-2013, we’re likely to see a big decline in the following weeks/months, and if it’s analogous to 2008, we’re likely to see an enormous decline in the following weeks/months.
Declining stock prices would only add fuel to the bearish fire (after all, gold stocks are… stocks) and that’s exactly what’s likely to happen.
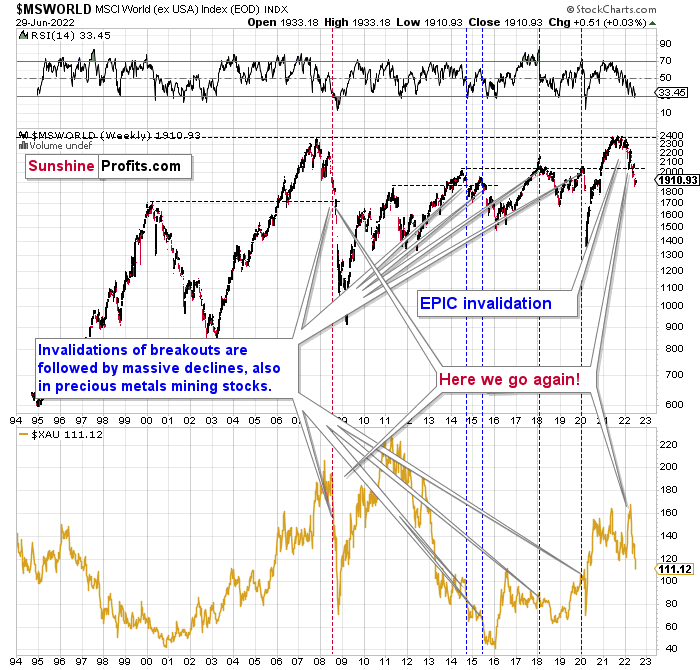
The technical picture in the case of world stocks remains extremely bearish, and my previous comments on it were just confirmed. Here’s what I’ve been writing about the above chart for quite a few weeks now:
World stocks have already begun their decline, and based on the analogy to the previous invalidations, the decline is not likely to be small. In fact, it’s likely to be huge.
For context, I explained the ominous implications on Nov. 30. I wrote:
Something truly epic is happening in this chart. Namely, world stocks tried to soar above their 2007 high they managed to do so, and… failed to hold the ground. Despite a few attempts, the breakout was invalidated. Given that there were a few attempts and that the previous high was the all-time high (so it doesn’t get more important than that), the invalidation is a truly critical development.
It's a strong sell signal for the medium - and quite possibly for the long term.
From our – precious metals investors’ and traders’ – point of view, this is also of critical importance. All previous important invalidations of breakouts in world stocks were followed by massive declines in mining stocks (represented by the XAU Index).
Two of the four similar cases are the 2008 and 2020 declines. In all cases, the declines were huge, and the only reason why they appear “moderate” in the lower part of the above chart is that it has a “linear” and not a “logarithmic” scale. You probably still remember how significant and painful (if you were long, that is) the decline at the beginning of 2020 was.
Now, all those invalidations triggered big declines in the mining stocks, and we have “the mother of all stock market invalidations” at the moment, so the implications are not only bearish, but extremely bearish.
World stocks have declined below their recent highs, and when something similar happened in 2008, it meant that both stocks and gold and silver mining stocks (lower part of the chart) were about to slide much further.
The medium-term implications for mining stocks are extremely bearish.
Let’s take a look at the U.S. stock market.
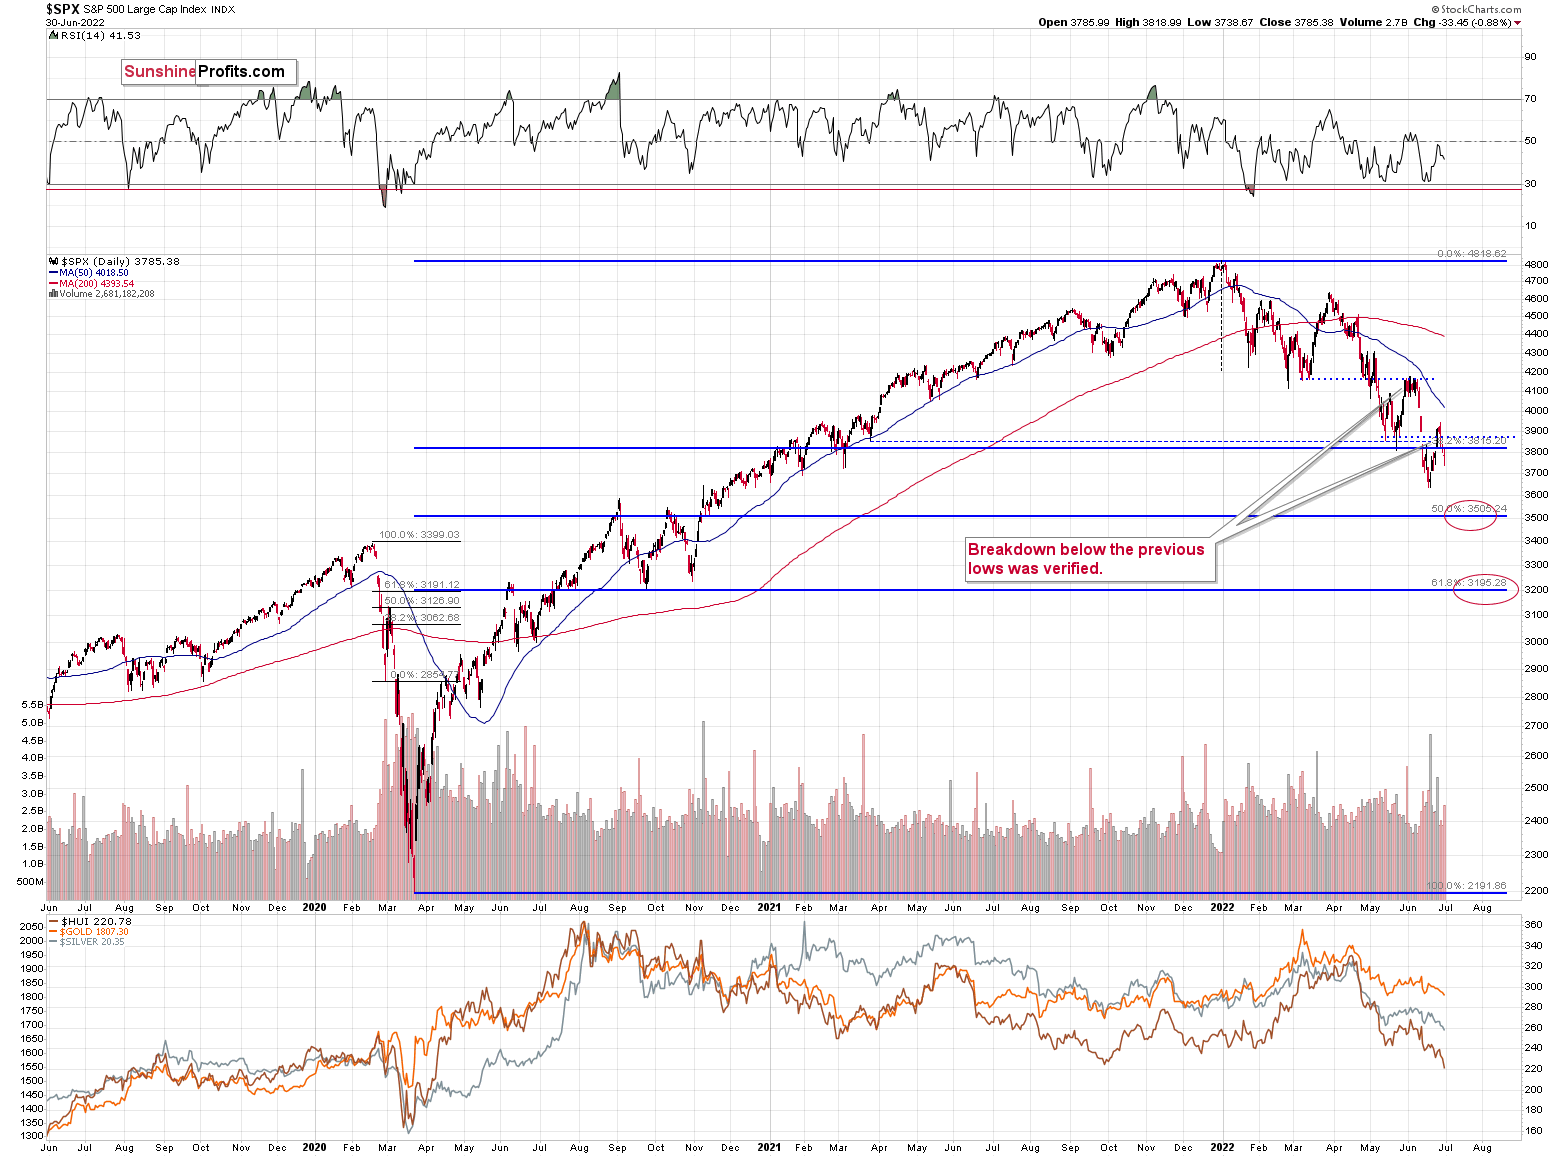
Stocks verified their breakdown below the Q1 2022 low and then they declined. They broke below the May low, and they corrected a bit after the rate hike announcement. They rallied slightly back above the previous low, but were not able to confirm this breakout.
Consequently, the trend remains down, and lower lows are to be expected.
Where will the next short-term bottom for stocks be? Given that the 50% Fibonacci retracement is relatively close to the previous lows (and I’m think that stocks will move to new lows soon), it could be the case that stocks will bounce only after moving to the lower retracement – the 61.8% one, which is close to 3,200.
The implications for the precious metals market, especially for silver and mining stocks, are very bearish.
From a broader point of view, let’s keep in mind what happened in the previous cases when stocks declined profoundly – in early 2020 and in 2008. Miners and silver declined in a truly epic manner, and yes, the same is likely to take place in the following months, as markets wake up to the reality, which is that the USD Index and real interest rates are going up.
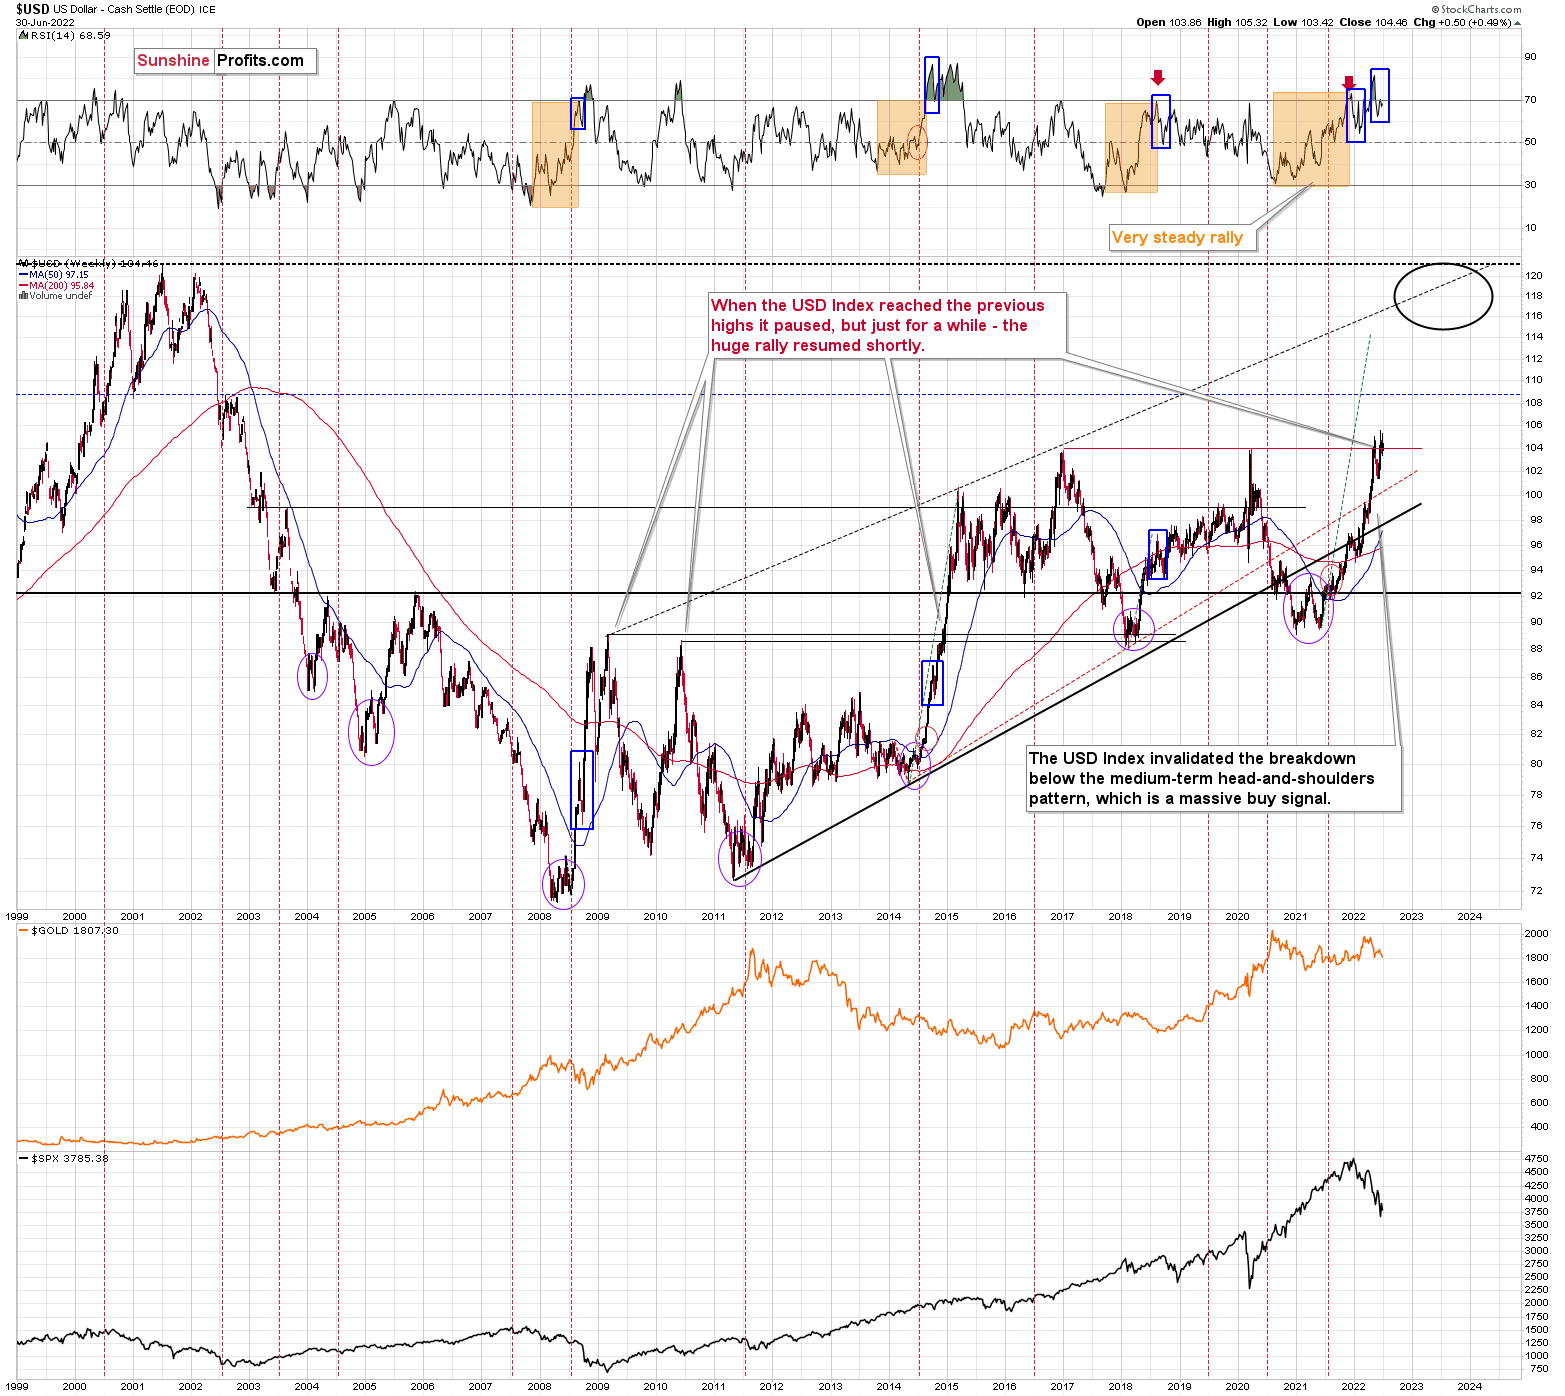
Speaking of the USD Index, after invalidating the breakout below the multi-year head-and-shoulders pattern, the USDX was poised to soar, just like I’ve been expecting it to do for more than a year, and that’s exactly what it did.
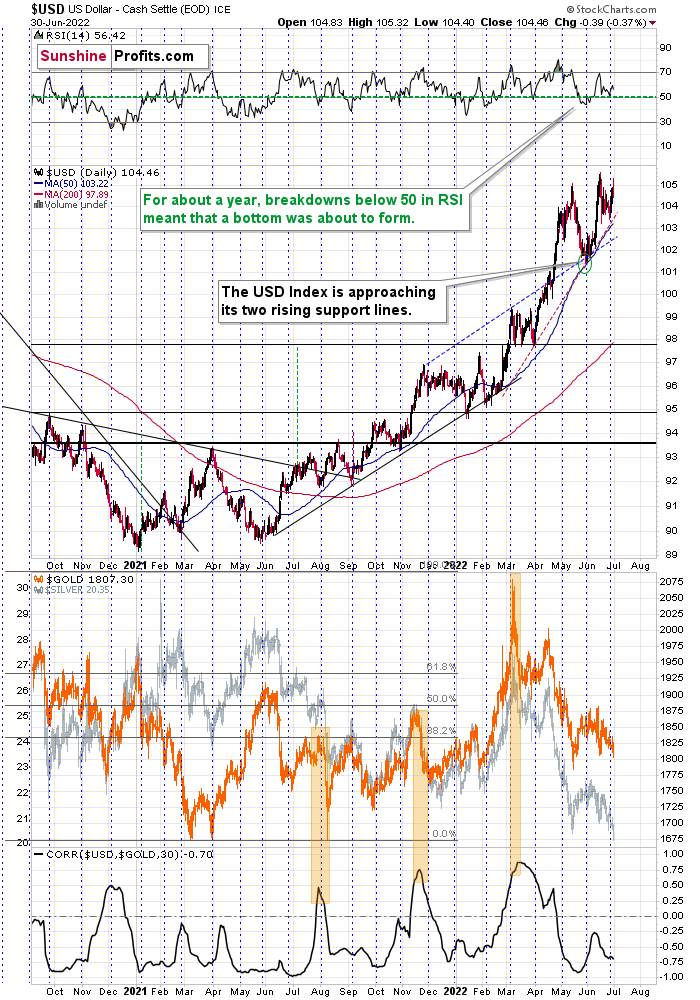
The RSI is currently slightly below 70, but since the USDX is in a medium-term rally and is already after a visible correction, it can rally further. Please note that we saw the same thing in 2008 and 2014. I marked the corrections with blue rectangles.
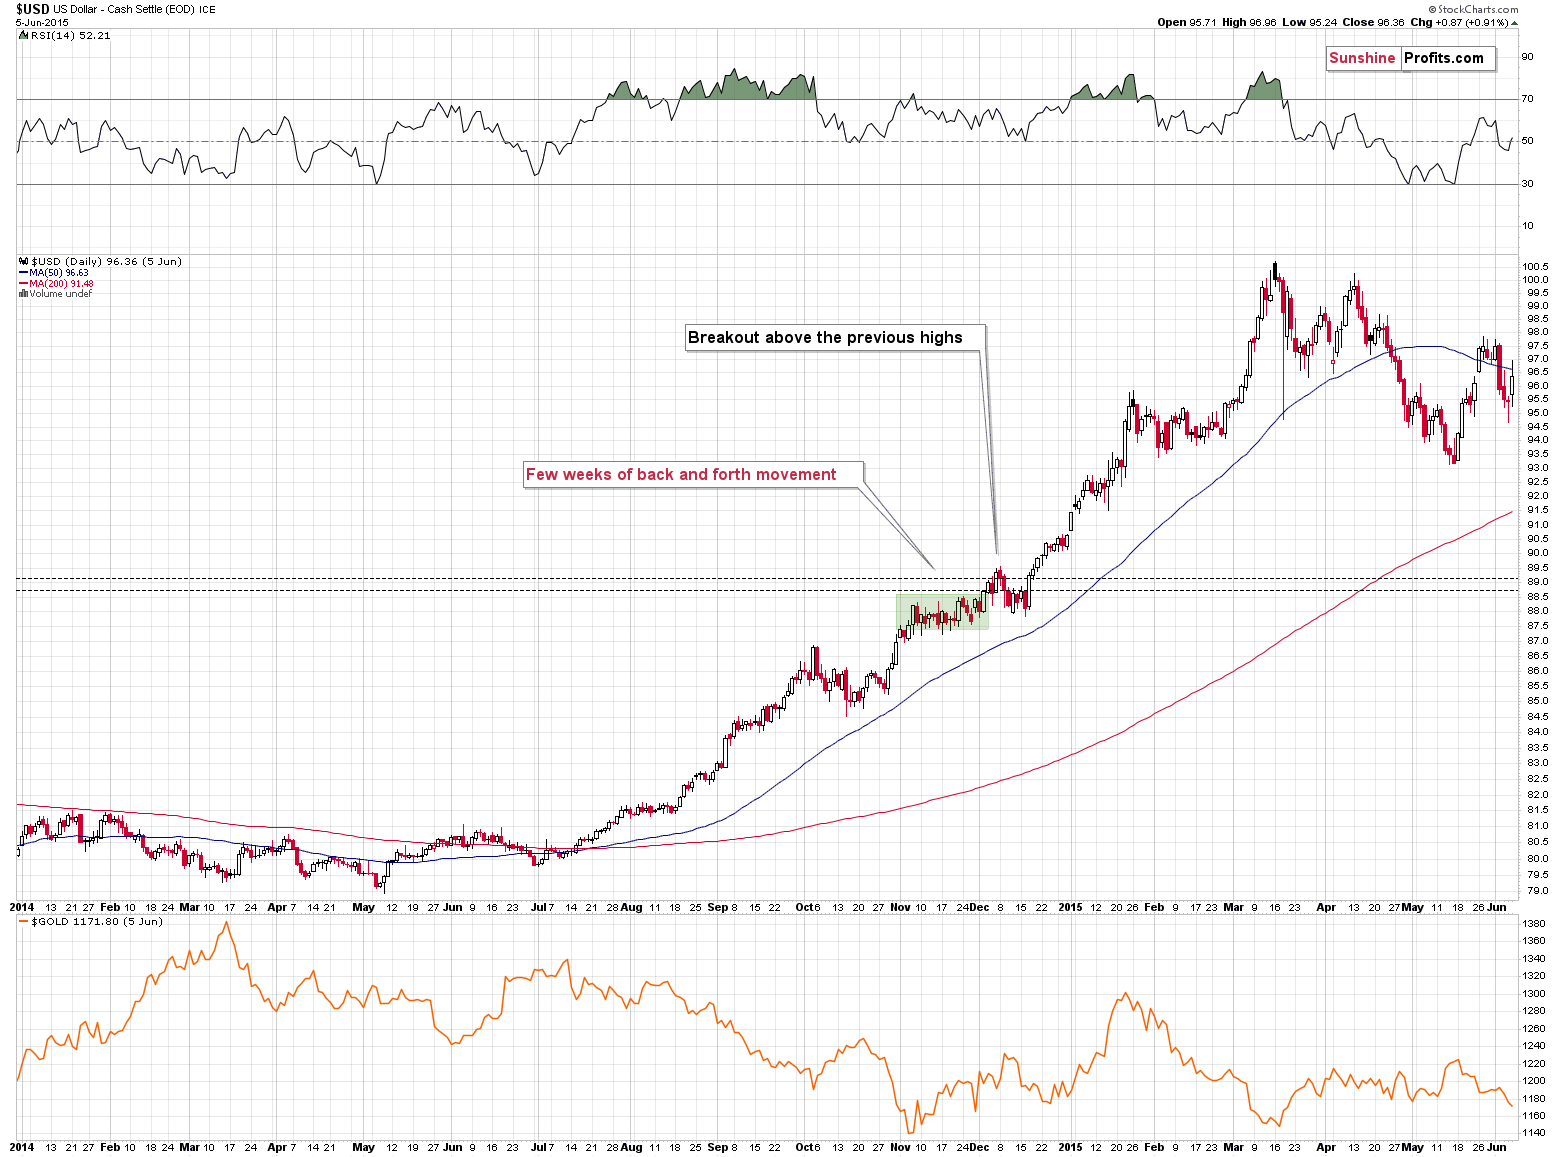
Back in 2014, the USD Index invalidated the breakout above the previous major highs, but then it soared once again, ignoring the invalidation. Consequently, I’m not taking the recent invalidation at its face value.
From the short-term point of view, we see that the USD Index’s correction was actually a handle of a massive cup-and-handle formation. Once we see a confirmed breakout above the recent highs, the USD Index is likely to soar based on this formation.
Interestingly, based on last and this week’s declines, the USD Index is forming a cup-and-handle pattern as a part of the handle of the bigger pattern. This doesn’t change anything – once the USD Index confirms a breakout above the previous highs, both cup-and-handle patterns will be completed, and the value of the USD Index will be very likely to soar.
The opposite is likely to take place in the precious metals sector. Gold, silver, and mining stocks are likely to decline profoundly in the following months, even if they move slightly higher here.
Consequently, in my view, the risk-to-reward ratio strongly favors short positions in junior mining stocks at this time.
Naturally, as always, I’ll keep you – my subscribers – informed.
Overview of the Upcoming Part of the Decline
- It seems to me that the precious metals market is already in its medium-term decline that is about to take it much lower (to the 2021 lows in case of gold - $1,650 - $1,700)
- If we see a situation where miners slide in a meaningful and volatile way while silver doesn’t (it just declines moderately), I plan to – once again – switch from short positions in miners to short positions in silver. At this time, it’s too early to say at what price levels this could take place and if we get this kind of opportunity at all – perhaps with gold prices close to $1,600.
- If we see a situation where miners slide in a meaningful and volatile way while silver doesn’t (it just declines moderately), I plan to – once again – switch from short positions in miners to short positions in silver. At this time, it’s too early to say at what price levels this could take place and if we get this kind of opportunity at all – perhaps with gold prices close to $1,600.
- I plan to exit all remaining short positions once gold shows substantial strength relative to the USD Index while the latter is still rallying. This may be the case with gold close to $1,400. I expect silver to fall the hardest in the final part of the move. This moment (when gold performs very strongly against the rallying USD and miners are strong relative to gold after its substantial decline) is likely to be the best entry point for long-term investments, in my view. This can also happen with gold close to $1,400, but at the moment it’s too early to say with certainty.
- The above is based on the information available today, and it might change in the following days/weeks.
You will find my general overview of the outlook for gold on the chart below:
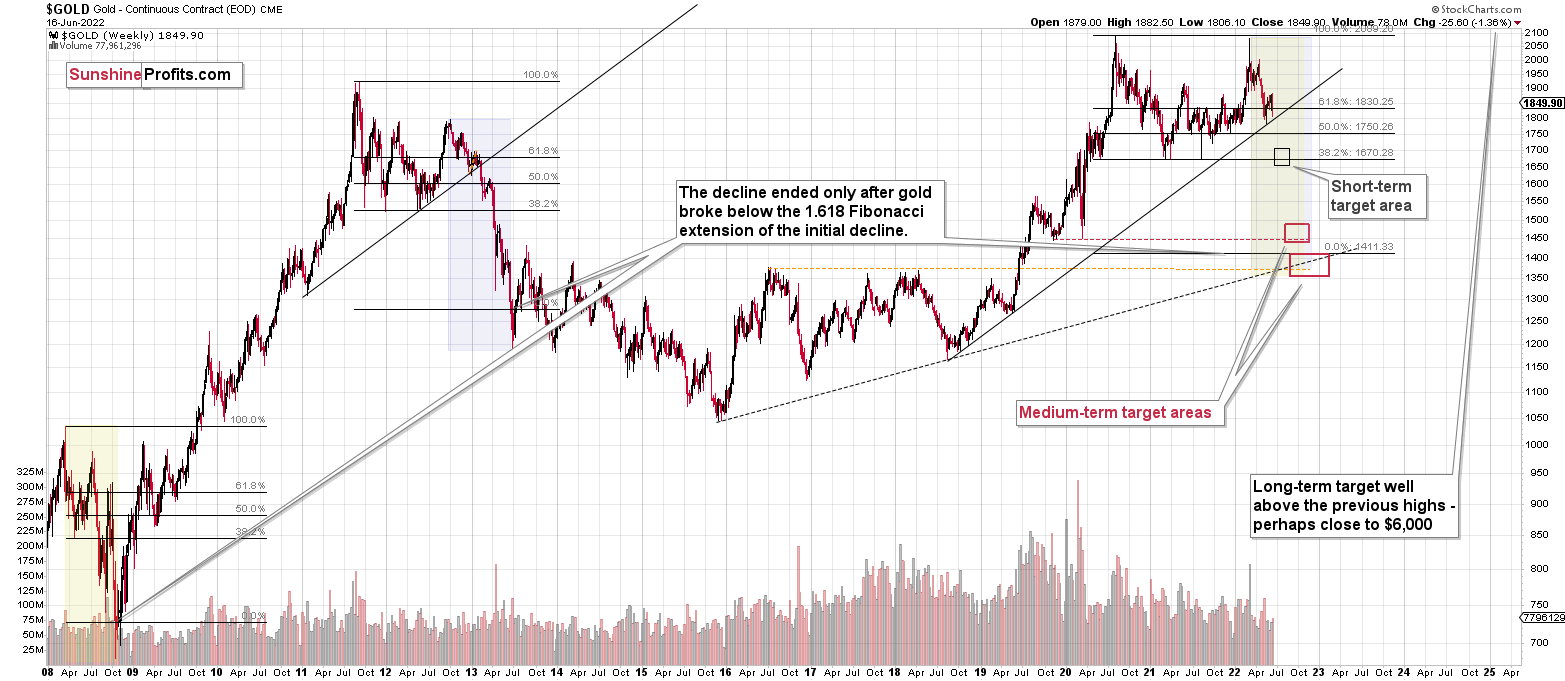
Please note that the above timing details are relatively broad and “for general overview only” – so that you know more or less what I think and how volatile I think the moves are likely to be – on an approximate basis. These time targets are not binding or clear enough for me to think that they should be used for purchasing options, warrants, or similar instruments.
Letters to the Editor
Q:I found this article with the headline “Goldman Sachs Raises Gold Target Yet Again to $2500/Oz by Year-End, Signaling Boost to the Gold Industry.” Things are shaping up as per your forecast with the junior miners. Now if we could combine your forecast with Goldman Sachs, how would you see this playing out? Would you foresee gold coming down to the 1700s, then rallying to the 2000s and then coming back down to the 1500s, or would you see gold coming down to the 1500s in the next few months and then rallying to the 2000s?
I appreciate your thoughts and thank you for your time.
A: If we combined both, it could play out as a sharp decline to $1,450 or so within the next few months and then a powerful comeback rally to $2,500 before the year ends. I wouldn’t expect to see a move to $2,000 (or above $1,900) before gold declines below $1,500.
While I do think that gold will bottom this year, I wouldn’t say that it’s very likely to rally all the way to $2,500 before the year ends, though.
Q: Thanks for your deep analysis of the PM market. It's been very helpful. I need to understand your thinking on current geopolitical events in Europe, with Sweden and Finland joining NATO and Lithuania barring certain Russian goods to Kaliningrad. We certainly cannot predict how these events will unfold but to be on the safe side, should we place some stop-loss levels on our positions? I appreciate your thinking on this.
A: To be on the safe side, we are keeping our insurance capital intact – it’s in physical gold and silver, as you have probably read in the portfolio report, to which I’m linking from each Gold & Silver Trading Alert (the word “portfolio” is linked three times). In the case of any globally devastating event, those holdings would likely go up in value, making up for any losses in trading positions (unless the latter are too big, that is, but that is a different matter).
Please note that these events are already happening, and you can see how junior miners are sliding despite that, which tells us how badly miners want to decline.
However, sure, why not? If this provides peace of mind, I see no harm in placing stop-loss orders a bit below our entry levels. This means that it’s not really a stop-loss level, but actually a profit-protect level, so that even if all hell breaks loose and those positions reverse, we still exit the position on the green side.
I see less than 1% chance of those levels being hit, though. Then again, since it doesn’t cost much to place those levels, I’m adding this to our positions.
Of course, this is just my general opinion about the market, not specific advice directed at anyone in particular. It’s your capital, and you can do with it whatever you want.
Summary
Summing up, it seems to me that the short-term rally in the precious metals market is over, and the decline will now continue. And the tiny correction’s days are likely numbered, too.
I previously wrote that the profits from the previous long position (congratulations once again) were likely to further enhance the profits on this huge decline, and that’s exactly what happened. The profit potential with regard to the upcoming gargantuan decline remains huge.
Moreover, while I see very little chance of those levels behind hit, I’m adding stop-loss orders for our current short positions. Since I’m placing them below the entry levels, they are effectively profit-protect orders. In other words, we are locking-in part of the profits, while letting them grow even more.
As investors are starting to wake up to reality, the precious metals sector (particularly junior mining stocks) is declining sharply. Here are the key aspects of the reality that market participants have ignored:
- rising real interest rates,
- rising USD Index values.
Both of the aforementioned are the two most important fundamental drivers of the gold price. Since neither the USD Index nor real interest rates are likely to stop rising anytime soon (especially now that inflation has become highly political), the gold price is likely to fall sooner or later. Given the analogy to 2012 in gold, silver, and mining stocks, “sooner” is the more likely outcome.
After the final sell-off (that takes gold to about $1,350-$1,500), I expect the precious metals to rally significantly. The final part of the decline might take as little as 1-5 weeks, so it's important to stay alert to any changes.
As always, we'll keep you – our subscribers – informed.
To summarize:
Trading capital (supplementary part of the portfolio; our opinion): Full speculative short positions (300% of the full position) in junior mining stocks are justified from the risk to reward point of view with the following binding exit profit-take price levels:
Mining stocks (price levels for the GDXJ ETF): binding profit-take exit price: $27.32; stop-loss: $38.33
Alternatively, if one seeks leverage, we’re providing the binding profit-take levels for the JDST (2x leveraged). The binding profit-take level for the JDST: $18.35; stop-loss for the JDST: $10.28
For-your-information targets (our opinion; we continue to think that mining stocks are the preferred way of taking advantage of the upcoming price move, but if for whatever reason one wants / has to use silver or gold for this trade, we are providing the details anyway.):
Silver futures downside profit-take exit price: $17.22; stop-loss: $23.22
SLV profit-take exit price: $16.22; stop-loss: $21.22
ZSL profit-take exit price: $41.47; stop-loss: $25.44
Gold futures downside profit-take exit price: $1,706; stop-loss: $1,911
HGD.TO – alternative (Canadian) 2x inverse leveraged gold stocks ETF – the upside profit-take exit price: $11.87; stop-loss: $7.17
HZD.TO – alternative (Canadian) 2x inverse leveraged silver ETF – the upside profit-take exit price: $31.87; stop-loss: $19.88
Long-term capital (core part of the portfolio; our opinion): No positions (in other words: cash)
Insurance capital (core part of the portfolio; our opinion): Full position
Whether you’ve already subscribed or not, we encourage you to find out how to make the most of our alerts and read our replies to the most common alert-and-gold-trading-related-questions.
Please note that we describe the situation for the day that the alert is posted in the trading section. In other words, if we are writing about a speculative position, it means that it is up-to-date on the day it was posted. We are also featuring the initial target prices to decide whether keeping a position on a given day is in tune with your approach (some moves are too small for medium-term traders, and some might appear too big for day-traders).
Additionally, you might want to read why our stop-loss orders are usually relatively far from the current price.
Please note that a full position doesn't mean using all of the capital for a given trade. You will find details on our thoughts on gold portfolio structuring in the Key Insights section on our website.
As a reminder - "initial target price" means exactly that - an "initial" one. It's not a price level at which we suggest closing positions. If this becomes the case (as it did in the previous trade), we will refer to these levels as levels of exit orders (exactly as we've done previously). Stop-loss levels, however, are naturally not "initial", but something that, in our opinion, might be entered as an order.
Since it is impossible to synchronize target prices and stop-loss levels for all the ETFs and ETNs with the main markets that we provide these levels for (gold, silver and mining stocks - the GDX ETF), the stop-loss levels and target prices for other ETNs and ETF (among other: UGL, GLL, AGQ, ZSL, NUGT, DUST, JNUG, JDST) are provided as supplementary, and not as "final". This means that if a stop-loss or a target level is reached for any of the "additional instruments" (GLL for instance), but not for the "main instrument" (gold in this case), we will view positions in both gold and GLL as still open and the stop-loss for GLL would have to be moved lower. On the other hand, if gold moves to a stop-loss level but GLL doesn't, then we will view both positions (in gold and GLL) as closed. In other words, since it's not possible to be 100% certain that each related instrument moves to a given level when the underlying instrument does, we can't provide levels that would be binding. The levels that we do provide are our best estimate of the levels that will correspond to the levels in the underlying assets, but it will be the underlying assets that one will need to focus on regarding the signs pointing to closing a given position or keeping it open. We might adjust the levels in the "additional instruments" without adjusting the levels in the "main instruments", which will simply mean that we have improved our estimation of these levels, not that we changed our outlook on the markets. We are already working on a tool that would update these levels daily for the most popular ETFs, ETNs and individual mining stocks.
Our preferred ways to invest in and to trade gold along with the reasoning can be found in the how to buy gold section. Furthermore, our preferred ETFs and ETNs can be found in our Gold & Silver ETF Ranking.
As a reminder, Gold & Silver Trading Alerts are posted before or on each trading day (we usually post them before the opening bell, but we don't promise doing that each day). If there's anything urgent, we will send you an additional small alert before posting the main one.
Thank you.
Przemyslaw Radomski, CFA
Founder, Editor-in-chief

