

Briefly: in our opinion, full (300% of the regular position size) speculative short positions in junior mining stocks are justified from the risk/reward point of view at the moment of publishing this Alert.
Remember when gold tried to rally above $2,000? It was just a week ago. Now, it’s likely about to drop below $1,900, silver and mining stocks are sliding too. While the white metal has been weak for a while now, mining stocks finally woke up to the reality and appear to be catching up with gold’s and stocks’ declines.
Boy, they sure have some catching up to do! Even though last week’s ~10% decline might appear terrific, let’s keep in mind that this is most likely just the beginning of a huge slide, probably quite similar to what we saw in 2012, 2013, and in 2008.
Let’s start today’s analysis with a quick look at changes in the long-term HUI Index chart – the flagship proxy for gold stocks.
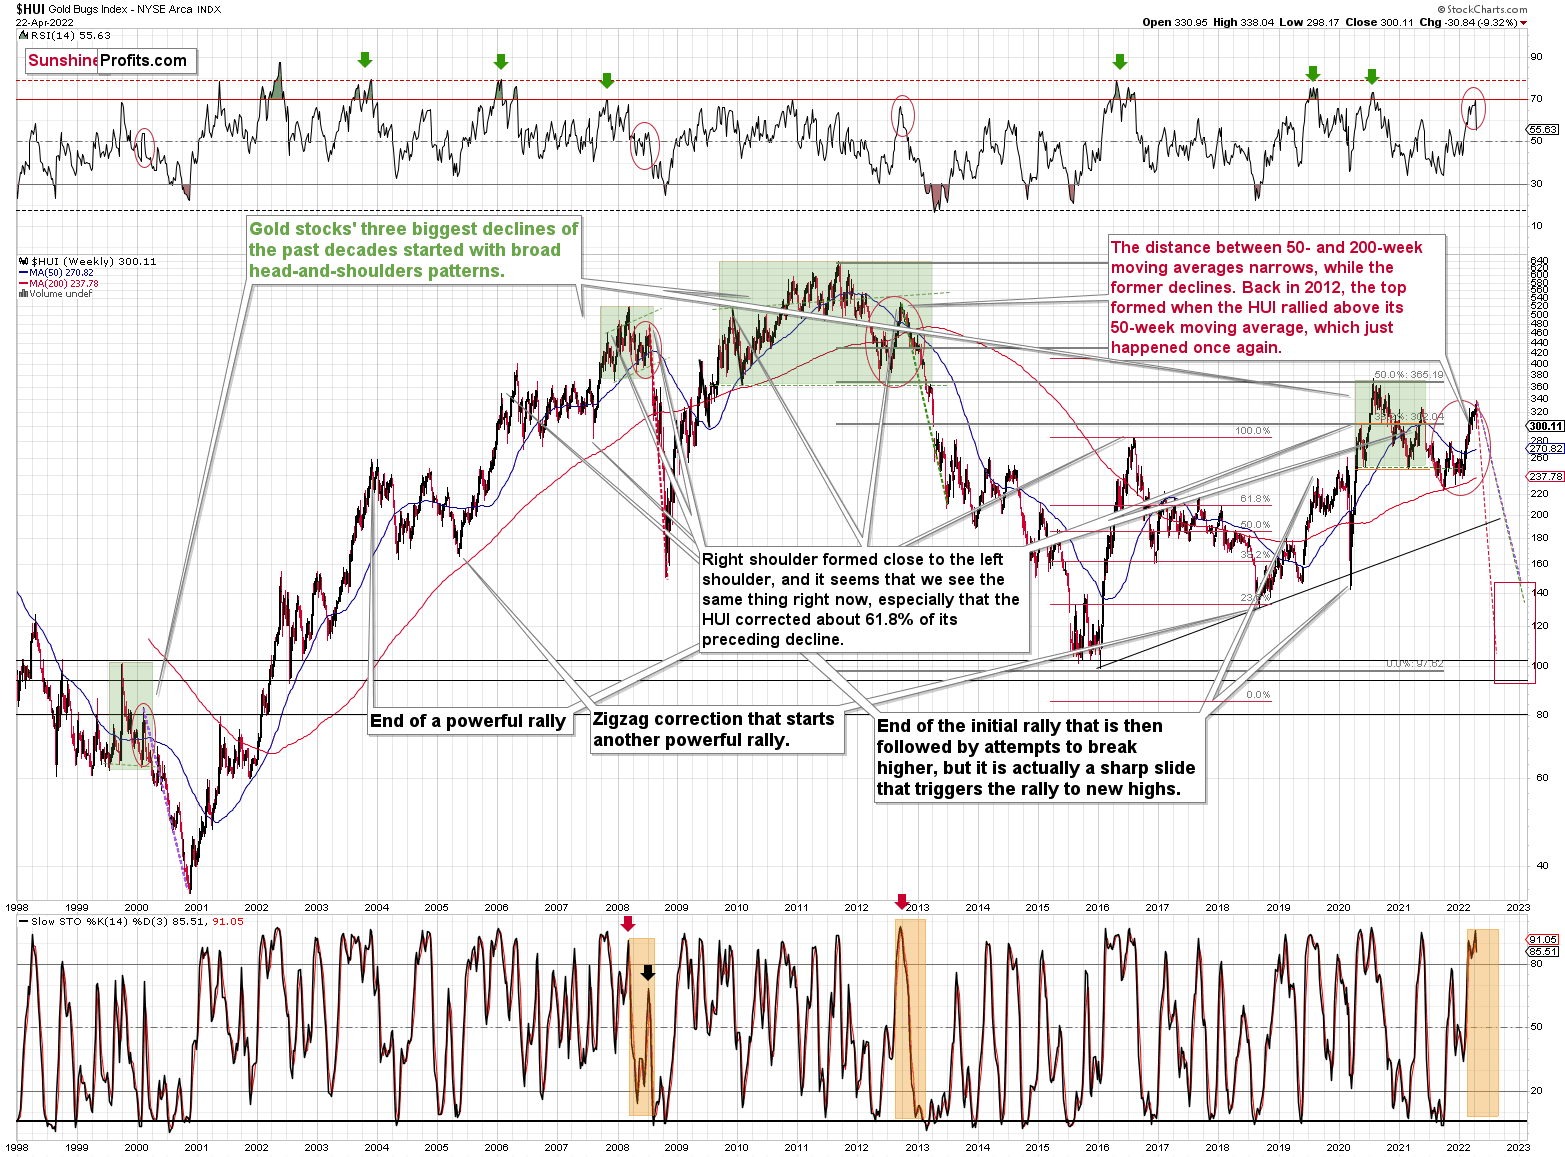
We saw a powerful weekly reversal, a decline in the RSI indicator from about 70, which confirmed the previous sell signal, and a fresh medium-term sell signal from the stochastic indicator.
In particular, the weekly reversal and the sell signal from stochastic are important, as they closely link last week with what we saw right after the final top in 2008 and 2012.
History is likely about to rhyme, and the implications are extremely bearish for mining stocks for the next few months.
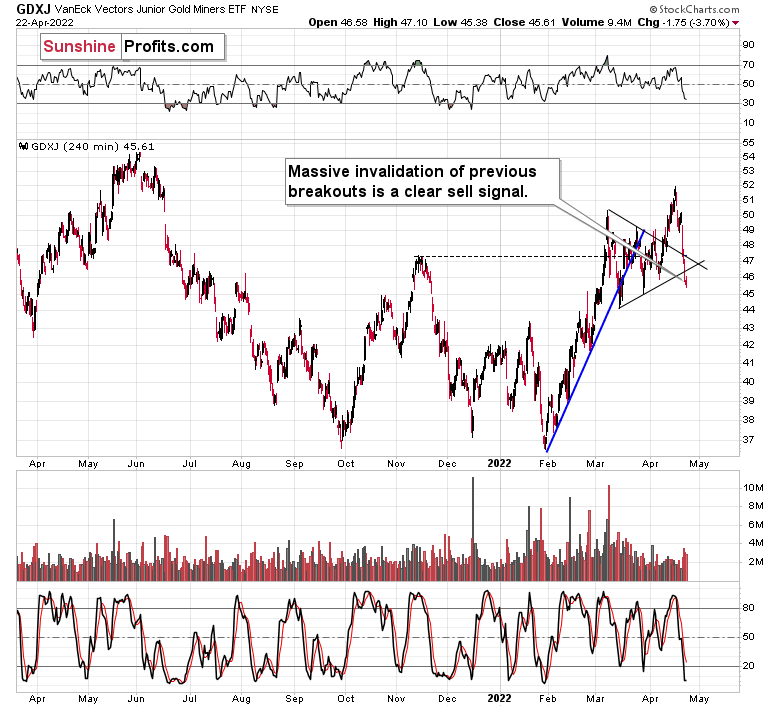
Let’s zoom in.
While senior gold stocks declined by a bit less than 10%, junior miners fell by a bit more than 10% last week.
However, that’s the least important fact about this sector.
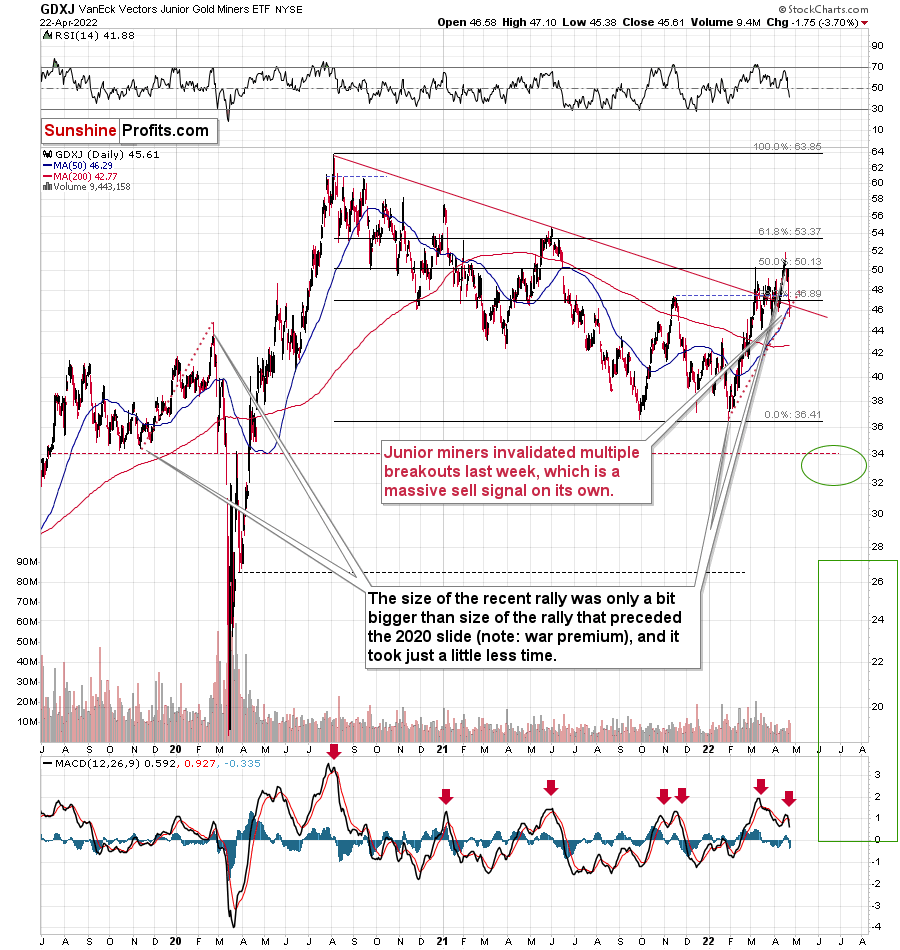
The key thing is that practically all the seemingly bullish breakouts that we saw recently were just invalidated.
The breakout above the declining red resistance line was invalidated.
The breakout above the late-2021 high was invalidated.
The breakout above the 50% Fibonacci retracement level based on the 2020-2022 decline had been (earlier) invalidated.
The breakout above the upper border of the previous triangle pattern was invalidated.
The breakout above the lower border of the previous triangle pattern was invalidated.
That’s a sell signal on top of a sell signal, on top of a sell signal, on top of a sell signal, on top of a sell signal.
We saw sell signals from the GDXJ-based MACD indicator too.
Speaking of the triangle on the above chart, its vertex is at the end of April, so we might see some kind of turnaround then – perhaps a volatile comeback, which is then followed by another – even bigger – slide.
This would fit the gold chart too.
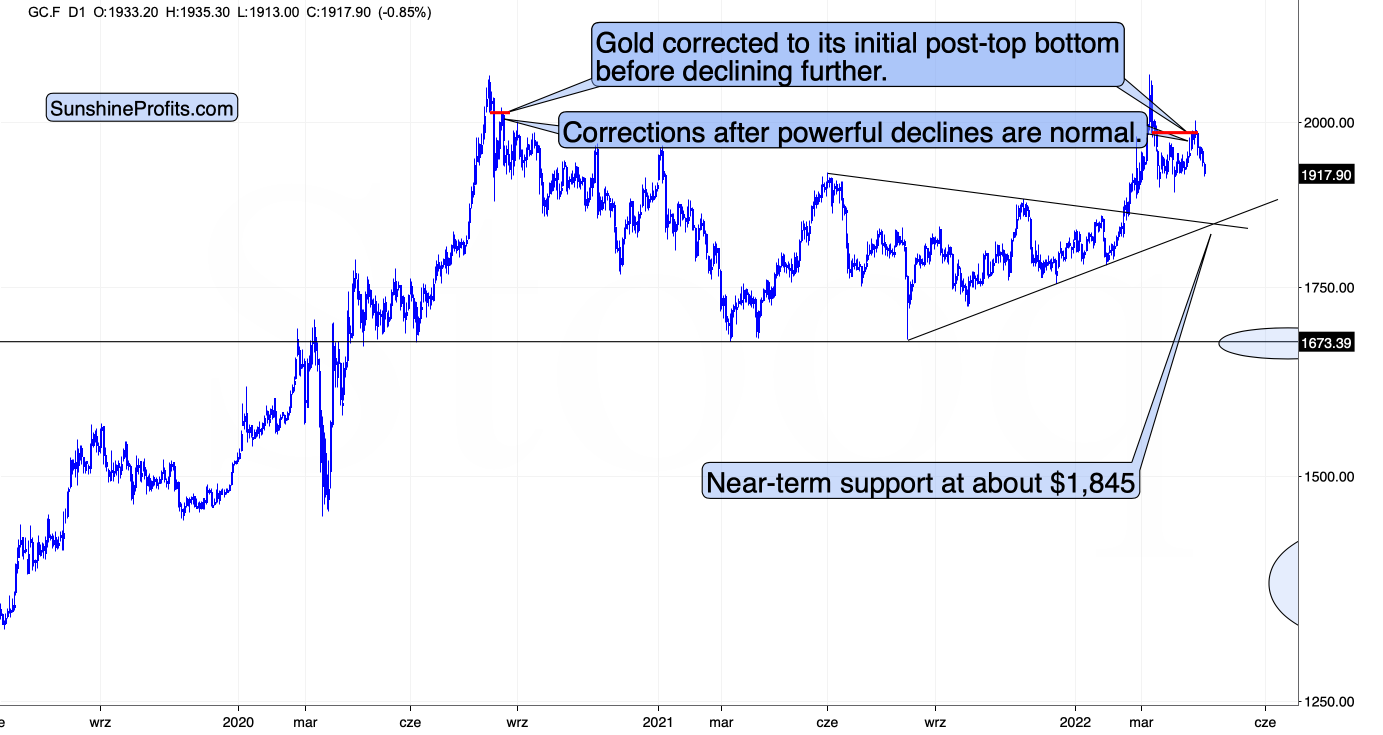
Gold has a triangle-vertex-based reversal point nearby, so they both confirm each other.
In the case of gold, please note how it followed its self-similarity to the post-2020 top trading patterns. The yellow metal moved slightly above its initial post-top bottom, and then it immediately turned south.
The support lines cross at about $1,845, so that’s where we might see the next short-term rebound, but let’s keep in mind that it’s not likely to be anything more than that – a corrective rebound that is then followed by another move lower.
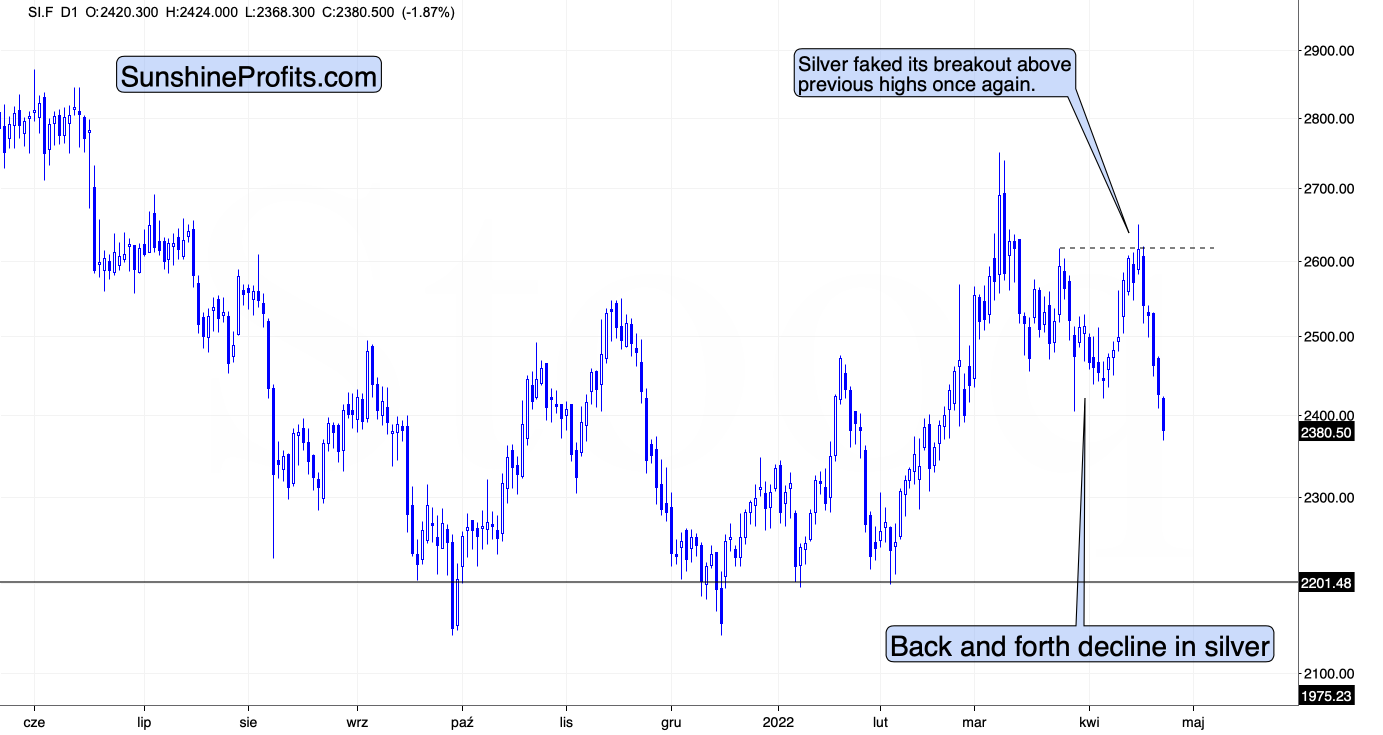
Silver declined profoundly recently, and just like miners, it invalidated multiple previous breakouts. Most interestingly, though, it now clearly invalidates the breakout above its January 2022 high.
The next strong support is based on the previous lows, close to the $22 level. That’s where silver might correct before moving much lower.
Why are mining stocks and silver declining so much nowadays?
It is quite likely due to their connection with the general stock market.
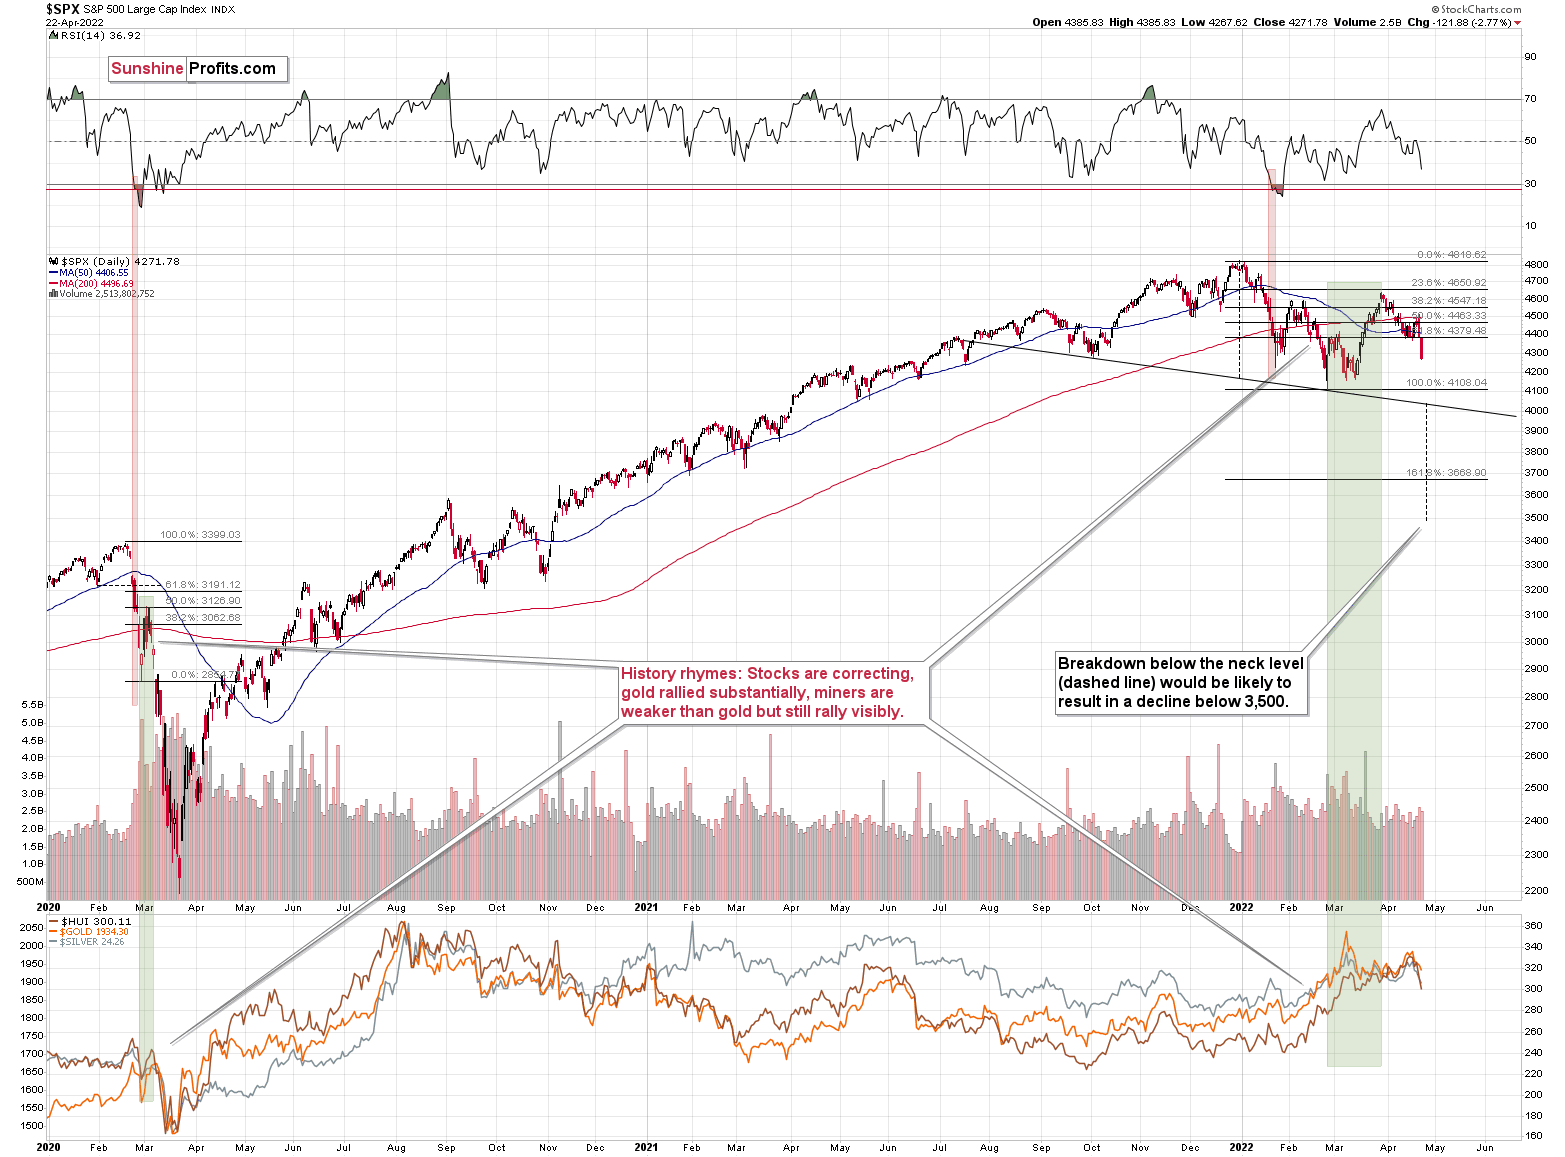
I’ve been writing about the stock market’s incoming demise for quite some time, and that’s what we’re finally seeing. Both silver and miners (especially junior miners) are responding accordingly.
Provided that stocks continue to decline, silver and miners are likely to fall even more than gold.
Let’s keep in mind what happened in the previous cases when stocks declined profoundly – in early 2020 and in 2008. Miners and silver declined in a truly epic manner, and yes, the same is likely to take place in the following months, as markets wake up to the reality, which is that the USD Index and real interest rates are going up.
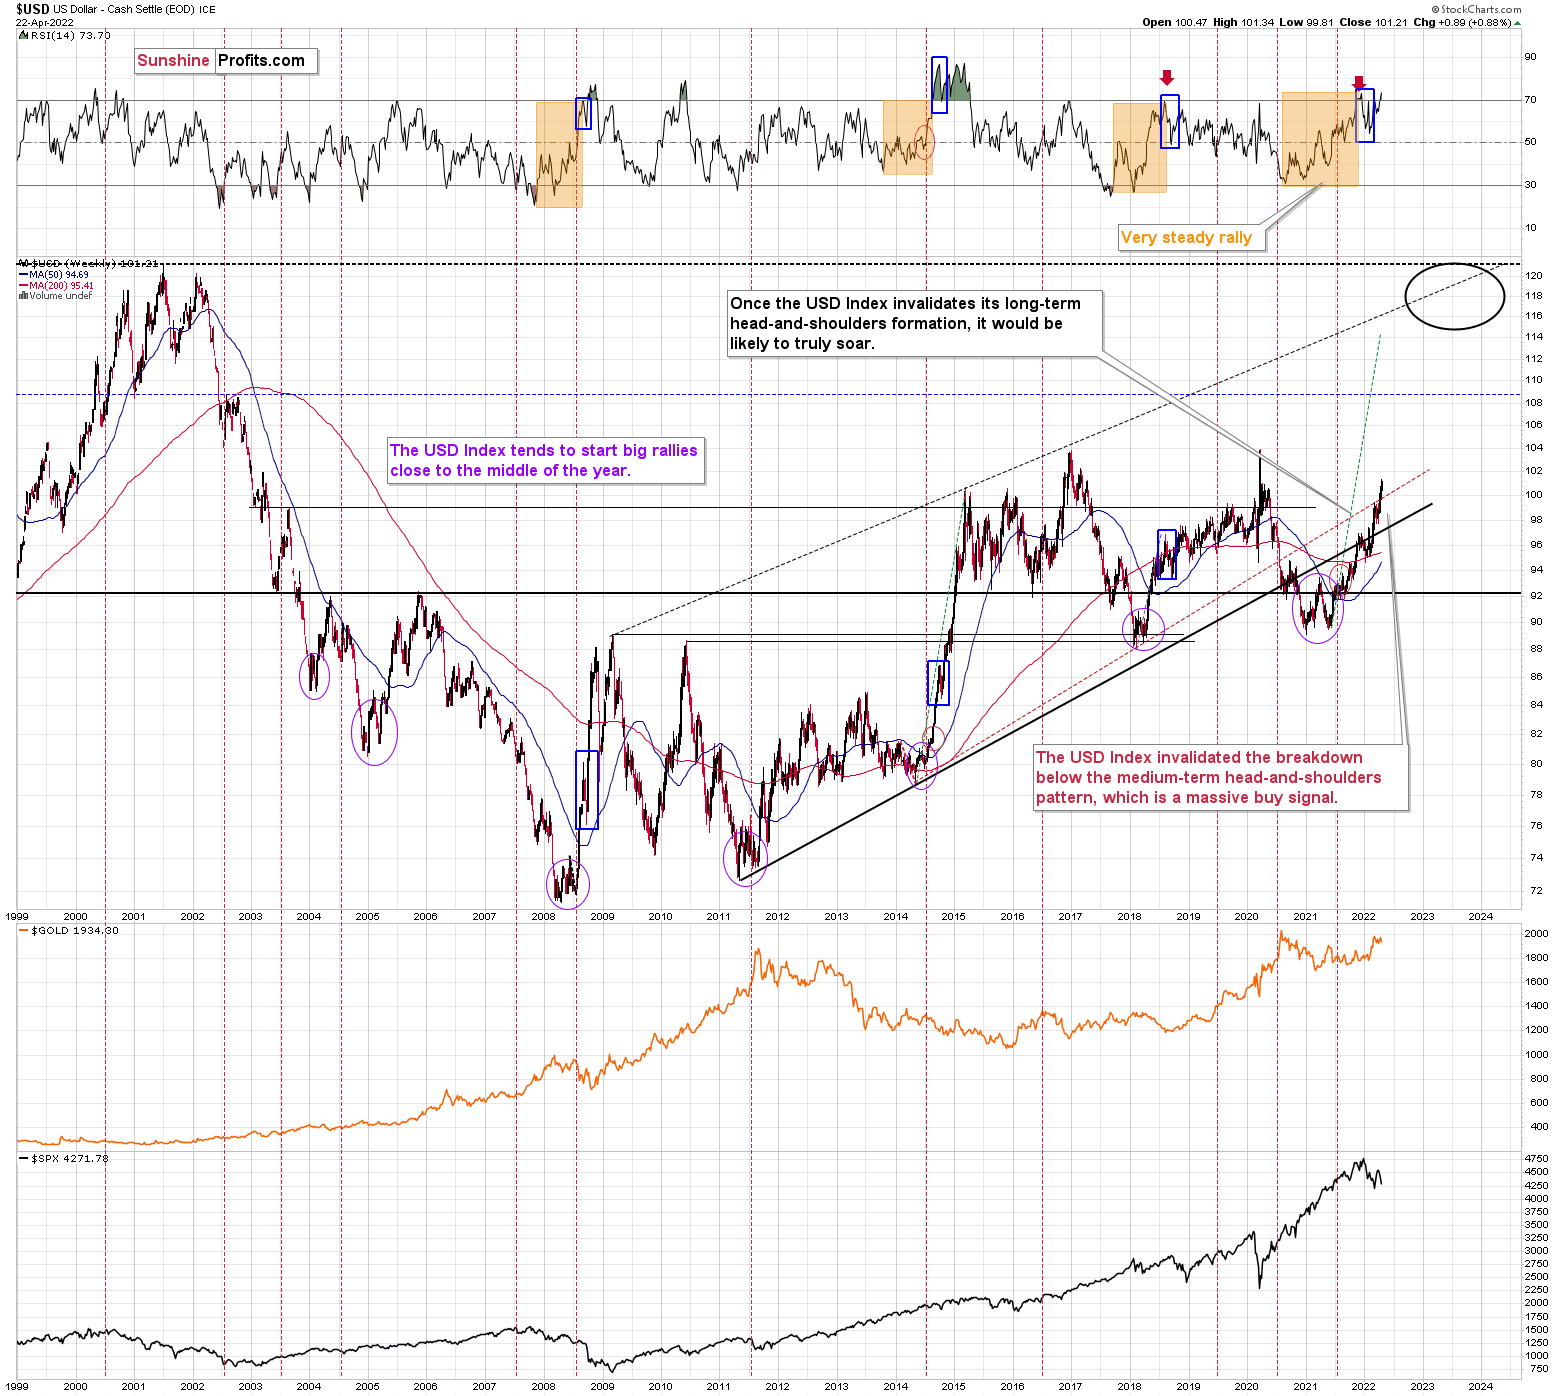
Speaking of the USD Index, after invalidating the breakout below the multi-year head-and-shoulders pattern, the USDX is poised to soar, just like I’ve been expecting it to do for more than a year ago.
The RSI is above 70, but since the USDX is in a medium-term rally and is already after a visible correction, it can rally further. Please note that we saw the same thing in 2008 and in 2014. I marked the corrections with blue rectangles.
The next strong resistance is at the previous highs – close to the 104 level.
It doesn’t mean that the USD Index’s rally is likely to end there. It’s not – but the USDX could take a breather when it reaches 104. Then, after many investors think that the top has been reached as the USDX corrects, the big rally is likely to continue.
All in all, the technical picture for mining stocks is extremely bearish for the following months, even though we might see a short-term correction close to the end of April.
Do I plan to trade this correction? It depends on how likely it is and where the prices of gold, silver, and mining stocks are. If they are close to relatively strong support levels while gold and miners are at their reversal points, I might indeed temporarily get out of the short positions. Of course, I’ll keep you informed.
Having said that, let’s take a look at the markets from a more fundamental point of view.
Fuel for the Hawkish Fire
While the PMs have largely ignored rising real yields and an invigorated USD Index, Fed Chairman Jerome Powell’s reality check on Apr. 21 reminded investors that fighting inflation should result in severe bouts of volatility over the next few months.
Moreover, I’ve noted on numerous occasions that good news is bad news for the PMs. When growth, employment, and inflation outperform, they increase the Fed’s hawkish enthusiasm, and excess tightening is required to normalize the metrics. Therefore, with the data still coming in hot, it may be a long wait for a dovish 180.
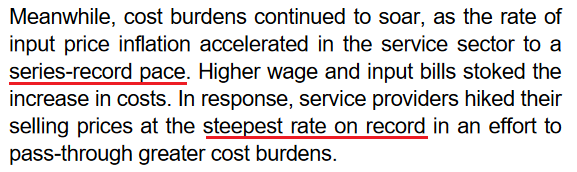
To explain, S&P Global released its U.S. Composite PMI on Apr. 22. The headline index declined from 57.7 in March to 55.1 in April. However, the manufacturing index hit a nine-month high, while the services index hit a three-month low. More importantly, though, it was another all-time high for inflation.
Isolating services:
 Source: S&P Global
Isolating manufacturing:
 Source: S&P Global
Moreover, the report also revealed:
“Employment across the private sector continued to increase strongly in April, albeit at a slightly softer pace than in March. The rate of job creation was the second-fastest since May 2021, as manufacturers registered a sharper rise in workforce numbers. Companies noted that greater staffing numbers were linked to increased business requirements, however, some stated that hiring remained a challenge.”
Furthermore, while demand conditions declined from their recent peaks, the PMI data still paints a rosy portrait of the U.S. economy. Another excerpt read:
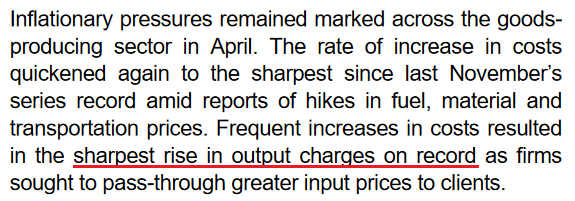
“Private sector businesses signalled a sharp increase in new orders at the start of the second quarter, though the rate of expansion in new business eased from March’s nine-month high. Service providers recorded the softest rise in new sales for three months as a series-record increase in selling prices dampened customer demand.”
“Goods producers, however, indicated a marked upturn in new work that was the fastest for seven months. Nonetheless, new export orders expanded sharply and at the steepest pace since the series began in September 2014. New business from abroad was reportedly boosted by stronger foreign client demand as key export markets continued to reopen.”
As a result, the trifecta remains intact. With growth, employment, and inflation supporting several rate hikes over the next several months, there is little in the release that implies a dovish U-turn. To that point, please remember that the survey was conducted from Apr. 11 to Apr. 21. Therefore, while investors hope that decelerating growth and inflation will allow the Fed to back off, the PMI data suggests otherwise. As such, the Fed’s conundrum continues to intensify.
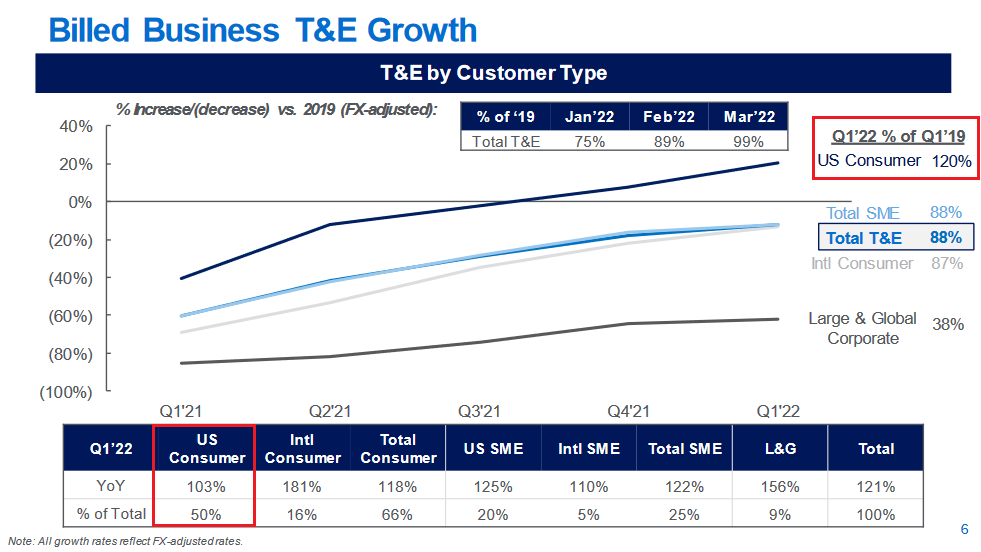
Also noteworthy, American Express released its first-quarter earnings on Apr. 22. CFO Jeff Campbell said during the Q1 earnings call:
“Our millennial and Gen Z customers continue to drive our highest consumer growth, with their spending up 56% year-over-year (YoY) and spending growth from all other age cohorts increasing as well in the quarter. Also, of note, global consumer T&E [Travel & Entertainment] volumes overall were back above 2019 levels as of the first quarter, led by the growth in the U.S. “
“Second, our commercial business' strategic focus on helping SME clients run their businesses continues to drive strong growth in overall SME spending, up 30% in the first quarter with acceleration in growth across the U.S.”
Please see below:
 Source: American Express
If you analyze the red box at the bottom left of the chart above, you can see that U.S. consumer T&E spending rose by 103% YoY. Moreover, the red box at the top right of the chart above shows that U.S. consumer T&E spending is running 20% above its 2019 baseline (the dark blue line above). As a result, U.S. consumers are eager to spend, and this is bullish for Fed policy.
In addition, Kimberly-Clark also released its first-quarter earnings on Apr. 22. For context, the company manufactures sanitary paper, care and baby products. CFO Maria Henry said during the Q1 earnings call:
“At the midpoint of our new guidance versus where we were in January, we were up about $375 million in terms of our expectation for input cost inflation this year. That increase is across all of our baskets.”
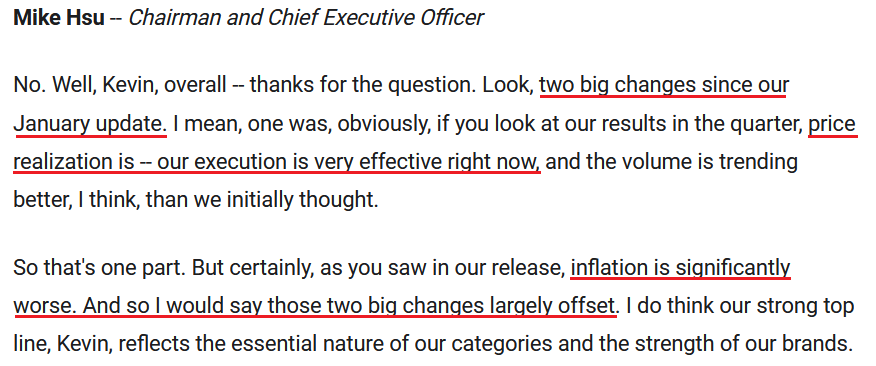
Moreover, CEO Mike Hsu added:
“I think most of our long-term investors have seen [inflation] revert every time, right? But the reality is, in the near term, inflation is well beyond any historical levels. I mean, in just between '21 and '22, if you do the math at the midpoint of our guidance, we're going to take on $2.7 billion of additional inflation, and that's a 1,400-point drag on the operating margin.”
“I will tell you, we will make progress restoring margins. We expect pricing to largely offset inflation. It may not all be in the year, but our teams are moving fast and making progress.”
As a result, with the merry-go-round of input/output inflation still spinning, Kimberly-Clark’s “very effective” price realization adds more fuel to the hawkish fire.
Please see below:
 Source: Kimberly-Clark/The Motley Fool
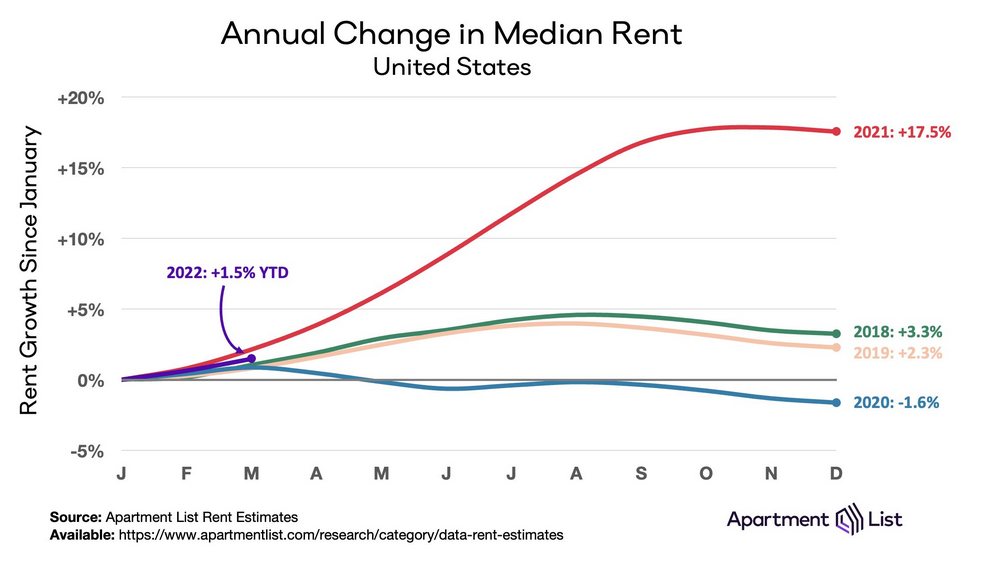
On top of that, the Shelter Consumer Price Index (CPI) accounts for more than 30% of the movement of the headline CPI. Moreover, data from Apartment List shows that median U.S. rents increased by 1.5% in Q1, and analyst Rob Warnock wrote that “rents are rising faster in 2022 than pre-covid years.”
Furthermore, annualizing the uptick puts median rent inflation at ~6.1% in 2022. However, the spring and summer months are often the peak pricing periods. Therefore, rent inflation should continue to outperform and put more pressure on the Fed.
Please see below:
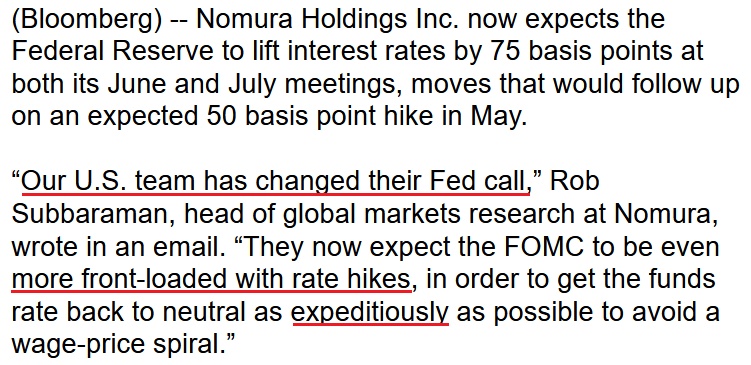
Speaking of which, rumors have circulated about a potential 75 basis point rate hike at an upcoming FOMC meeting. Nomura's North America Economics team told clients on Apr 21:
“We believe comments from FOMC participants this week were an intentional effort to ‘trial balloon’ a 75bp hike and then closely monitor the market’s response. We expect the first 75bp rate hikes since 1994 at the June and July meetings following a 50bp rate hike in May.”
“FOMC participants appeared to open the door to such action this week. Over the near term, the Fed remains squarely focused on bringing rates to a neutral setting. Even dovish participants like Evans and Daly have recently suggested support for bringing rates to around 2.25-2.50%, which they consider to be neutral.”
Thus, while I have been warning for months that surging inflation would force the Fed’s hand, investors remain in denial about the seriousness of the problem and what needs to happen to fix the situation. However, Nomura has taken note of officials’ “expeditiously” hawkish rhetoric.
Please see below:
 Source: Bloomberg
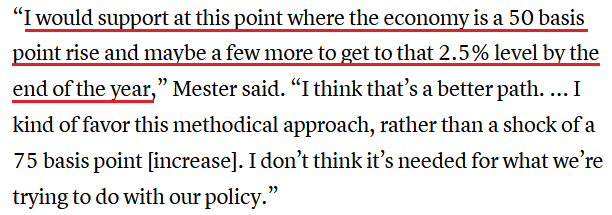
In contrast, Cleveland Fed President Loretta Mester dismissed the idea on Apr. 22, telling CNBC: “My own view is we don’t need to go there at this point. I’d rather be more deliberative and more intentional about what we’re planning to do.”
Yet, in her attempt to remain dovish, her reference of “maybe a few” 50 basis point rate hikes in 2022 is still extremely hawkish. Remember, the FOMC’s September projections showed officials were split 50/50 about one 25 basis point rate hike in 2022. Now look where we are:
 Source: CNBC
The bottom line? While investors pray that the Fed will revert back to its dovish ways, the reality is that inflation is a different animal. Moreover, I warned on Dec. 23 that it's prudent to fade narratives and follow the data. Therefore, it doesn't matter what I or anyone else wants; the Fed has to act if the situation calls for it. I wrote:
Please note that when the Fed called inflation “transitory,” I wrote for months that officials were misreading the data. As a result, I don’t have a horse in this race. However, now, they likely have it right. Thus, if investors assume that the Fed won’t tighten, their bets will likely go bust in 2022.
As a result, all the Fed can do is raise interest rates and hope for a soft landing. If not, the longer officials wait, the more the bubble will grow, and the harder the fall when it eventually pops. As such, with the former being the most likely course of action, the PMs should suffer mightily as the drama unfolds – at least initially.
In conclusion, the PMs declined on Apr. 22, as mayhem hit the general stock market. Moreover, with our bearish medium-term thesis gaining more momentum by the day, a stronger USD Index, higher real yields, and lower precious metals prices should dominate the headlines over the next few months.
Overview of the Upcoming Part of the Decline
- It seems to me that the post-decline consolidation is now over or very close to being over , and that gold, silver, and mining stocks are now likely to continue their medium-term decline.
- It seems that the first (bigger) stop for gold will be close to its previous 2021 lows, slightly below $1,800 . Then it will likely correct a bit, but it’s unclear if I want to exit or reverse the current short position based on that – it depends on the number and the nature of the bullish indications that we get at that time.
- After the above-mentioned correction, we’re likely to see a powerful slide, perhaps close to the 2020 low ($1,450 - $1,500).
- If we see a situation where miners slide in a meaningful and volatile way while silver doesn’t (it just declines moderately), I plan to – once again – switch from short positions in miners to short positions in silver. At this time, it’s too early to say at what price levels this could take place, and if we get this kind of opportunity at all – perhaps with gold close to $1,600.
- I plan to exit all remaining short positions once gold shows substantial strength relative to the USD Index while the latter is still rallying. This may be the case with gold close to $1,350 - $1,400. I expect silver to fall the hardest in the final part of the move. This moment (when gold performs very strongly against the rallying USD and miners are strong relative to gold after its substantial decline) is likely to be the best entry point for long-term investments, in my view. This can also happen with gold close to $1,375, but at the moment it’s too early to say with certainty.
- As a confirmation for the above, I will use the (upcoming or perhaps we have already seen it?) top in the general stock market as the starting point for the three-month countdown. The reason is that after the 1929 top, gold miners declined for about three months after the general stock market started to slide. We also saw some confirmations of this theory based on the analogy to 2008. All in all, the precious metals sector is likely to bottom about three months after the general stock market tops.
- The above is based on the information available today, and it might change in the following days/weeks.
You will find my general overview of the outlook for gold on the chart below:
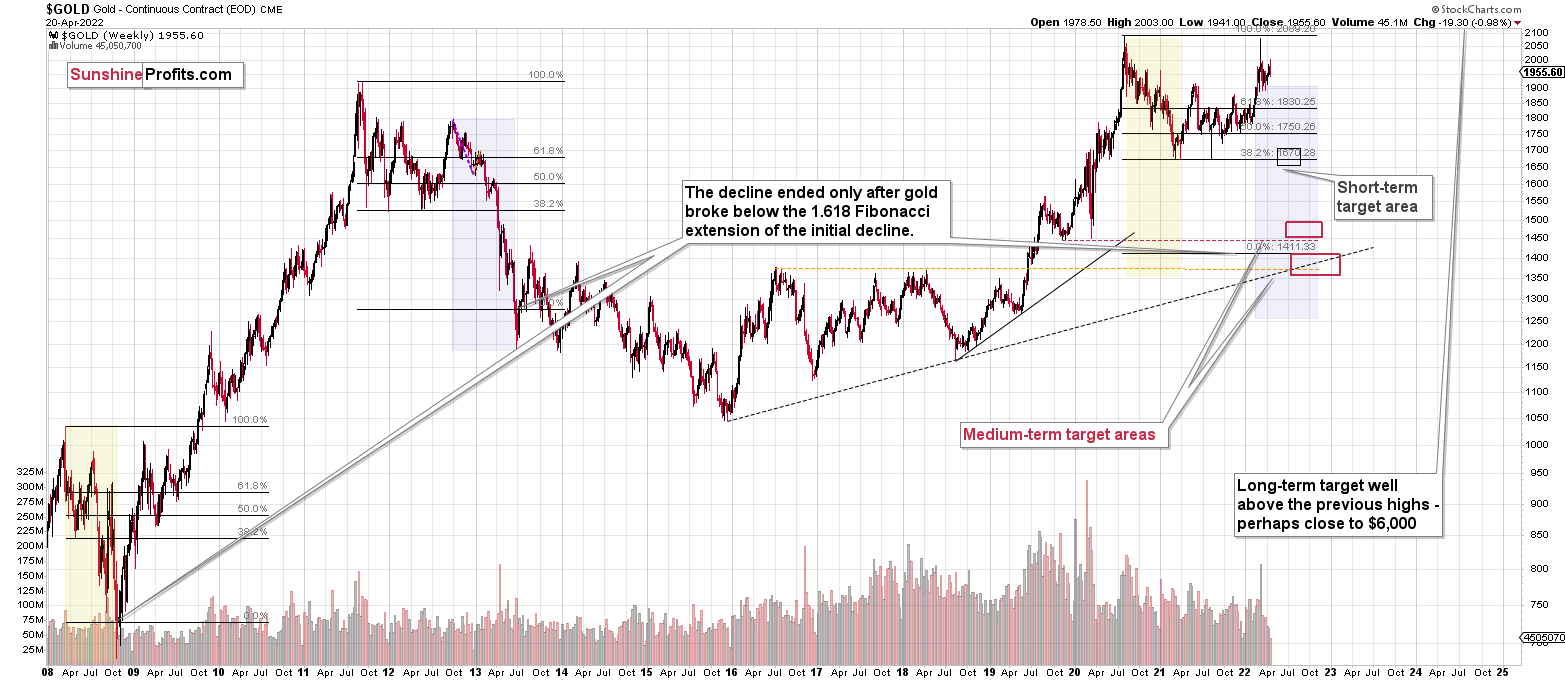
Please note that the above timing details are relatively broad and “for general overview only” – so that you know more or less what I think and how volatile I think the moves are likely to be – on an approximate basis. These time targets are not binding or clear enough for me to think that they should be used for purchasing options, warrants or similar instruments.
Summary
Summing up, despite the recent rally in gold, the outlook for junior mining stocks remains exactly as I described previously.
Investing and trading are difficult. If it was easy, most people would be making money – and they’re not. Right now, it’s most difficult to ignore the urge to trade along with the crowd that’s ignoring two critical factors:
- rising real interest rates,
- rising USD Index values.
Both of the aforementioned are the two most important fundamental drivers of the gold price. Since neither the USD Index nor real interest rates are likely to stop rising anytime soon (especially now that inflation has become highly political), the gold price is likely to fall sooner or later. Given the analogy to 2012 in gold, silver, and mining stocks, “sooner” is the more likely outcome.
It seems that our profits from short positions are going to become truly epic in the coming months.
Moreover, let’s keep in mind that we are not patient with this trade to just get out of it close to being even or with a reasonable (10%-30%) profit. Of course, I can’t promise anything, but this entire short trade is likely to end with gold below $1,500 and junior miners close to or below their 2020 lows. The upside potential for the inversely trading instruments is likely enormous. Yes, we might adjust the trade or exit it temporarily, only to get back to it shortly thereafter, but the overall potential remains gargantuan. It’s quite likely that none of those gains will be reaped by precious metals perma-bulls.
After the sell-off (that takes gold to about $1,350-$1,500), I expect the precious metals to rally significantly. The final part of the decline might take as little as 1-5 weeks, so it's important to stay alert to any changes.
As always, we'll keep you – our subscribers – informed.
To summarize:
Trading capital (supplementary part of the portfolio; our opinion): Full speculative short positions (300% of the full position) in junior mining stocks are justified from the risk to reward point of view with the following binding exit profit-take price levels:
Mining stocks (price levels for the GDXJ ETF): binding profit-take exit price: $34.63; stop-loss: none (the volatility is too big to justify a stop-loss order in case of this particular trade)
Alternatively, if one seeks leverage, we’re providing the binding profit-take levels for the JDST (2x leveraged) and GDXD (3x leveraged – which is not suggested for most traders/investors due to the significant leverage). The binding profit-take level for the JDST: $14.98; stop-loss for the JDST: none (the volatility is too big to justify a SL order in case of this particular trade); binding profit-take level for the GDXD: $25.48; stop-loss for the GDXD: none (the volatility is too big to justify a SL order in case of this particular trade).
For-your-information targets (our opinion; we continue to think that mining stocks are the preferred way of taking advantage of the upcoming price move, but if for whatever reason one wants / has to use silver or gold for this trade, we are providing the details anyway.):
Silver futures downside profit-take exit price: $19.12
SLV profit-take exit price: $17.72
ZSL profit-take exit price: $38.28
Gold futures downside profit-take exit price: $1,683
HGD.TO – alternative (Canadian) inverse 2x leveraged gold stocks ETF – the upside profit-take exit price: $11.79
HZD.TO – alternative (Canadian) inverse 2x leveraged silver ETF – the upside profit-take exit price: $29.48
Long-term capital (core part of the portfolio; our opinion): No positions (in other words: cash
Insurance capital (core part of the portfolio; our opinion): Full position
Whether you already subscribed or not, we encourage you to find out how to make the most of our alerts and read our replies to the most common alert-and-gold-trading-related-questions.
Please note that we describe the situation for the day that the alert is posted in the trading section. In other words, if we are writing about a speculative position, it means that it is up-to-date on the day it was posted. We are also featuring the initial target prices to decide whether keeping a position on a given day is in tune with your approach (some moves are too small for medium-term traders, and some might appear too big for day-traders).
Additionally, you might want to read why our stop-loss orders are usually relatively far from the current price.
Please note that a full position doesn't mean using all of the capital for a given trade. You will find details on our thoughts on gold portfolio structuring in the Key Insights section on our website.
As a reminder - "initial target price" means exactly that - an "initial" one. It's not a price level at which we suggest closing positions. If this becomes the case (like it did in the previous trade), we will refer to these levels as levels of exit orders (exactly as we've done previously). Stop-loss levels, however, are naturally not "initial", but something that, in our opinion, might be entered as an order.
Since it is impossible to synchronize target prices and stop-loss levels for all the ETFs and ETNs with the main markets that we provide these levels for (gold, silver and mining stocks - the GDX ETF), the stop-loss levels and target prices for other ETNs and ETF (among other: UGL, GLL, AGQ, ZSL, NUGT, DUST, JNUG, JDST) are provided as supplementary, and not as "final". This means that if a stop-loss or a target level is reached for any of the "additional instruments" (GLL for instance), but not for the "main instrument" (gold in this case), we will view positions in both gold and GLL as still open and the stop-loss for GLL would have to be moved lower. On the other hand, if gold moves to a stop-loss level but GLL doesn't, then we will view both positions (in gold and GLL) as closed. In other words, since it's not possible to be 100% certain that each related instrument moves to a given level when the underlying instrument does, we can't provide levels that would be binding. The levels that we do provide are our best estimate of the levels that will correspond to the levels in the underlying assets, but it will be the underlying assets that one will need to focus on regarding the signs pointing to closing a given position or keeping it open. We might adjust the levels in the "additional instruments" without adjusting the levels in the "main instruments", which will simply mean that we have improved our estimation of these levels, not that we changed our outlook on the markets. We are already working on a tool that would update these levels daily for the most popular ETFs, ETNs and individual mining stocks.
Our preferred ways to invest in and to trade gold along with the reasoning can be found in the how to buy gold section. Furthermore, our preferred ETFs and ETNs can be found in our Gold & Silver ETF Ranking.
As a reminder, Gold & Silver Trading Alerts are posted before or on each trading day (we usually post them before the opening bell, but we don't promise doing that each day). If there's anything urgent, we will send you an additional small alert before posting the main one.
Thank you.
Przemyslaw Radomski, CFA
Founder, Editor-in-chief

