

Briefly: in our opinion, full (250% of the regular size of the position) speculative short positions in gold, silver and mining stocks are justified from the risk/reward perspective at the moment of publishing this Alert.
The price of palladium just exceeded the price of gold for the first time in 16 years. That’s an epic event. But what does it really mean? And why should gold, silver, and mining stock investors care about the small palladium market?
In short, because this development can tell us something about the future performance of the PM sector in general.
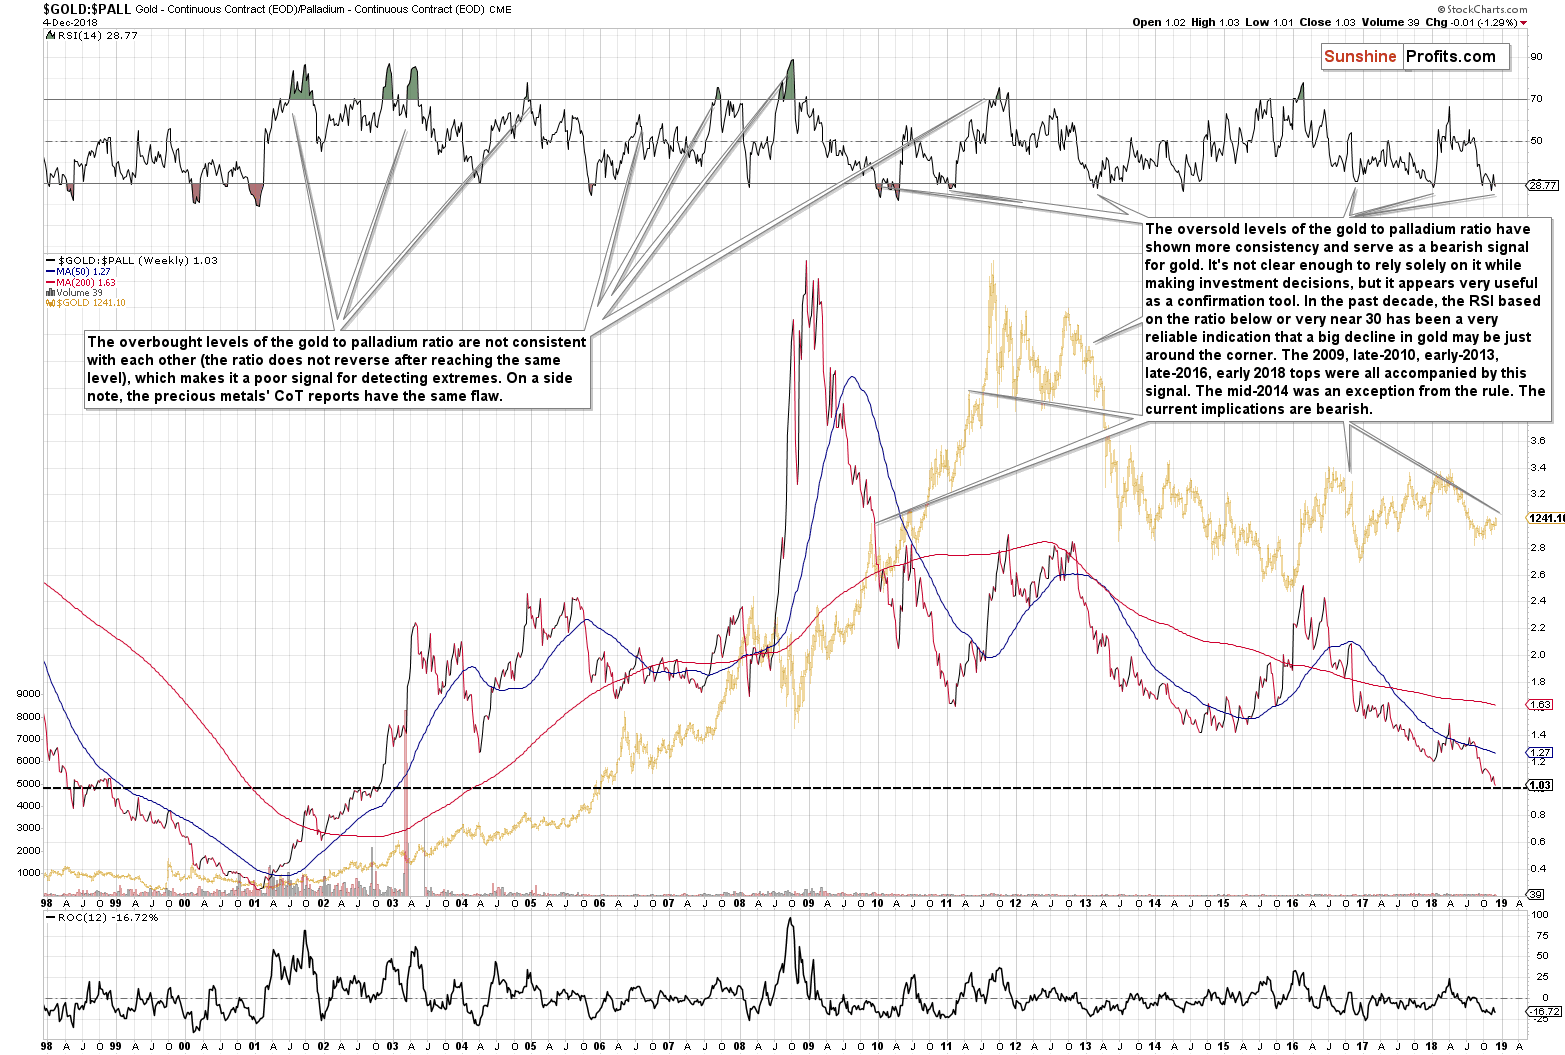
The last time the gold to palladium ratio was trading below 1, meaning that palladium was worth more than gold, was in late 2002. The ratio stayed there for a few months before finally rallying above it, which suggests that investors may need to see both metals at similar price levels before they accept that palladium can really be worth more than gold. The 2002 example, however, shows that the 1 level works as resistance for the ratio, and in the current case it’s critical to check if it works as support.
And it does. Not with perfect precision, but it’s definitely useful. Back in 1998, when the ratio was breaking below 1, it moved back and forth around this level for several months, and declined below this important level only after this consolidation was completed.
What does it imply for the current situation? It indicates that palladium’s march higher may stop for a while. Moreover, if gold declines in the following weeks, it may decline as well in order to keep the ratio close to 1.
The key question that you are probably asking yourself is why does this small market (the size of the palladium market is tiny compared to the one of gold) matter for those, who are interested in gold, silver, and mining stocks, not only in palladium. The reply is that, when approached carefully, palladium’s link to gold can serve as a technical signal.
The gold to palladium ratio by itself is not range-bound. It moves between extremes that are not necessarily consistent over time and because of that it’s not really useful on its own. However, applying an indicator that would transform the ratio movement into something that’s more range-bound can provide us with more valuable information. We’ll use the RSI indicator, which you can see in the upper part of the above chart.
Let’s start with the limitation of the above approach. Even in case of the RSI indicator, the overbought levels of the gold to palladium ratio are not consistent with each other (the ratio does not reverse after reaching the same level), which makes it a poor signal for detecting extremes. On a side note, the gold and silver CoT reports have the same flaw.
Fortunately, there is a way to use the above after all. The oversold levels of the gold to palladium ratio have shown more consistency and serve as a bearish signal for gold. It's not clear enough to rely solely on it while making investment decisions, but it appears very useful as a confirmation tool. In the past decade, the RSI based on the ratio below or very near 30 has been a very reliable indication that a big decline in gold may be just around the corner. The 2009, late-2010, early-2013, late-2016, early 2018 tops were all accompanied by this signal. The mid-2014 was an exception from the rule.
Since almost all cases form the past decade when the RSI based on the gold to palladium ratio moved very close to or below 30 meant that huge declines in gold are close, then we can view it as a very bearish signal. This is especially the case that it’s not a single bearish factor that’s currently in place. Conversely, there’s been a number of factors pointing to a big decline in the prices of gold, silver and mining stocks in the following weeks. Consequently, the above-mentioned bearish signal serves as their confirmation.
From the gold & silver portfolio management point of view, it may be tempting to focus on palladium as it’s been performing so well lately. However, the long-term outlook is not as rosy as it seems. We explained it in the part 5 of our Preparing for the Bottom series, entitled What to Buy, and it seems that in light of what’s happening in palladium prices right now, it’s worth quoting this analysis:
Well, it’s potential seems more promising than the one of platinum (and the platinum to palladium ratio has been declining accordingly), but it’s still likely to suffer due to the same fundamental reasons in the coming years. Almost 85% of palladium demand comes from the automotive industry (it’s used instead of platinum in gasoline-powered cars), which makes it effectively an industrial metal, more similar to copper than to gold. So, should it really be a part of a precious metals portfolio? It could, if it had a promising outlook and this also seems to be a problem. While it’s likely to outperform platinum (just as gasoline cars are taking over diesel cars), there is a major problem in the form of the long-term rise of the electric car market share. These cars will not dominate the market shortly, but the trend is already present and since markets are generally forward-looking, the prices could reflect this trend much sooner, which doesn’t bode well for the prices of palladium in the following years (at least compared to gold and silver). Some might say that fuel cells will support the demand for platinum and palladium, but that doesn’t seem to be the case.
From a technical point of view, we see that palladium has been outperforming the precious metals sector for a few years, but the 2000 – 2009 performance was very weak. The biggest run-up – in addition to the current one – was seen right after the 2008 bottom ($160.30) when palladium rallied to $862 in 2011 (rallying by almost 438%). For comparison, silver soared from $8.40 to $49.83 (rallying by over 493%) – the latter still outperformed.
So, when did palladium exactly outperform? When the precious metals sector – in general – was declining. It’s no wonder that this happened – after all, the general stock market has been soaring and the vast majority of demand for palladium is of industrial nature.
Since we want to enter the precious metals market and exit it close to the top, then it’s the performance during upswings that is most important, but one can say that the above is at least “interesting” about palladium.
What’s less interesting is palladium’s performance in the previous great bull market that we saw 4 decades ago. Palladium rose from below $40 to about $350, while gold moved from below $40 to about $850 and silver moved from below $1.50 to about $50. Palladium was a clear loser in that race and since history tends to rhyme, it doesn’t make us thrilled about palladium’s future performance.
All in all, even though the price is currently well above the palladium production cost, this precious metals doesn’t seem to be a long-term winner. Its fundamental picture and the analogy to the previous great bull market make us reluctant to include it in the long-term investment category of the precious metals portfolio. There are better ways to gain the edge over other investors than through adding palladium to one’s investment portfolio.
Short-term Signals
As far as short term is concerned, we have seen a repeat of the previous signals.
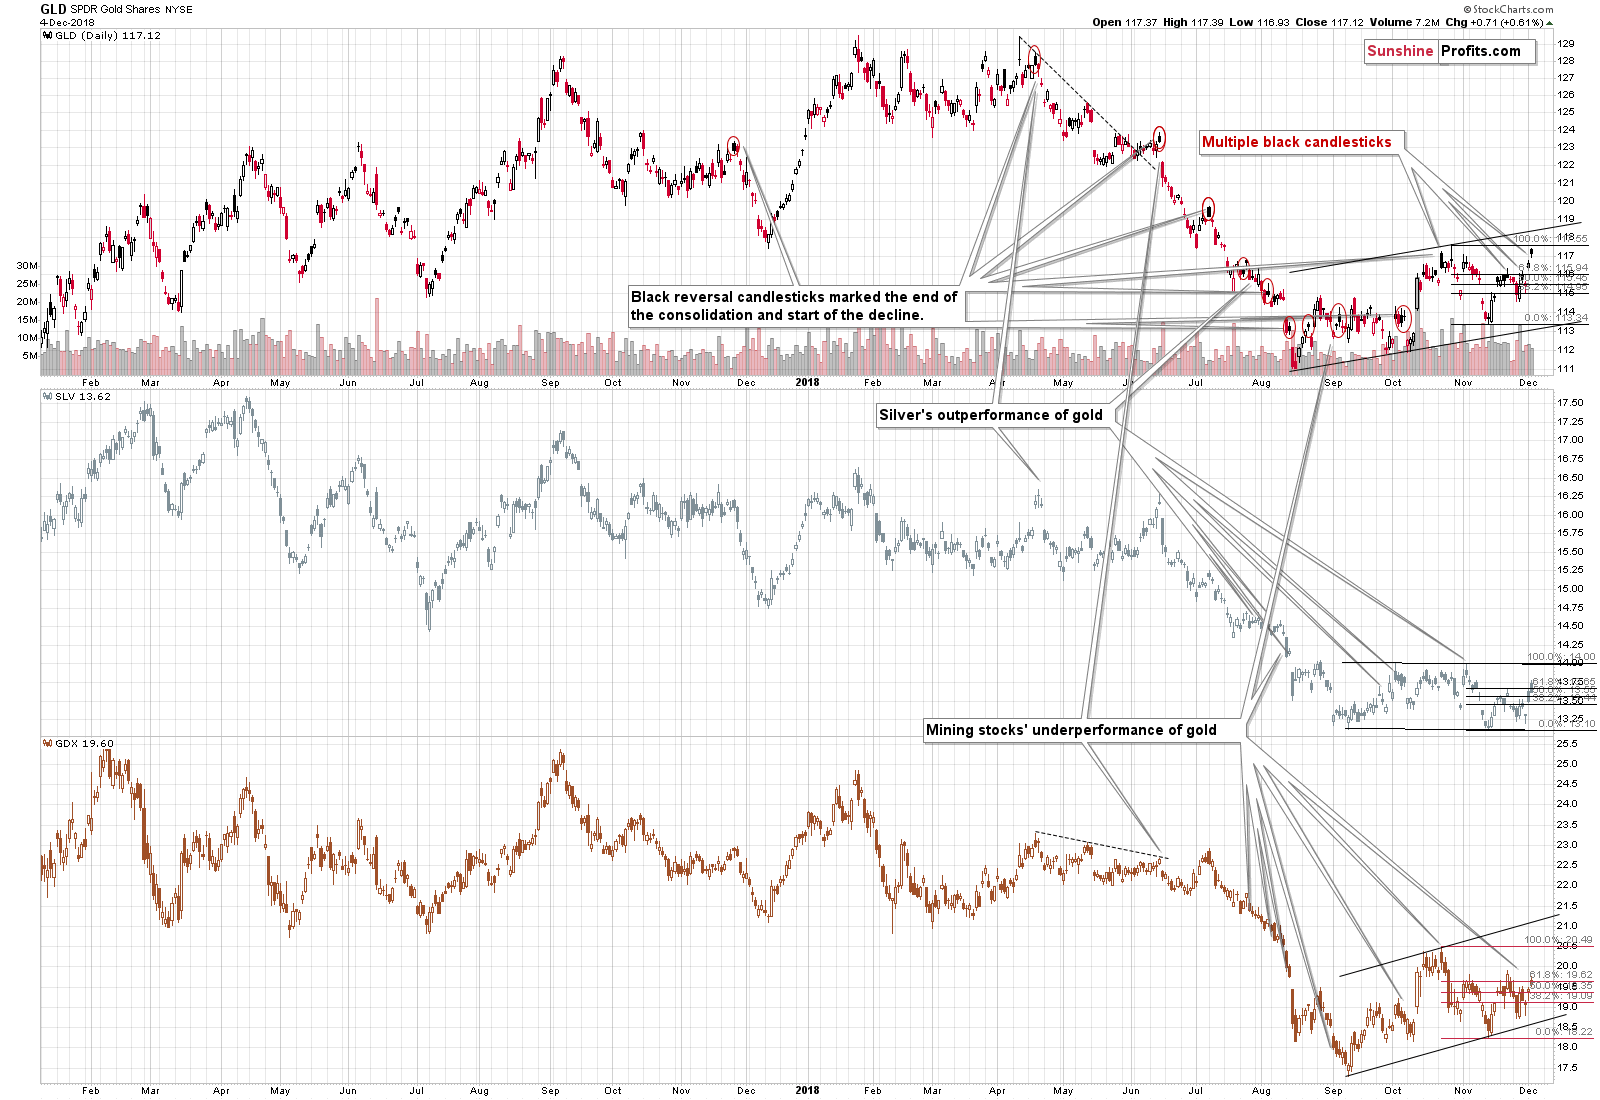
Gold was up by about $7 and the HUI Index moved higher by just 1.01 index point. This means that gold stocks underperformed gold once again.
At the same time, we saw silver perform quite strongly. This relative strength is particularly visible compared to the mining stocks, but not so much with regard to gold, but it’s not surprising in the light of the recent breakout in the gold to silver ratio. Silver may not be willing to perform really well even in the final parts of short-term upswings because of the ratio’s breakout. This means that it may be better to focus on mining stocks underperformance than on silver’s outperformance as far as relative signals are concerned. And the signals from the former are bearish.
Moreover, while gold closed higher, we have seen yet another black candlestick, meaning that gold once again moved higher outside of the regular business hours, but declined during the US session. This means that what we wrote yesterday about these candlesticks remains up-to-date:
(…) series of black candlesticks in the GLD ETF. It’s something that we see at the (prolonged, but still) tops and that we don’t see in the early parts of a rally. Please note how the December rally started. There was only one tiny black candlestick and all the other daily rallies took a regular form, when price rallied also during the US session.
On the other hand, the November 2017 top, the March-April 2018 top, the early June top, the October top were all created by a series of sessions that included several black candlesticks. The current price movement is also accompanied by several black candlesticks, suggesting that the current price action is not a beginning of a new rally, but rather a topping pattern.
Other bearish points that we made earlier this week also remain up-to-date.
Summing up, the outlook for the precious metals market remains very bearish for the following weeks and months and short position remains justified from the risk to reward point of view, even if we see a few extra days of back and forth trading or even a small brief upswing. There is a very high probability of a huge downswing that makes the short position justified, not the outlook for the next few days. The strongly bearish analogies to 2013 and 1999, miners’ underperformance, the number of intraday reversals in the GLD ETF, the triangle-based reversals in gold and silver, the outlook for the USD Index as well as the situation in the gold to palladium ratio are only several of multiple reasons pointing to much lower precious metals’ prices in the near future.
As always, we’ll keep you – our subscribers – informed.
To summarize:
Trading capital (supplementary part of the portfolio; our opinion): Full short positions (250% of the full position) in gold, silver and mining stocks are justified from the risk/reward perspective with the following stop-loss orders and exit profit-take price levels:
- Gold: profit-take exit price: $1,062; stop-loss: $1,257; initial target price for the DGLD ETN: $82.96; stop-loss for the DGLD ETN $49.27
- Silver: profit-take exit price: $12.32; stop-loss: $15.11; initial target price for the DSLV ETN: $47.67; stop-loss for the DSLV ETN $28.37
- Mining stocks (price levels for the GDX ETF): profit-take exit price: $13.12; stop-loss: $20.83; initial target price for the DUST ETF: $80.97; stop-loss for the DUST ETF $27.67
Note: the above is a specific preparation for a possible sudden price drop, it does not reflect the most likely outcome. You will find a more detailed explanation in our August 1 Alert. In case one wants to bet on junior mining stocks’ prices (we do not suggest doing so – we think senior mining stocks are more predictable in the case of short-term trades – if one wants to do it anyway, we provide the details), here are the stop-loss details and target prices:
- GDXJ ETF: profit-take exit price: $17.52; stop-loss: $31.23
- JDST ETF: initial target price: $154.97 stop-loss: $51.78
Long-term capital (core part of the portfolio; our opinion): No positions (in other words: cash)
Insurance capital (core part of the portfolio; our opinion): Full position
Important Details for New Subscribers
Whether you already subscribed or not, we encourage you to find out how to make the most of our alerts and read our replies to the most common alert-and-gold-trading-related-questions.
Please note that the in the trading section we describe the situation for the day that the alert is posted. In other words, it we are writing about a speculative position, it means that it is up-to-date on the day it was posted. We are also featuring the initial target prices, so that you can decide whether keeping a position on a given day is something that is in tune with your approach (some moves are too small for medium-term traders and some might appear too big for day-traders).
Plus, you might want to read why our stop-loss orders are usually relatively far from the current price.
Please note that a full position doesn’t mean using all of the capital for a given trade. You will find details on our thoughts on gold portfolio structuring in the Key Insights section on our website.
As a reminder – “initial target price” means exactly that – an “initial” one, it’s not a price level at which we suggest closing positions. If this becomes the case (like it did in the previous trade) we will refer to these levels as levels of exit orders (exactly as we’ve done previously). Stop-loss levels, however, are naturally not “initial”, but something that, in our opinion, might be entered as an order.
Since it is impossible to synchronize target prices and stop-loss levels for all the ETFs and ETNs with the main markets that we provide these levels for (gold, silver and mining stocks – the GDX ETF), the stop-loss levels and target prices for other ETNs and ETF (among other: UGLD, DGLD, USLV, DSLV, NUGT, DUST, JNUG, JDST) are provided as supplementary, and not as “final”. This means that if a stop-loss or a target level is reached for any of the “additional instruments” (DGLD for instance), but not for the “main instrument” (gold in this case), we will view positions in both gold and DGLD as still open and the stop-loss for DGLD would have to be moved lower. On the other hand, if gold moves to a stop-loss level but DGLD doesn’t, then we will view both positions (in gold and DGLD) as closed. In other words, since it’s not possible to be 100% certain that each related instrument moves to a given level when the underlying instrument does, we can’t provide levels that would be binding. The levels that we do provide are our best estimate of the levels that will correspond to the levels in the underlying assets, but it will be the underlying assets that one will need to focus on regarding the signs pointing to closing a given position or keeping it open. We might adjust the levels in the “additional instruments” without adjusting the levels in the “main instruments”, which will simply mean that we have improved our estimation of these levels, not that we changed our outlook on the markets. We are already working on a tool that would update these levels on a daily basis for the most popular ETFs, ETNs and individual mining stocks.
Our preferred ways to invest in and to trade gold along with the reasoning can be found in the how to buy gold section. Additionally, our preferred ETFs and ETNs can be found in our Gold & Silver ETF Ranking.
As a reminder, Gold & Silver Trading Alerts are posted before or on each trading day (we usually post them before the opening bell, but we don't promise doing that each day). If there's anything urgent, we will send you an additional small alert before posting the main one.
Thank you.
Sincerely,
Przemyslaw Radomski, CFA
Editor-in-chief, Gold & Silver Fund Manager
Gold & Silver Trading Alerts
Forex Trading Alerts
Oil Investment Updates
Oil Trading Alerts

