

Briefly: in our opinion, full (300% of the regular position size) speculative short positions in junior mining stocks are justified from the risk/reward point of view at the moment of publishing this Alert.
What a way to start a year! Gold just faked its comeback before moving to new yearly lows. That’s a very bearish way for a market to start the year.
Given that miners underperformed gold and silver briefly outperformed it, we have a very bearish storm brewing for the next couple of weeks / months.
On Jan 3, I wrote the following:
The year 2021 is over, 2022 has finally arrived. However, why does the current price action look “sooo last year”? Because the patterns appear to be repeating and the clearest similarity is present in the key precious metal – gold itself.
Gold prices moved higher in late December, and it happened on low volume. The rally caused the stochastic indicator to move above 80 and the RSI above 50. That’s exactly what happened in both: late 2021 and late 2020.
What does it mean? Well, it means that we shouldn’t trust this rally, as it could end abruptly, just like the one that we saw a year ago.
Besides, gold corrected 61.8% of the preceding decline (so it moved to its most classic Fibonacci retracement), which means that – technically – what we saw in the past two weeks was just a correction, not the beginning of a new rally.
And what happened next?
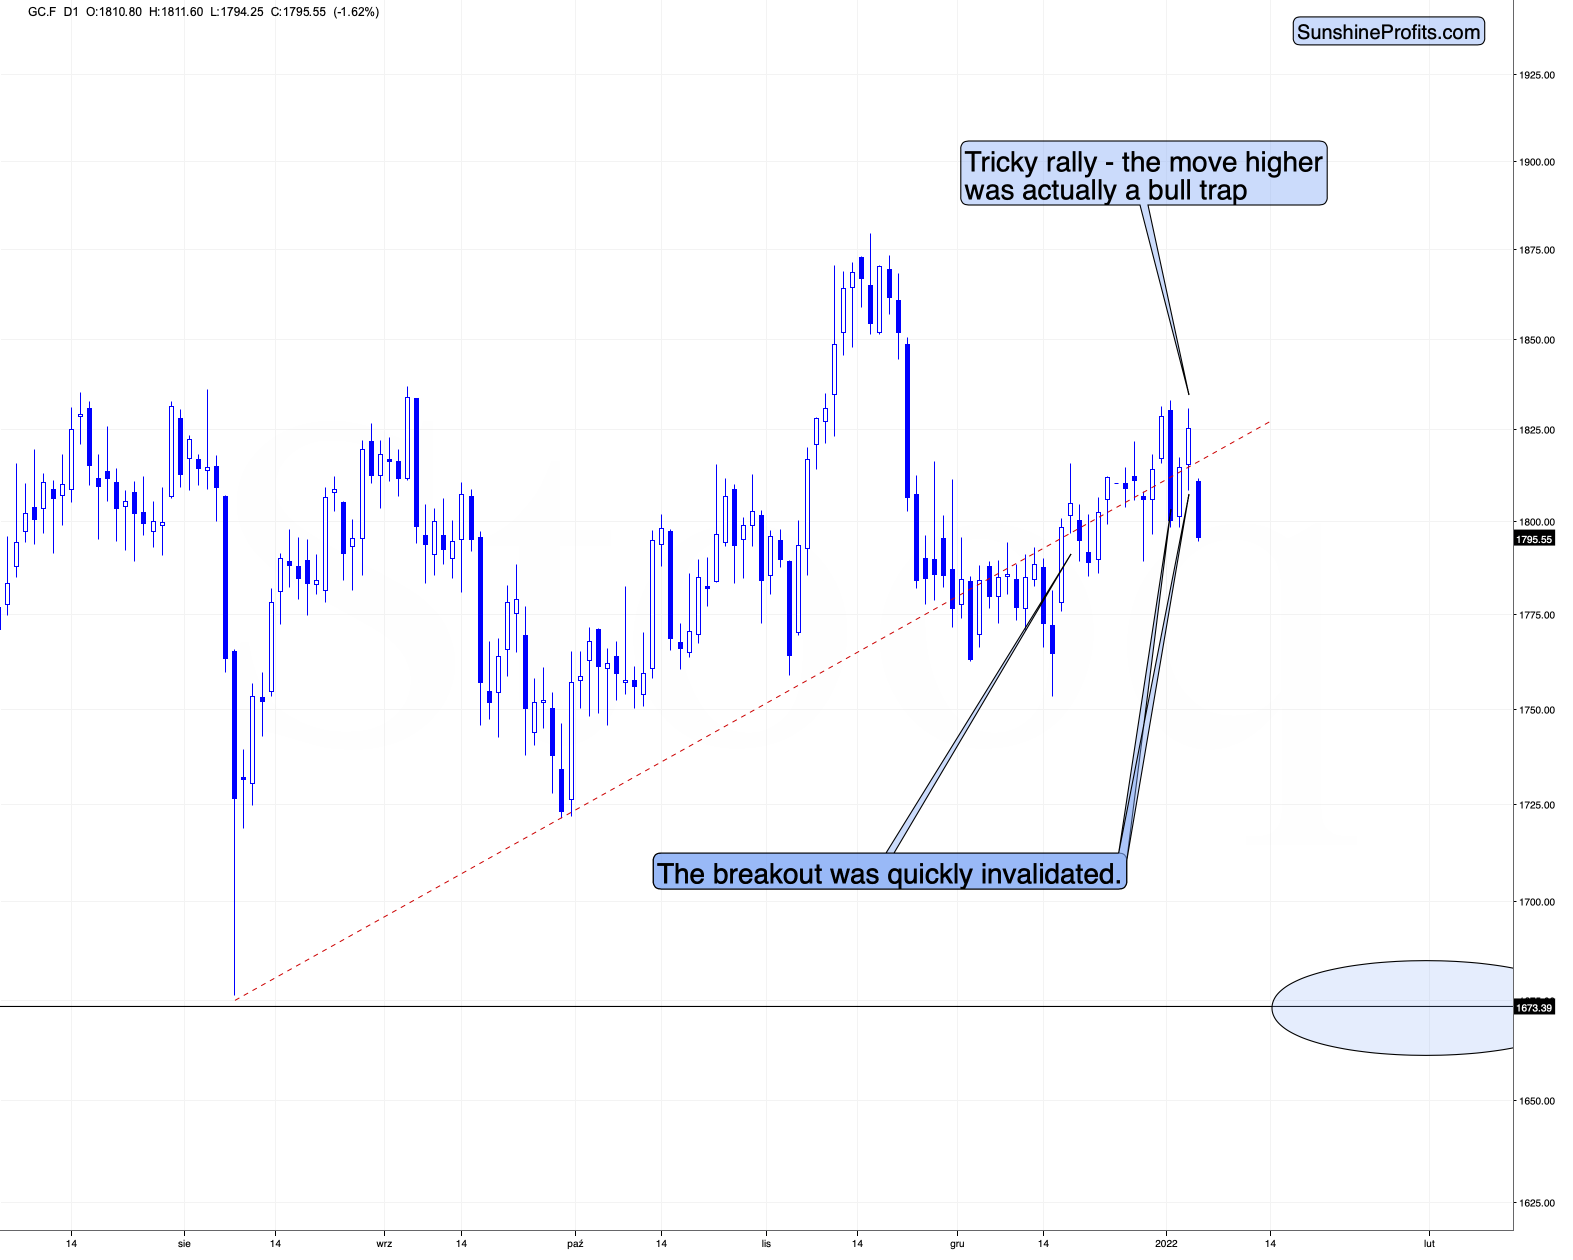
Gold declined, faked its comeback, and then declined again to new yearly lows. 2022 continues to be a down year for gold, and this is particularly revealing, because early January is the time when the buy-backs should – theoretically – happen.
I’m referring to the tendency for investors to exit losing positions (and – in tune with my expectations and against expectations of almost everyone else – 2021 was a down year for gold, silver, and mining stocks, after all) close to the end of the year, in order to harvest the tax loss, and then to get back into the market in early January.
Despite the above tendency, gold is down, silver is down, and mining stocks are down as well.
This shows that the precious metals market is weak (which has been clear since gold invalidated its breakout above the 2011 high in 2020) and is unlikely to soar significantly (in terms of hundreds of dollars) unless it slides first.
Besides, at the beginning of major rallies, gold stocks tend to lead the way up. And right now, it’s exactly the opposite.
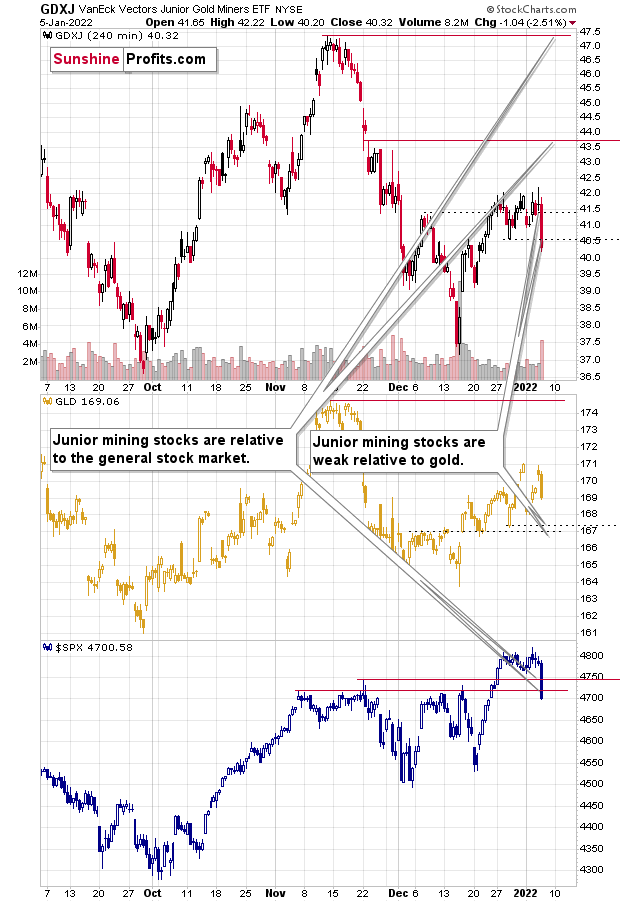
The upper part of the above chart features the GDXJ ETF – proxy for junior mining stocks, the middle part features the GLD ETF – proxy for gold, and the bottom part features the S&P 500 Index.
The red lines compare the previous stock market highs to what happened in junior miners, and the dotted lines show what juniors did when gold formed its recent highs and lows.
In short, junior gold mining stocks are underperforming both: gold, and other stocks.
This is as bearish as it can get, given the current situation regarding the USD Index (which is in a medium-term uptrend) and the situation in the interest rates, which are not only about to go up, but the expectations of them going up are becoming more and more hawkish. And that’s no accident either, as it’s in tune with the current political narrative in the U.S. – inflation is currently presented as the major enemy that needs to be dealt with.
In other words, as the situation in interest rates is likely to become even more hawkish and the USD Index is likely to move higher, gold is likely to go down, and so – eventually – will the general stock market. And since junior mining stocks have already proven over and over again that they magnify declines on both markets, they are likely to fall particularly hard, when the above markets decline. We gained quite a lot based on the decline in the juniors in 2021, but it seems that the gains that could be reaped in 2022 (of course, I can’t and I’m not promising any kind of specific performance for any market) based on junior miners’ decline (and then their revival) could be breathtaking – but as always, only if one is positioned correctly for both major moves.
Having said that, let’s take a look at the markets from a more fundamental angle.
Right on Cue
While the GDXJ ETF’s superficial tranquility lasted for a few weeks, the junior miners suffered a rude awakening on Jan. 5. To explain, with the Fed on its holiday hiatus, the PMs could pretend that 2021’s hawkish realities didn’t exist. However, with the central bank dropping hawkish bombs on Jan. 5, the late-afternoon bloodbath is likely a sign of things to come.
For context, I wrote prior to the release:
While the PMs have enjoyed Fed speakers' holiday quiet period, the fundamentals remain unchanged: the Fed is hawked up, and simmering inflation should result in higher interest rates in the coming months.
Investors have gotten so used to a dovish Fed that they assume Chairman Jerome Powell won’t follow through and raise interest rates. However, with rampant inflation, a hot labor market and a resilient U.S. economy still in play, the PMs may find out the hard way that the Fed isn’t bluffing. As a result, their superficial strength will likely fade, and their price action on Jan. 4 mirrors the tepid confidence they displayed throughout 2021.
To that point, the FOMC released the minutes from its Dec. 14/15 monetary policy meeting on Jan. 5. The report revealed:
“The projection for U.S. consumer price inflation prepared by the staff for the December FOMC meeting was higher than in the November projection. The near-term outlook was revised up, reflecting faster-than-expected increases both for a broad array of consumer prices and for wages.”
As for U.S. economic growth and the labor market:
“Members agreed that with progress on vaccinations and strong policy support, indicators of economic activity and employment had continued to strengthen…. Job gains had been solid in recent months, and the unemployment rate had declined substantially.”
And then, it was time for the hawkish reveal:
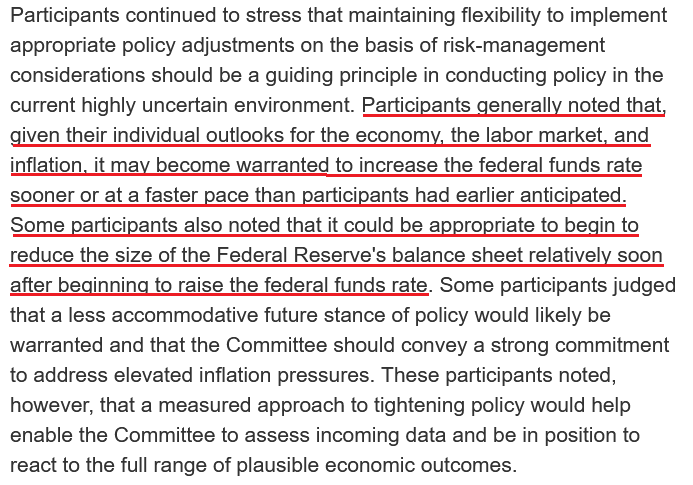 Source: U.S. Fed
Thus, while I’ve been warning for months that interest rates would rise sooner than expected, suddenly, rampant inflation has FOMC officials increasingly open to a “sooner” and/or “faster” tightening cycle. If that wasn’t enough, the minutes revealed:
“Participants generally noted that they were monitoring the incoming data for signs of inflationary pressures associated with the increasingly tight labor market. Acknowledging that the maximum level of employment consistent with price stability may evolve over time, many participants saw the U.S. economy making rapid progress toward the Committee's maximum-employment goal. Several participants viewed labor market conditions as already largely consistent with maximum employment.”
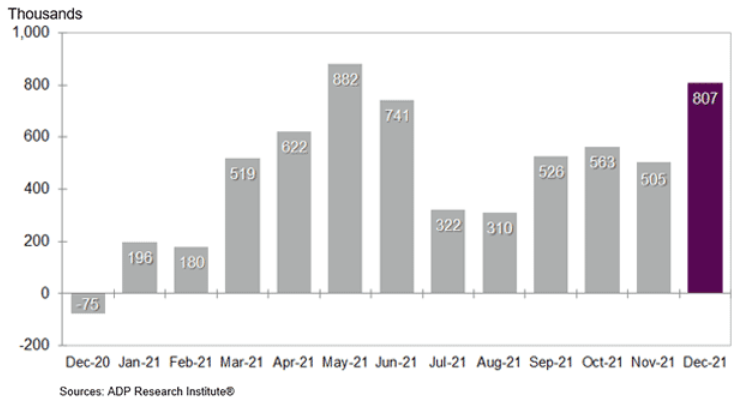
Moreover, while APD’s private payrolls are often a poor predictor of U.S. nonfarm payrolls, the former revealed on Jan. 5 that private employment increased by 807,000 in December – well ahead of the 400,000 expected. As a result, if Fed officials thought the U.S. labor market was “largely consistent with maximum employment” before this data was released, follow-through by U.S. nonfarm payrolls on Jan. 7 could accelerate their hawkish dispositions.
Please see below:
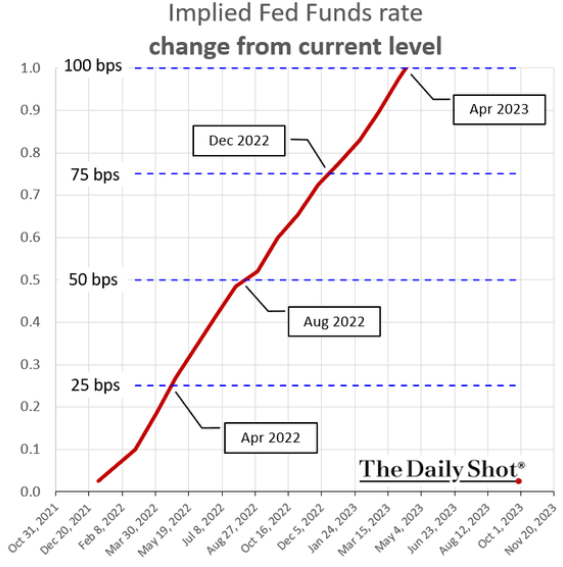
To that point, with the Fed turning up the hawkish temperature, market participants have fully priced in three rate hikes in 2022. For context, investors expect the U.S. Federal Funds Rate to hit 75 basis points (0.75%) by December 2022.
Please see below:
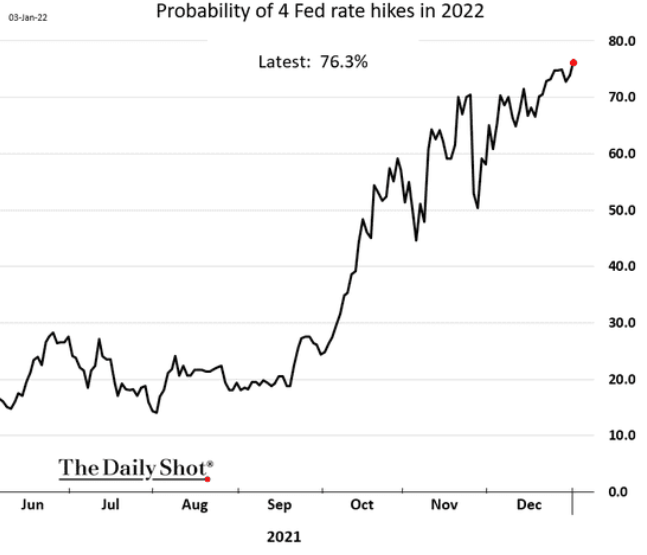
On top of that, the market-implied probability of four rate hikes by the Fed in 2022 has increased to more than 76%.
What’s more, IHS Markit released its U.S. Services PMI on Jan. 5. And while the headline index decreased from 58.0 in November to 57.6 in December, Siân Jones, Senior Economist at IHS Markit, said:
“Service sector business activity growth remained strong in December, supporting indications of a solid uptick in economic growth at the end of 2021. Although the expansion
in output softened slightly, the flow of new orders picked up, with buoyant client demand rising at the fastest pace for five months.”
More importantly, though:
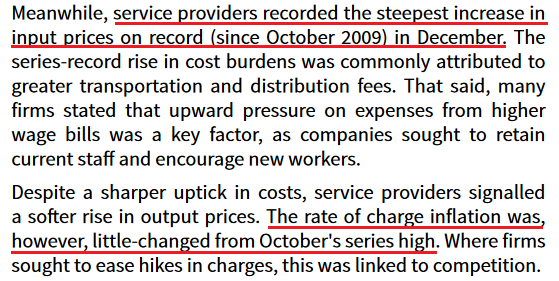 Source: IHS Markit
As a result, with inflation uplifted and the Fed on a hawkish warpath, the GDXJ ETF suffered amid the volatility. Furthermore, while I’ve been writing for months that the U.S. economy is much stronger than pessimists realize, it’s important to remember that a bullish U.S. economy is bearish for the PMs.
For example, the NASDAQ Composite got obliterated on Jan. 5. And with high duration assets – like unprofitable technology companies – highly allergic to higher interest rates, the mauling was far from unexpected. However, please note that the PMs suffer from similar fundamental problems. With interest rates artificially low and inflation artificially high, the PMs can ride the wave of negative real interest rates. However, with the Fed actively fighting inflation and the bond market erupting again on Jan. 5, the PMs now confront a material regime change.
Please see below:
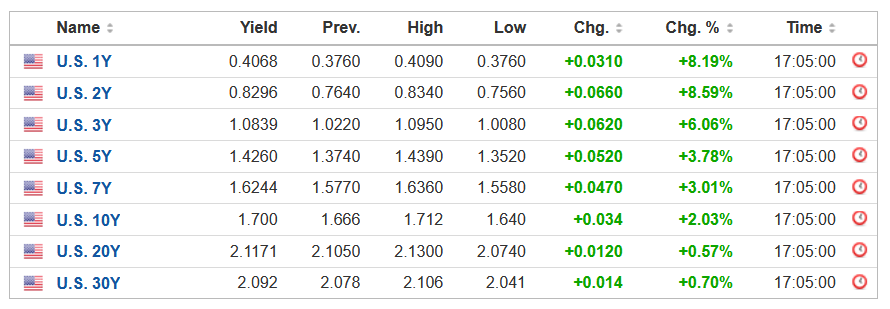 Source: Investing.com
Also noteworthy, I mentioned on Jan. 3 that Morgan Stanley’s “US Cycle Indicator” signals a resilient U.S. economy. I wrote:
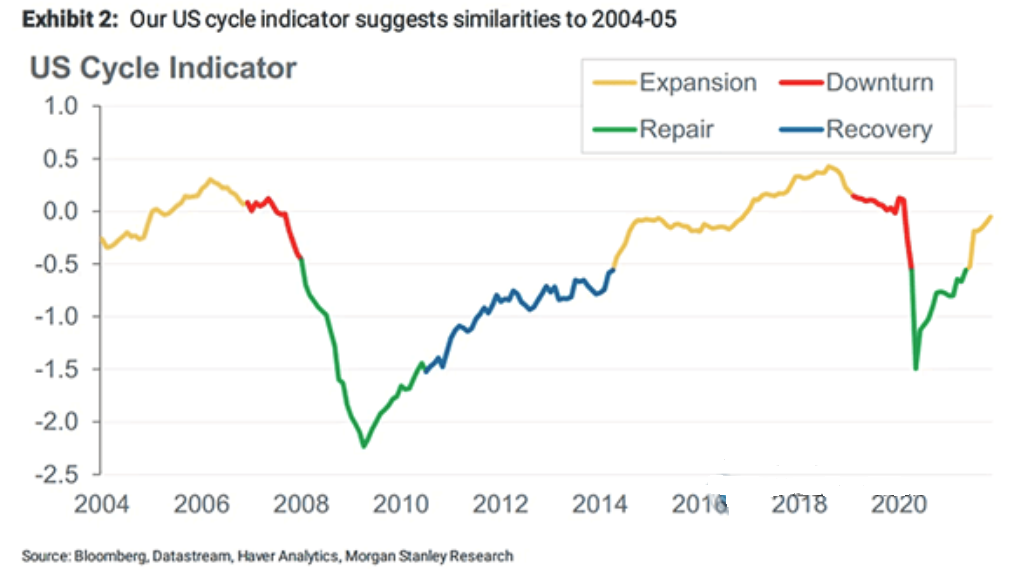
To explain, the yellow (expansion), red (downturn), green (repair) and blue (recovery) lines above track the health, or lack thereof, of the U.S. economy. And if you analyze the right side of the chart, you can see that the yellow line signals that the U.S. economy is still expanding. As a result, the Fed has few reasons not to tighten monetary policy over the next few months.
And supporting that claim, KKR – one of the largest private equity firms in the world – revealed that its “Macro Regime Indicator” still signals a mid-cycle expansion. For context, the reading occurs when KKR’s U.S. economic indicators are above their long-term trends relative to their trailing six-month averages.
Please see below:
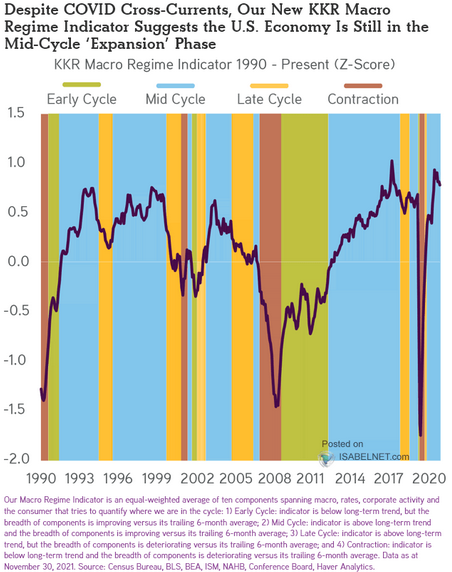
To explain, the green (early cycle), light blue (mid cycle), orange (late cycle) and red (contraction) color blocks above contrast KKR’s interpretation of the U.S. business cycle. If you analyze the block furthest to the right, you can see that light blue still dominates. Thus, as I wrote on Jan. 3, the Fed has few reasons not to tighten monetary policy over the next few months.
Finally, it’s important to remember that the Fed’s tightening cycles often end with climactic events. And while we’re only in the early innings of QE’s exile, it shouldn’t take long for three or four rate hikes to elicit material panic on Wall Street.
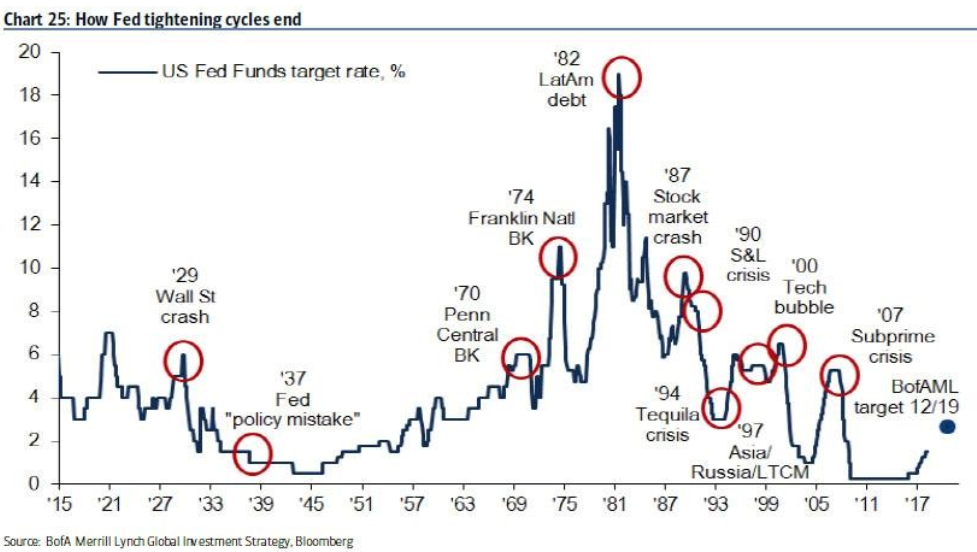
To explain, Bank of America highlighted various crises that erupted when the Fed took away the liquidity punch bowl. And whether it’s the 1929 depression, the 1987 flash crash or the 2000 dot-com bubble, volatility spikes when the Fed increases the U.S. Federal Funds Rate. As a result, the PMs are unlikely to escape the anxiety that confronts investors in 2022.
The bottom line? While I warned that tapering and interest rate hikes would come much sooner than investors expected, the latter’s reality is fast-approaching. And with the PMs ill-equipped to deal with higher interest rates – and more importantly, higher real interest rates – their swan songs are playing off in the distance. However, while their prospective corrections will likely be ferocious, they should present us with solid long-term buying opportunities.
In conclusion, the market’s mudslide swept away the GDXJ ETF on Jan. 5. And while gold and silver exhibited relative strength, more daily flash crashes will likely hit sooner rather than later. Furthermore, while the USD Index rallied back above 96 amid the drama, the greenback remains materially undervalued. As a result, with a stronger USD Index and higher U.S. Treasury yields poised to dominate the headlines in 2022, the PMs will likely head in the opposite direction.
Overview of the Upcoming Part of the Decline
- It seems to me that while the corrective upswing might still continue, it might not be significant in the case of junior mining stocks. After the corrective upswing is over, I think that gold will decline once again taking silver and mining stocks lower as well.
- It seems that the first stop for gold will be close to its previous 2021 lows, slightly below $1,700. Then it will likely correct a bit, but it’s unclear if I want to exit or reverse the current short position based on that – it depends on the number and the nature of the bullish indications that we get at that time.
- After the above-mentioned correction, we’re likely to see a powerful slide, perhaps close to the 2020 low ($1,450 - $1,500).
- If we see a situation where miners slide in a meaningful and volatile way while silver doesn’t (it just declines moderately), I plan to – once again – switch from short positions in miners to short positions in silver. At this time, it’s too early to say at what price levels this could take place, and if we get this kind of opportunity at all – perhaps with gold close to $1,600.
- I plan to exit all remaining short positions once gold shows substantial strength relative to the USD Index while the latter is still rallying. This may be the case with gold close to $1,350 - $1,400. I expect silver to fall the hardest in the final part of the move. This moment (when gold performs very strongly against the rallying USD and miners are strong relative to gold after its substantial decline) is likely to be the best entry point for long-term investments, in my view. This can also happen with gold close to $1,375, but at the moment it’s too early to say with certainty.
- As a confirmation for the above, I will use the (upcoming or perhaps we have already seen it?) top in the general stock market as the starting point for the three-month countdown. The reason is that after the 1929 top, gold miners declined for about three months after the general stock market started to slide. We also saw some confirmations of this theory based on the analogy to 2008. All in all, the precious metals sector is likely to bottom about three months after the general stock market tops.
- The above is based on the information available today, and it might change in the following days/weeks.
You will find my general overview of the outlook for gold on the chart below:
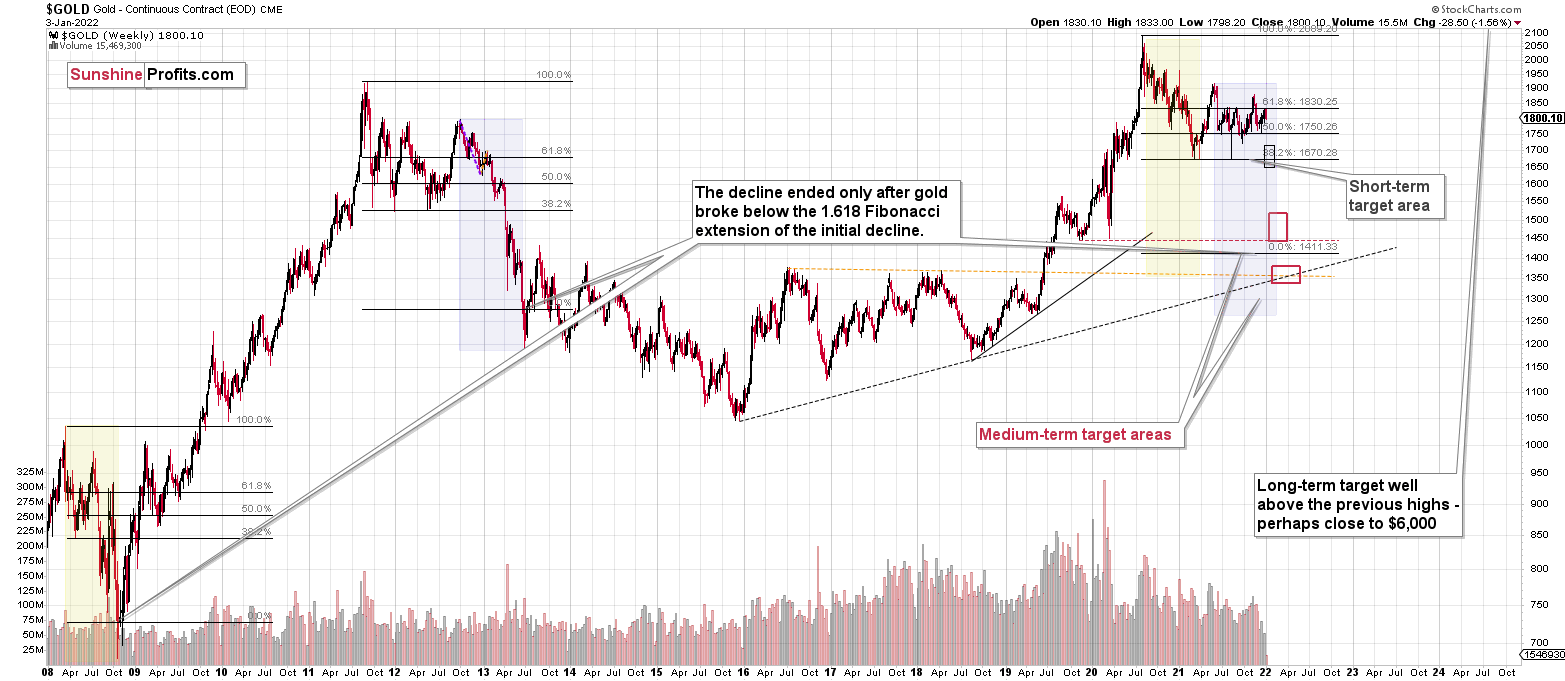
Please note that the above timing details are relatively broad and “for general overview only” – so that you know more or less what I think and how volatile I think the moves are likely to be – on an approximate basis. These time targets are not binding or clear enough for me to think that they should be used for purchasing options, warrants or similar instruments.
Summary
Summing up, it seems to me that while the corrective upswing might still continue, it might not be significant in the case of junior mining stocks. After the corrective upswing is over, I think that gold will decline once again, taking silver and mining stocks lower as well.
From the medium-term point of view, the key two long-term factors remain the analogy to 2013 in gold and the broad head and shoulders pattern in the HUI Index. They both suggest much lower prices ahead.
It seems that our profits from the short positions are going to become truly epic in the following months.
After the sell-off (that takes gold to about $1,350 - $1,500), I expect the precious metals to rally significantly. The final part of the decline might take as little as 1-5 weeks, so it's important to stay alert to any changes.
Most importantly, please stay healthy and safe. We made a lot of money last March and this March, and it seems that we’re about to make much more on the upcoming decline, but you have to be healthy to enjoy the results.
As always, we'll keep you - our subscribers - informed.
To summarize:
Trading capital (supplementary part of the portfolio; our opinion): Full speculative short positions (300% of the full position) in junior mining stocks are justified from the risk to reward point of view with the following binding exit profit-take price levels:
Mining stocks (price levels for the GDXJ ETF): binding profit-take exit price: $35.73; stop-loss: none (the volatility is too big to justify a stop-loss order in case of this particular trade)
Alternatively, if one seeks leverage, we’re providing the binding profit-take levels for the JDST (2x leveraged) and GDXD (3x leveraged – which is not suggested for most traders/investors due to the significant leverage). The binding profit-take level for the JDST: $16.18; stop-loss for the JDST: none (the volatility is too big to justify a SL order in case of this particular trade); binding profit-take level for the GDXD: $32.08; stop-loss for the GDXD: none (the volatility is too big to justify a SL order in case of this particular trade).
For-your-information targets (our opinion; we continue to think that mining stocks are the preferred way of taking advantage of the upcoming price move, but if for whatever reason one wants / has to use silver or gold for this trade, we are providing the details anyway.):
Silver futures downside profit-take exit price: $19.12
SLV profit-take exit price: $17.72
ZSL profit-take exit price: $41.38
Gold futures downside profit-take exit price: $1,683
HGD.TO – alternative (Canadian) inverse 2x leveraged gold stocks ETF – the upside profit-take exit price: $12.48
HZD.TO – alternative (Canadian) inverse 2x leveraged silver ETF – the upside profit-take exit price: $30.48
Long-term capital (core part of the portfolio; our opinion): No positions (in other words: cash
Insurance capital (core part of the portfolio; our opinion): Full position
Whether you already subscribed or not, we encourage you to find out how to make the most of our alerts and read our replies to the most common alert-and-gold-trading-related-questions.
Please note that we describe the situation for the day that the alert is posted in the trading section. In other words, if we are writing about a speculative position, it means that it is up-to-date on the day it was posted. We are also featuring the initial target prices to decide whether keeping a position on a given day is in tune with your approach (some moves are too small for medium-term traders, and some might appear too big for day-traders).
Additionally, you might want to read why our stop-loss orders are usually relatively far from the current price.
Please note that a full position doesn't mean using all of the capital for a given trade. You will find details on our thoughts on gold portfolio structuring in the Key Insights section on our website.
As a reminder - "initial target price" means exactly that - an "initial" one. It's not a price level at which we suggest closing positions. If this becomes the case (like it did in the previous trade), we will refer to these levels as levels of exit orders (exactly as we've done previously). Stop-loss levels, however, are naturally not "initial", but something that, in our opinion, might be entered as an order.
Since it is impossible to synchronize target prices and stop-loss levels for all the ETFs and ETNs with the main markets that we provide these levels for (gold, silver and mining stocks - the GDX ETF), the stop-loss levels and target prices for other ETNs and ETF (among other: UGL, GLL, AGQ, ZSL, NUGT, DUST, JNUG, JDST) are provided as supplementary, and not as "final". This means that if a stop-loss or a target level is reached for any of the "additional instruments" (GLL for instance), but not for the "main instrument" (gold in this case), we will view positions in both gold and GLL as still open and the stop-loss for GLL would have to be moved lower. On the other hand, if gold moves to a stop-loss level but GLL doesn't, then we will view both positions (in gold and GLL) as closed. In other words, since it's not possible to be 100% certain that each related instrument moves to a given level when the underlying instrument does, we can't provide levels that would be binding. The levels that we do provide are our best estimate of the levels that will correspond to the levels in the underlying assets, but it will be the underlying assets that one will need to focus on regarding the signs pointing to closing a given position or keeping it open. We might adjust the levels in the "additional instruments" without adjusting the levels in the "main instruments", which will simply mean that we have improved our estimation of these levels, not that we changed our outlook on the markets. We are already working on a tool that would update these levels daily for the most popular ETFs, ETNs and individual mining stocks.
Our preferred ways to invest in and to trade gold along with the reasoning can be found in the how to buy gold section. Furthermore, our preferred ETFs and ETNs can be found in our Gold & Silver ETF Ranking.
As a reminder, Gold & Silver Trading Alerts are posted before or on each trading day (we usually post them before the opening bell, but we don't promise doing that each day). If there's anything urgent, we will send you an additional small alert before posting the main one.
Thank you.
Przemyslaw Radomski, CFA
Founder, Editor-in-chief

