

Briefly: in our opinion, full (300% of the regular position size) speculative short positions in junior mining stocks are justified from the risk/reward point of view at the moment of publishing this Alert.
Gold rallied by almost $10 yesterday, while the stock market reversed and ended the session in the green. Why did miners decline anyway?
Because they’re weak, that’s why. This is because there is a medium-term downtrend in them. In fact, let’s keep in mind that it was only gold that managed to break above the 2011 highs – neither silver nor mining stocks got even close to similar price levels. Thus, has the real bull market in the precious metals sector begun yet? No, it hasn’t. It was only gold that caught people’s attention, and only temporarily so.
The fact is that despite the open-ended QE, historically low interest rates for years, and a global pandemic that triggered world-wide lockdowns, gold was unable to hold the breakout above its 2011 high. If this doesn’t make you suspicious about the real strength of the gold bull market, then I don’t know what would.
Let’s check the HUI Index – the flagship proxy for gold stocks – and see where the gold miners are.
After all, gold stocks tend to perform exceptionally well at the beginning of massive bull markets. For example, that was the case between 2000 and 2002.
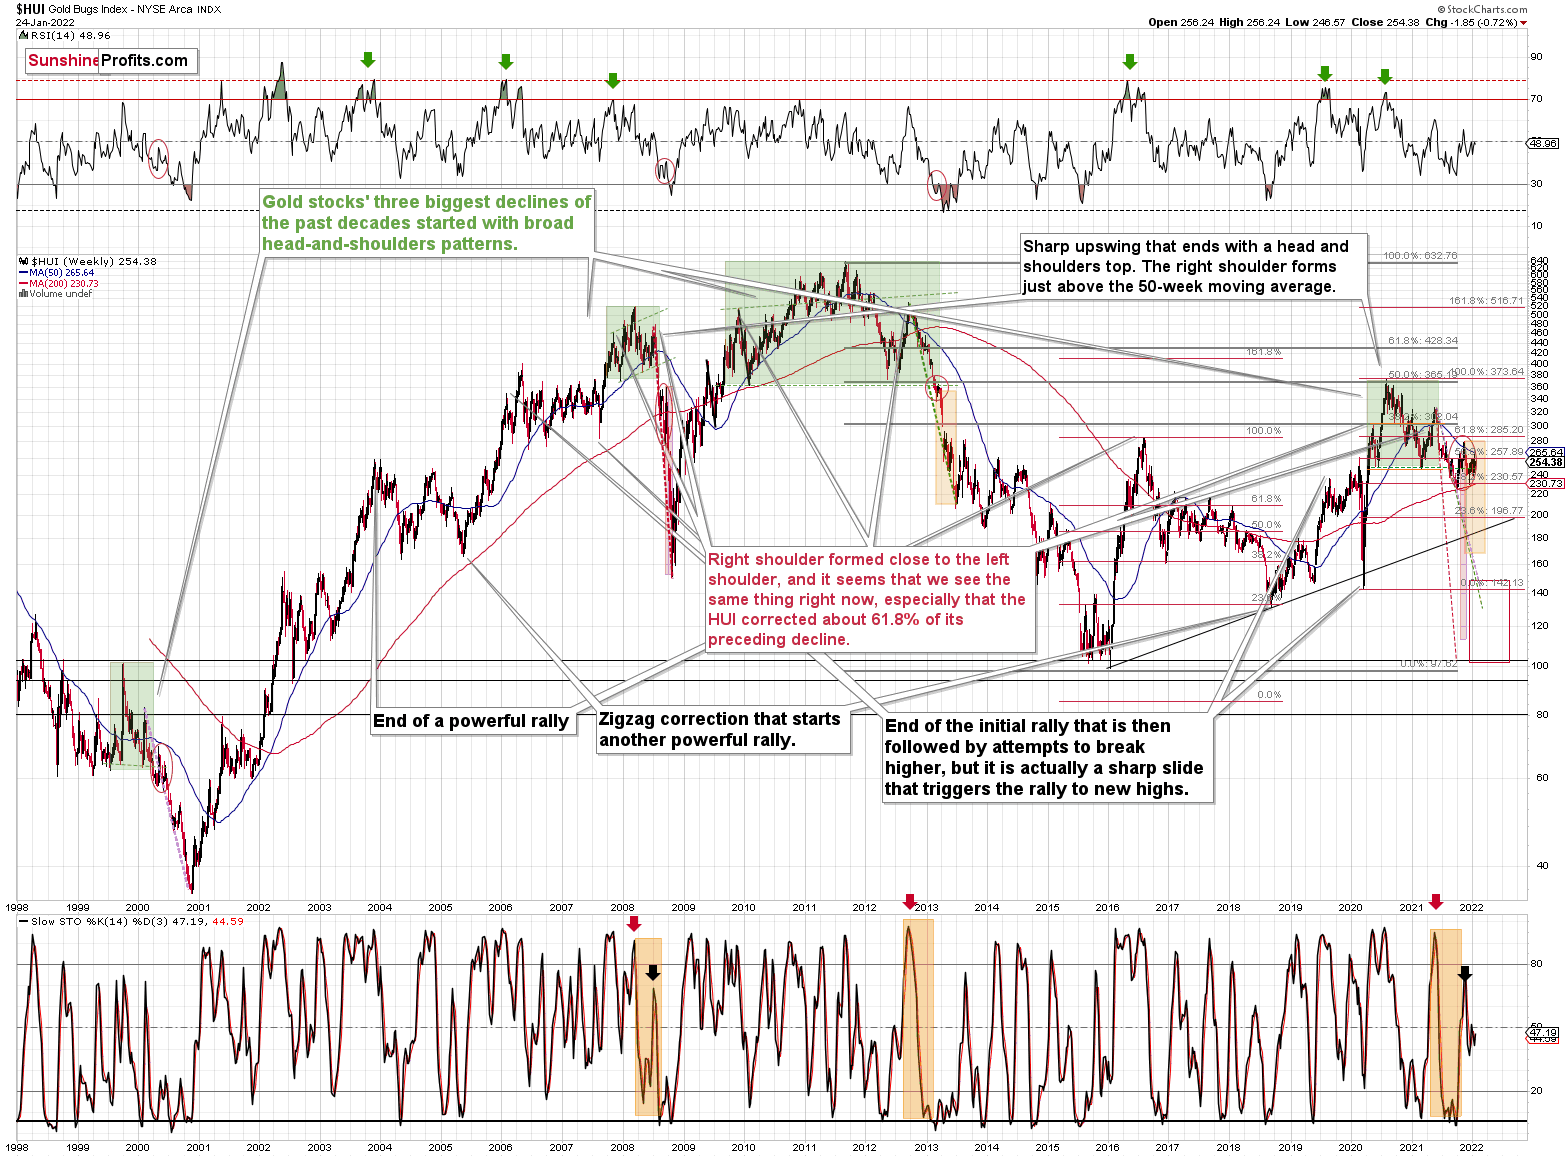
Between its 2000 low and 2002 high, the HUI Index rallied by over 300%, while gold rallied by less than 40%. Now that’s outperformance!
Now, between the bottoms of 2015 and 2016, gold is up by 75%, and the HUI Index is up by about 150%. There is still some leverage (several times less!), but if we compare that to the sizes of the declines and the risk in general, things are much worse.
Gold is now over $400 above its 2016 high. The HUI Index is below its 2016 high.
The HUI Index is below its 2008 high.
In fact, the HUI Index is now even below its 2003 highs! Can you imagine that? Well, you don’t have to imagine it because these are the facts. However, please think about it: gold rallied from about $400 to about $1,800 – more than quadrupling its price, and gold stocks are trading lower.
Based on similarities from previous patterns that were preceded by massive head-and-shoulders formations (marked with green), we can expect to see a massive decline, and the long-term weakness of gold stocks vs. gold provides an excellent background for such a slide.
Want reasons of a more fundamental nature? The rates are going up in the U.S. but not that much in the rest of the world. Consequently, the real interest rates are going up in the U.S. and the same is likely for the USD Index. The two key headwinds for gold are about to blow at full strength.
While gold is likely to decline, given the weakness that gold stocks have been proving over and over again, they are likely to truly slide in such an environment. In particular, junior mining stocks, which have proven to be most vulnerable during the 2020 slide, and also during the recent (and this year’s) declines.
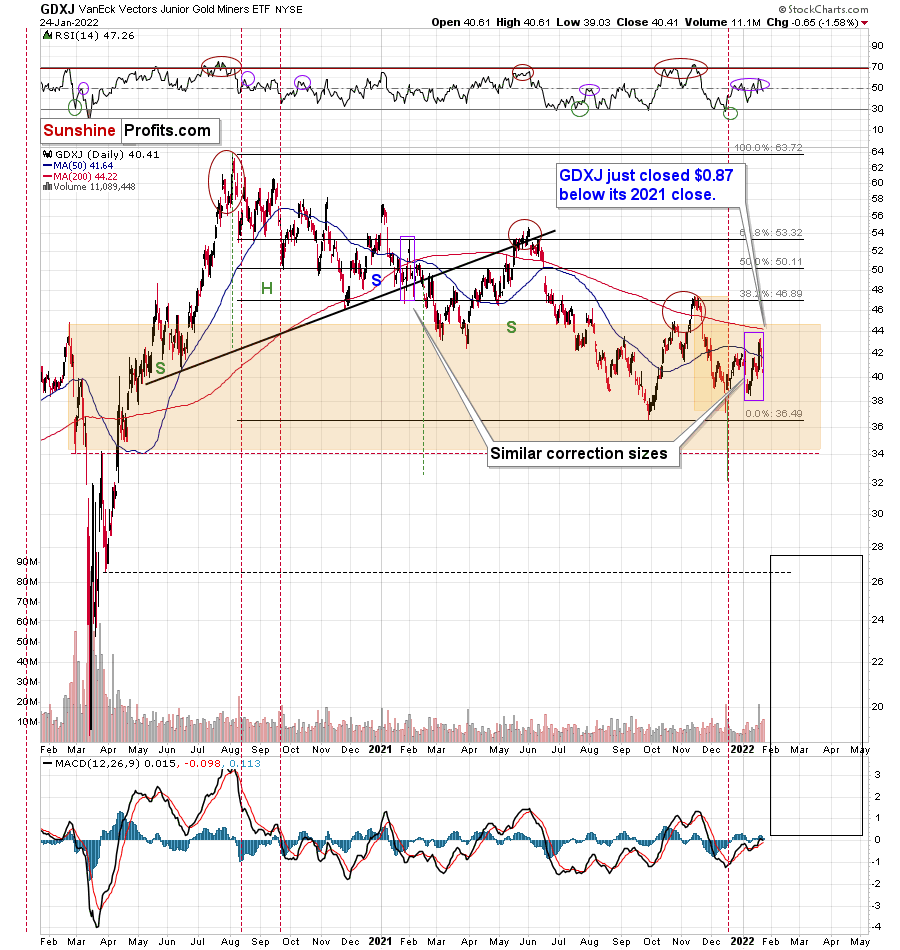
The GDXJ ETF – a proxy for junior mining stocks – declined and reversed some of its declines before the end of the day. This might appear bullish, until you factor in the following facts:
- gold closed the day almost $10 higher;
- the general stock market ended the day higher.
Consequently, mining stocks should have rallied yesterday, but instead they declined by over 1.5% anyway. This underperformance is bearish. Period.
Please note the broad red rectangle that I placed on the above chart. It’s there to illustrate the size of the initial 2020 decline.
Yes, junior miners are already below the price levels from which the 2020 started, and if they simply decline as much as they declined back then (so, I’m not asking for anything “completely new” to happen), they could be at $34 in a matter of days.
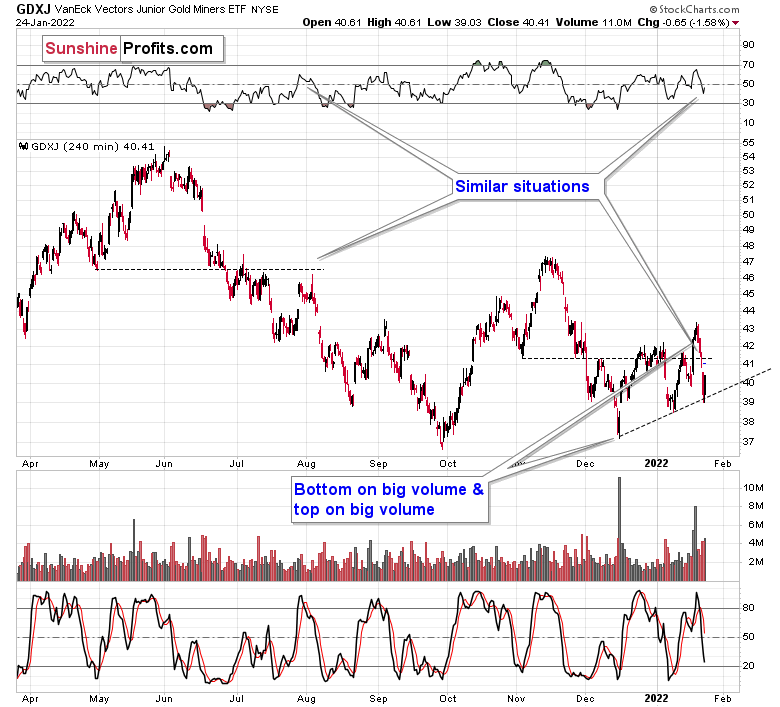
For now, junior miners bounced off of their rising support line, but this doesn’t change the fact that they greatly underperformed gold and the general stock market, which means that the implications of yesterday’s session are bearish.
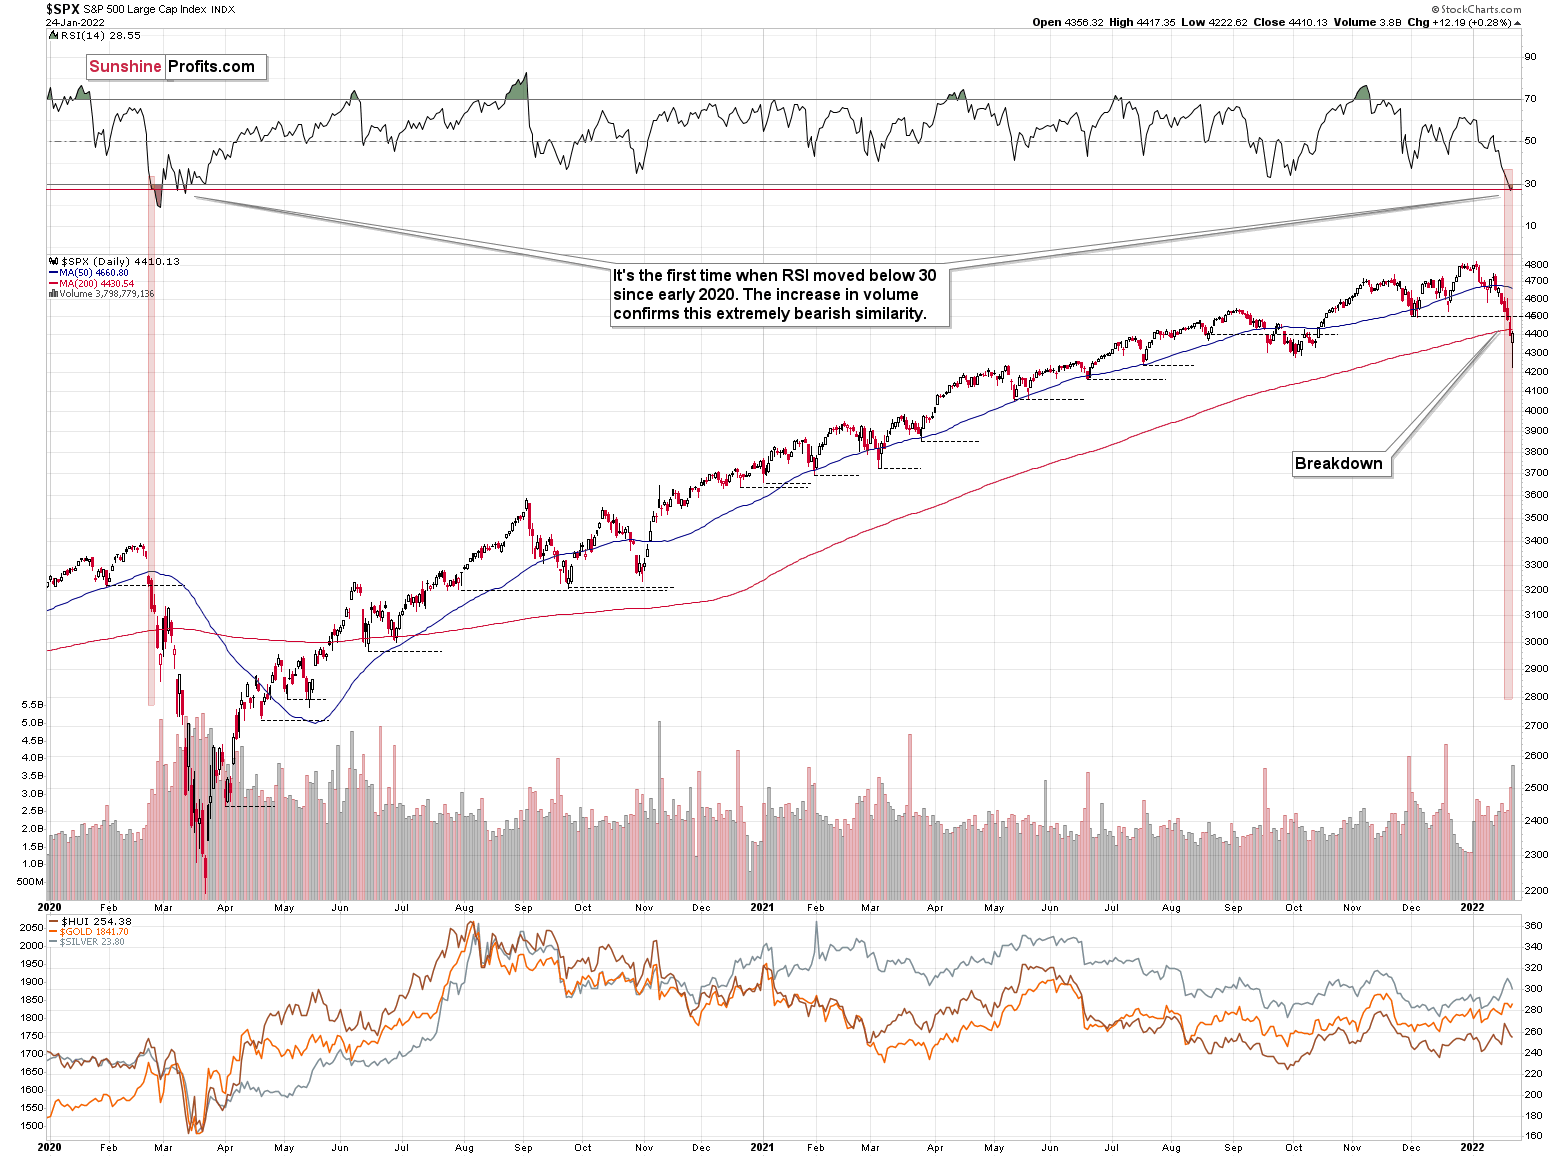
As I mentioned earlier, the S&P 500 declined and then rallied back up yesterday. The daily reversal took place on huge volume, which is bullish at its face value.
On the other hand, however, let’s keep in mind that the early-2020 decline had days of hesitation too. On Feb. 26, 2020, the S&P 500 also moved back and forth, closing only slightly lower. Declines resumed on the following day.
Looking at the RSI, we see that once this indicator moved below 30, it (and the S&P 500 itself) kept declining until it moved below 20. That’s not what happened yesterday.
Also, the initial decline in 2020 took the S&P 500 lower by over 15% before we saw a small corrective upswing. The 2022 decline took the S&P 500 down by a bit over 12%, including yesterday’s intraday low. If history repeats itself to a significant degree, we could see even lower stock market prices before seeing a more visible rebound.
On the other hand, seeing a rebound right away wouldn’t be likely to change anything – it seems that an even bigger, medium-term decline is already underway.
Yes, RSI below 30 is generally considered oversold territory, but the direct analogies take precedence over the “usual” way in which things work in markets in general. In this case, the situation could get from oversold to extremely oversold. Let’s keep in mind that stocks declined very sharply in 2020.
One could say that times were different, but were they really? The key difference is that the monetary authorities are now already after the bullish money-printing cycle and are handling inflation by aiming to increase interest rates, while they had been preparing to cut them in 2020.
The situation regarding the pandemic is not that different either. Sure, back in 2020, it was all new, we had massive lockdowns and there was great uncertainty regarding… pretty much everything. Now, the situation is not entirely unexpected, but given the explosive nature of new COVID-19 cases (likely due to the Omicron variant), it’s still quite new and uncertain.
The uncertainty is not as great as it was back in 2020, but then again, now we’re facing monetary tightening, not dramatic dovish actions. Thus, I wouldn’t exclude a situation in which we really see a repeat of the early-2020 performance, where the declines are sharp and huge. The technicals in the precious metals market have been pointing to that outcome for months, anyway, especially the long-term HUI Index chart that I’ve been discussing previously.
Having said that, let’s take a look at the situation from the fundamental point of view.
Damned if You Do, Damned if You Don’t
While I’ve been warning for a long time that the GDXJ ETF is caught between the vortex of 2008 and 2013, the junior miners continue to suffer from competing forces. On the one hand, if the general stock market plunges, shades of 2008 could sink the GDXJ ETF. Conversely, if U.S. Treasury yields keep rising, the 2013 analog could rear its ugly head.
While we got a taste of the former on Jan. 24, it’s important to remember that the GDXJ ETF still underperformed the S&P 500. For example, while the latter rallied back from its intraday plunge to close 0.28% higher, the GDXJ ETF still closed 1.58% lower. As a result, dip buyers weren’t very enthusiastic about the junior miners.
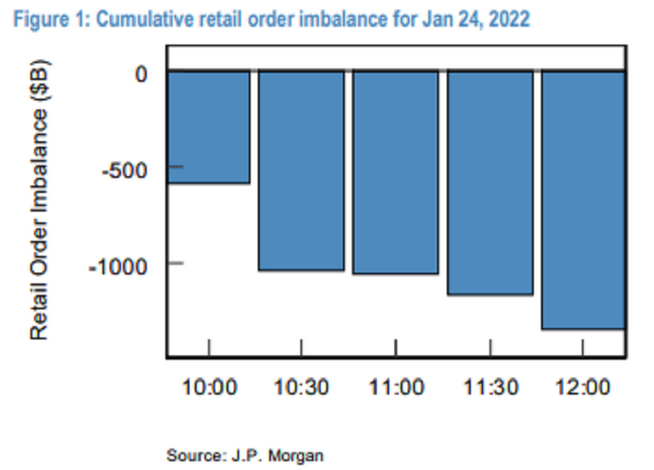
To that point, data from J.P. Morgan shows that retail investors capitulated on Jan. 24. For example, the investment bank’s prime desk revealed that retail investors offloaded a net $1.36 billion worth of stocks by noon. Moreover, the selling pressure was 3.9 standard deviations above the 12-month daily average.
Please see below:
On the flip side, while retail investors couldn’t stand the volatility, institutional investors swooped in and bought the dip. As a result, large asset managers helped reverse the roughly 4% to 5% drops in the S&P 500 and the NASDAQ 100.
Please see below:
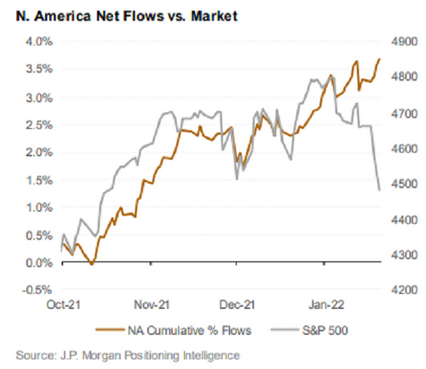
To explain, the gray line above tracks the S&P 500, while the brown line above tracks the cumulative percentage flows into North American stocks. If you analyze the right side of the chart, you can see that the sharp drop in the S&P 500 hasn’t coincided with money-manager panic. In contrast, when the S&P 500 sold off in December, North American net-flows sank along with it.
As a result, with retail investors bailing and institutional investors buying, American stock market indices roared back from the dead. However, the GDXJ ETF did not. As such, institutional investors were not as eager to buy the GDXJ ETF, and it’s another sign that a 2008-style collapse could be extremely beneficial to our short position.
However, while a re-enactment of 2008 remains plausible, the 2013 analog is still the most likely outcome. Why is that? Well, with institutional investors undeterred by the recent fear, the major players didn’t mirror retail’s anxiety either. For context, J.P. Morgan flow analysts wrote on Jan. 24 that “unlike in early December, we have not seen a significant decline in [hedge funds’] net leverage most recently, which has historically been a good tactical indicator. The recent levels of leverage do not suggest a very risk-off tone yet.”
Second, and more importantly, the U.S. 10-Year Treasury yield has yawned at the recent volatility.
Please see below:
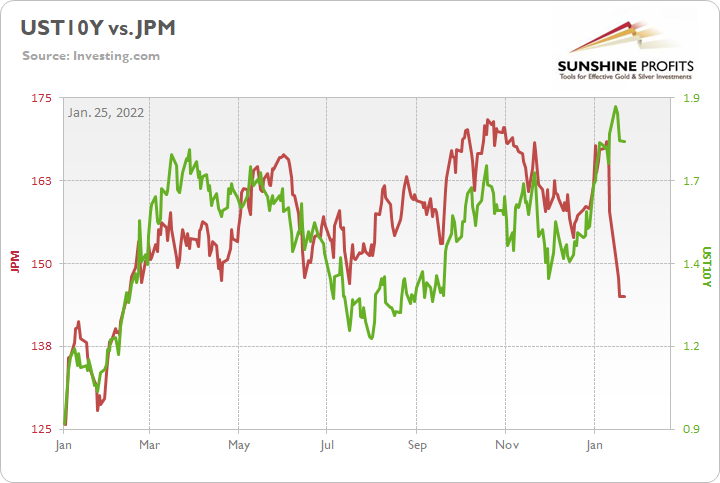
To explain, the green line above tracks the U.S. 10-Year Treasury yield since the beginning of 2021, while the red line above tracks J.P. Morgan's stock. If you analyze the relationship, you can see that the pair often rises and falls together.
For context, the fundamental relationship is present because banks lend money at the long end and borrow money at the short end. Moreover, when long-term interest rates rise, it increases banks' future net interest spreads. As a result, investors often buy banks when long-term interest rates rise and sell banks when long-term interest rates fall.
If you focus your attention on J.P. Morgan's material underperformance on the right side of the chart, you can see that investors' anxiety has crushed the largest bank in the U.S. However, the U.S. 10-Year Treasury yield has held firm. As a result, while the Treasury benchmark dropped alongside J.P Morgan when Delta and the Omicron variants hit, bond investors aren't participating this time around.
To that point, while the recent panic has investors fearing a potential recession, it's important to remember that the U.S. 10-Year Treasury yield often declines in advance of recessions. With the Treasury benchmark still in an uptrend, the fundamental math doesn't add up to an economic collapse.
Please see below:
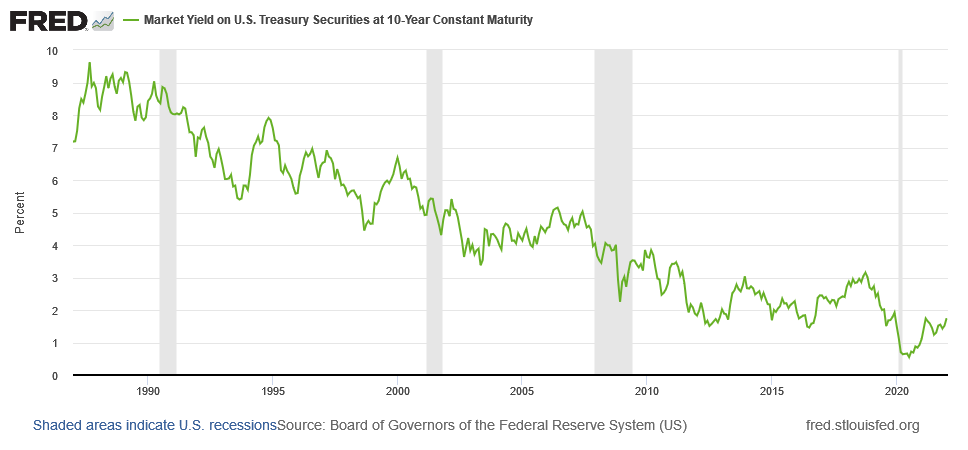
To explain, the green line above tracks the U.S. 10-Year Treasury yield and the shaded gray areas depict U.S. recessions. If you analyze the patterns, notice how the U.S. 10-Year Treasury yield often rolls over before the U.S. economy (like prior to the 2008 recession)? With the Treasury benchmark not plunging alongside equities, it’s another sign that the U.S. economy remains resilient.
As further evidence, IHS Markit released its U.S. Composite PMI on Jan. 24 and, as expected, the Omicron variant has hurt U.S. economic activity and the service sector has been the hardest hit. However, the report also revealed:
“Although output was constricted by the Omicron wave, demand growth remained more resilient. New orders for goods and services continued to rise strongly, albeit registering the weakest rise since December 2020.”
Likewise:
“Despite challenging labor market conditions, firms were able to expand their workforce numbers in January. The rise in employment was only modest, however, with backlogs of work increasing solidly again. That said, the upturn in outstanding business was the slowest since March 2021 as some firms noted efforts to clear work-in-hand.”
Thus, all things considered, the outlook remains relatively upbeat. Furthermore, while input inflation “softened again in January,” output inflation remains an issue.
Please see below:
 Source: HIS Markit
The bottom line? The Jan. 24 session was another example of how the GDXJ ETF is stuck between a rock and a hard place. If the general stock market plunges, the junior miners often underperform. However, if the general stock market rallies and interest rates follow, the GDXJ ETF also often underperforms.
Moreover, I’ve highlighted on numerous occasions that a bullish U.S. economy is bearish for the PMs and the NASDAQ Composite. First, both asset classes are highly allergic to higher interest rates. With the long end of the U.S. yield curve supporting the notion of a resilient U.S. economy, the bond market does not expect a 2008-style collapse.
Second, a resilient U.S. economy keeps the pressure on the Fed, and while the general stock market may be begging for more QE, that’s the opposite of what the U.S. economy needs right now. As a result, the 2013 analog remains the most likely outcome. However, regardless of which scenario unfolds for the GDXJ ETF, both are examples of ‘damned if you do, damned if you don’t’.
In conclusion, the PMs were mixed on Jan. 24, though, the GDXJ ETF was a noticeable underperformer (again). With the USD Index finding its footing and the U.S. 10-Year Treasury yield wanting to move higher, the PMs’ fundamental outlooks remain profoundly bearish. Moreover, if the general stock market does plunge like in 2008, that scenario should also be materially unkind to the PMs.
Overview of the Upcoming Part of the Decline
- It seems to me that the corrective upswing is over or close to being over, and that gold, silver, and mining stocks are now likely to continue their medium-term decline.
- It seems that the first (bigger) stop for gold will be close to its previous 2021 lows, slightly below $1,700. Then it will likely correct a bit, but it’s unclear if I want to exit or reverse the current short position based on that – it depends on the number and the nature of the bullish indications that we get at that time.
- After the above-mentioned correction, we’re likely to see a powerful slide, perhaps close to the 2020 low ($1,450 - $1,500).
- If we see a situation where miners slide in a meaningful and volatile way while silver doesn’t (it just declines moderately), I plan to – once again – switch from short positions in miners to short positions in silver. At this time, it’s too early to say at what price levels this could take place, and if we get this kind of opportunity at all – perhaps with gold close to $1,600.
- I plan to exit all remaining short positions once gold shows substantial strength relative to the USD Index while the latter is still rallying. This may be the case with gold close to $1,350 - $1,400. I expect silver to fall the hardest in the final part of the move. This moment (when gold performs very strongly against the rallying USD and miners are strong relative to gold after its substantial decline) is likely to be the best entry point for long-term investments, in my view. This can also happen with gold close to $1,375, but at the moment it’s too early to say with certainty.
- As a confirmation for the above, I will use the (upcoming or perhaps we have already seen it?) top in the general stock market as the starting point for the three-month countdown. The reason is that after the 1929 top, gold miners declined for about three months after the general stock market started to slide. We also saw some confirmations of this theory based on the analogy to 2008. All in all, the precious metals sector is likely to bottom about three months after the general stock market tops.
- The above is based on the information available today, and it might change in the following days/weeks.
You will find my general overview of the outlook for gold on the chart below:
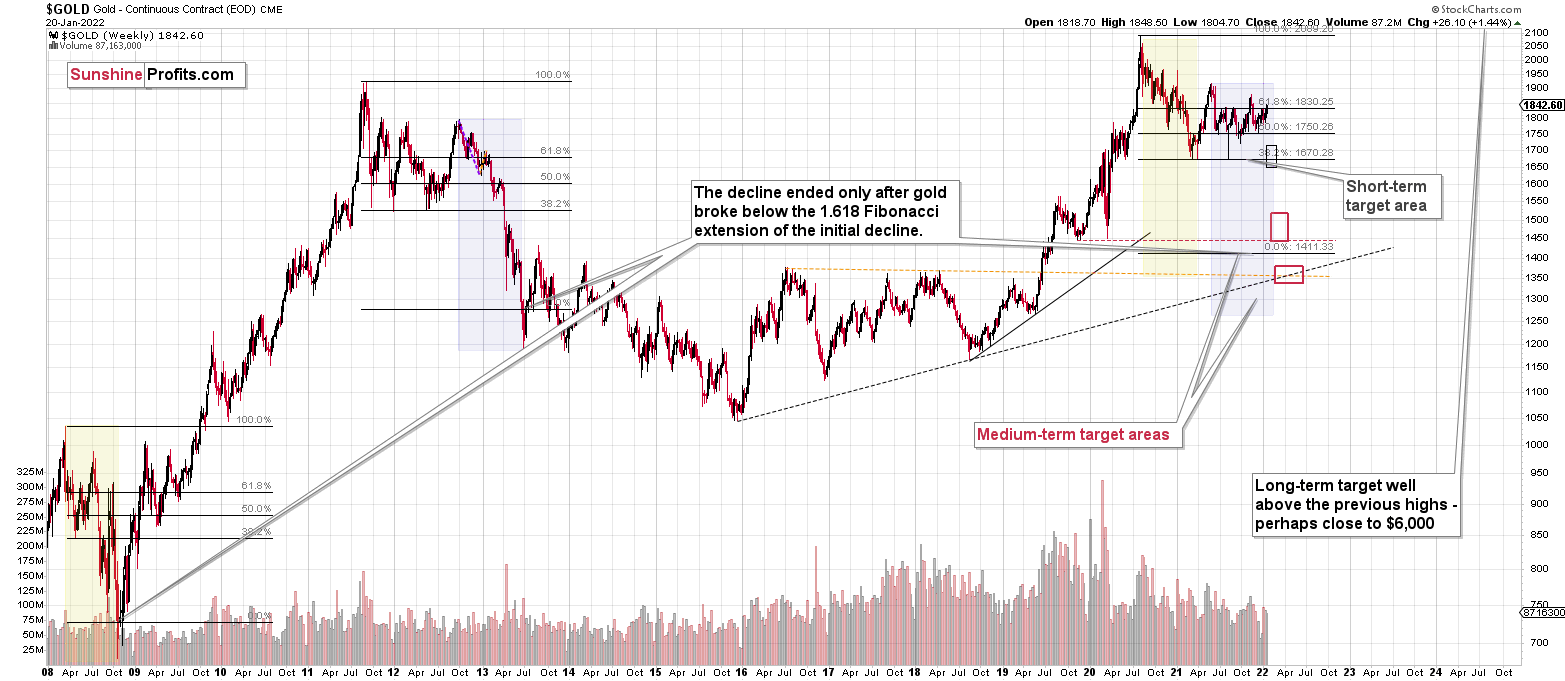
Please note that the above timing details are relatively broad and “for general overview only” – so that you know more or less what I think and how volatile I think the moves are likely to be – on an approximate basis. These time targets are not binding or clear enough for me to think that they should be used for purchasing options, warrants or similar instruments.
Summary
Summing up, it seems to me that the corrective upswing is over or very close to being over, and that gold, silver, and mining stocks are now likely to continue their medium-term decline (note: silver might continue to outperform and rally for a few more days – it’s practically impossible to tell how high it can go in the very near term, but either way, it’s likely that this decline will be reversed rather quickly).
Please note that if last week’s rally was indeed based on supposedly increased tensions regarding Ukraine, then it’s likely that this rally is not going to be significant, and it might already be over. The “supposedly shocking” news already hit the market, and without any real follow-up (material) action, like Russian troops marching across the border with Ukraine, it seems that there’s nothing additional that markets could rally on. The market already “knows” that the tensions are very high and the chance for military conflict is high, regardless of whether that’s true or not. There’s not much more that can be said to increase that even further – only real action is likely to do it – and seeing such action is very unlikely in my view.
I continue to think that junior mining stocks are currently likely to decline the most out of all parts of the precious metals sector.
From the medium-term point of view, the key two long-term factors remain the analogy to 2013 in gold and the broad head and shoulders pattern in the HUI Index. They both suggest much lower prices ahead.
It seems that our profits from the short positions are going to become truly epic in the following months.
After the sell-off (that takes gold to about $1,350 - $1,500), I expect the precious metals to rally significantly. The final part of the decline might take as little as 1-5 weeks, so it's important to stay alert to any changes.
Most importantly, please stay healthy and safe. We made a lot of money last March and this March, and it seems that we’re about to make much more on the upcoming decline, but you have to be healthy to enjoy the results.
As always, we'll keep you - our subscribers - informed.
To summarize:
Trading capital (supplementary part of the portfolio; our opinion): Full speculative short positions (300% of the full position) in junior mining stocks are justified from the risk to reward point of view with the following binding exit profit-take price levels:
Mining stocks (price levels for the GDXJ ETF): binding profit-take exit price: $35.73; stop-loss: none (the volatility is too big to justify a stop-loss order in case of this particular trade)
Alternatively, if one seeks leverage, we’re providing the binding profit-take levels for the JDST (2x leveraged) and GDXD (3x leveraged – which is not suggested for most traders/investors due to the significant leverage). The binding profit-take level for the JDST: $16.18; stop-loss for the JDST: none (the volatility is too big to justify a SL order in case of this particular trade); binding profit-take level for the GDXD: $32.08; stop-loss for the GDXD: none (the volatility is too big to justify a SL order in case of this particular trade).
For-your-information targets (our opinion; we continue to think that mining stocks are the preferred way of taking advantage of the upcoming price move, but if for whatever reason one wants / has to use silver or gold for this trade, we are providing the details anyway.):
Silver futures downside profit-take exit price: $19.12
SLV profit-take exit price: $17.72
ZSL profit-take exit price: $41.38
Gold futures downside profit-take exit price: $1,683
HGD.TO – alternative (Canadian) inverse 2x leveraged gold stocks ETF – the upside profit-take exit price: $12.48
HZD.TO – alternative (Canadian) inverse 2x leveraged silver ETF – the upside profit-take exit price: $30.48
Long-term capital (core part of the portfolio; our opinion): No positions (in other words: cash
Insurance capital (core part of the portfolio; our opinion): Full position
Whether you already subscribed or not, we encourage you to find out how to make the most of our alerts and read our replies to the most common alert-and-gold-trading-related-questions.
Please note that we describe the situation for the day that the alert is posted in the trading section. In other words, if we are writing about a speculative position, it means that it is up-to-date on the day it was posted. We are also featuring the initial target prices to decide whether keeping a position on a given day is in tune with your approach (some moves are too small for medium-term traders, and some might appear too big for day-traders).
Additionally, you might want to read why our stop-loss orders are usually relatively far from the current price.
Please note that a full position doesn't mean using all of the capital for a given trade. You will find details on our thoughts on gold portfolio structuring in the Key Insights section on our website.
As a reminder - "initial target price" means exactly that - an "initial" one. It's not a price level at which we suggest closing positions. If this becomes the case (like it did in the previous trade), we will refer to these levels as levels of exit orders (exactly as we've done previously). Stop-loss levels, however, are naturally not "initial", but something that, in our opinion, might be entered as an order.
Since it is impossible to synchronize target prices and stop-loss levels for all the ETFs and ETNs with the main markets that we provide these levels for (gold, silver and mining stocks - the GDX ETF), the stop-loss levels and target prices for other ETNs and ETF (among other: UGL, GLL, AGQ, ZSL, NUGT, DUST, JNUG, JDST) are provided as supplementary, and not as "final". This means that if a stop-loss or a target level is reached for any of the "additional instruments" (GLL for instance), but not for the "main instrument" (gold in this case), we will view positions in both gold and GLL as still open and the stop-loss for GLL would have to be moved lower. On the other hand, if gold moves to a stop-loss level but GLL doesn't, then we will view both positions (in gold and GLL) as closed. In other words, since it's not possible to be 100% certain that each related instrument moves to a given level when the underlying instrument does, we can't provide levels that would be binding. The levels that we do provide are our best estimate of the levels that will correspond to the levels in the underlying assets, but it will be the underlying assets that one will need to focus on regarding the signs pointing to closing a given position or keeping it open. We might adjust the levels in the "additional instruments" without adjusting the levels in the "main instruments", which will simply mean that we have improved our estimation of these levels, not that we changed our outlook on the markets. We are already working on a tool that would update these levels daily for the most popular ETFs, ETNs and individual mining stocks.
Our preferred ways to invest in and to trade gold along with the reasoning can be found in the how to buy gold section. Furthermore, our preferred ETFs and ETNs can be found in our Gold & Silver ETF Ranking.
As a reminder, Gold & Silver Trading Alerts are posted before or on each trading day (we usually post them before the opening bell, but we don't promise doing that each day). If there's anything urgent, we will send you an additional small alert before posting the main one.
Thank you.
Przemyslaw Radomski, CFA
Founder, Editor-in-chief

