

Briefly: in our opinion, full (300% of the regular position size) speculative short positions in junior mining stocks are justified from the risk/reward point of view at the moment of publishing this Alert.
While we usually post longer analyses on Fridays, this week, we posted the bigger analysis yesterday. Since nothing really changed on the technical front during both yesterday’s and today’s pre-market trading, practically everything that I wrote yesterday remains up-to-date. If you haven’t had the chance to read my yesterday’s analysis so far, I encourage you to do so today.
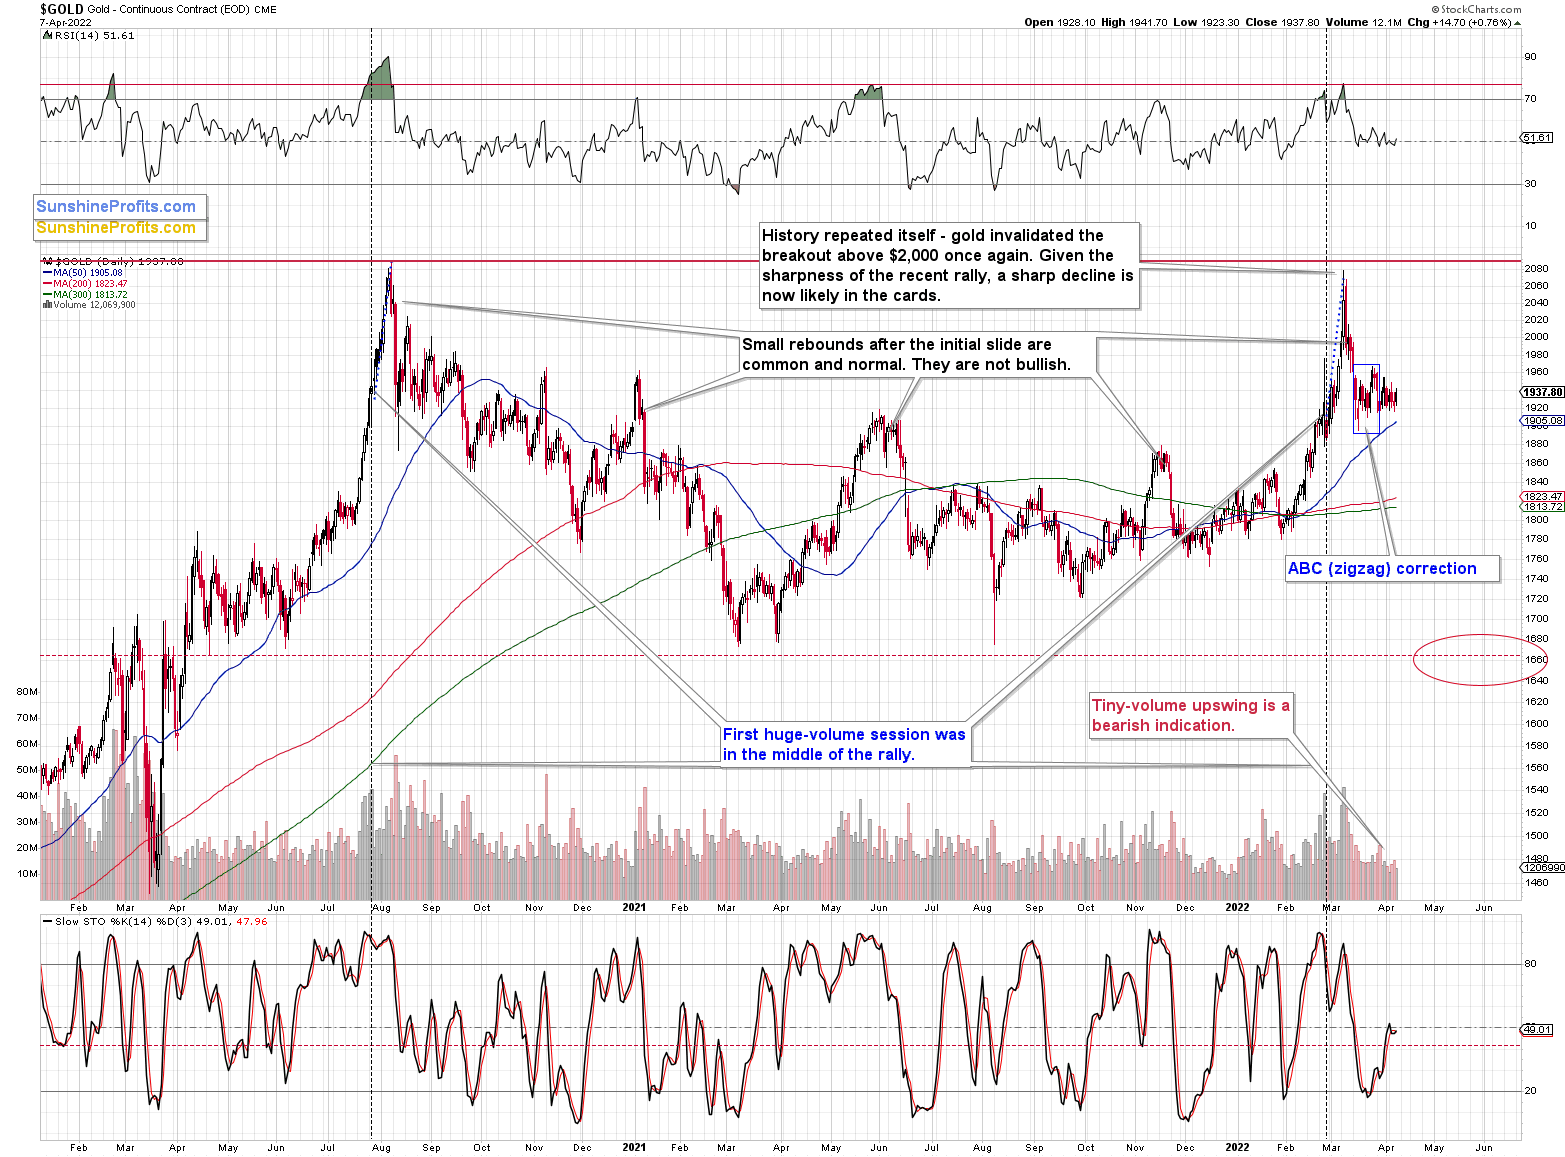
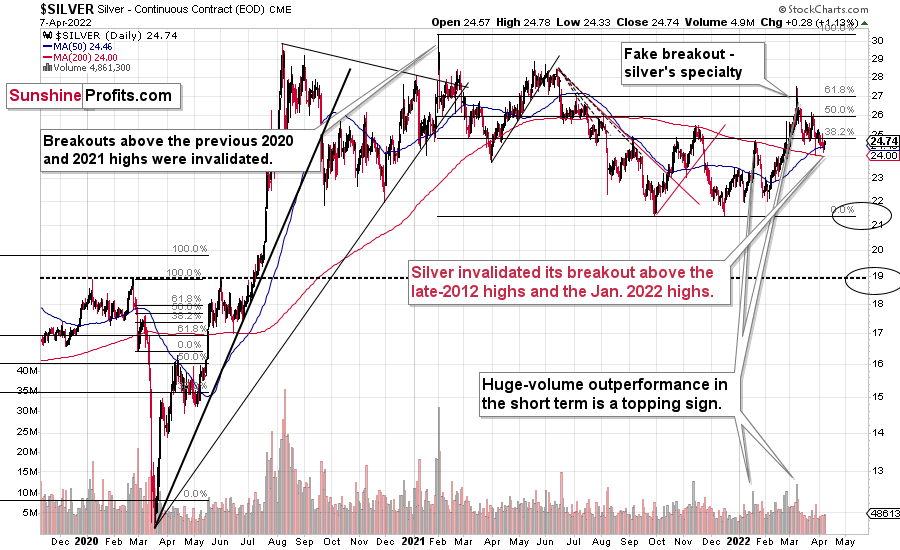
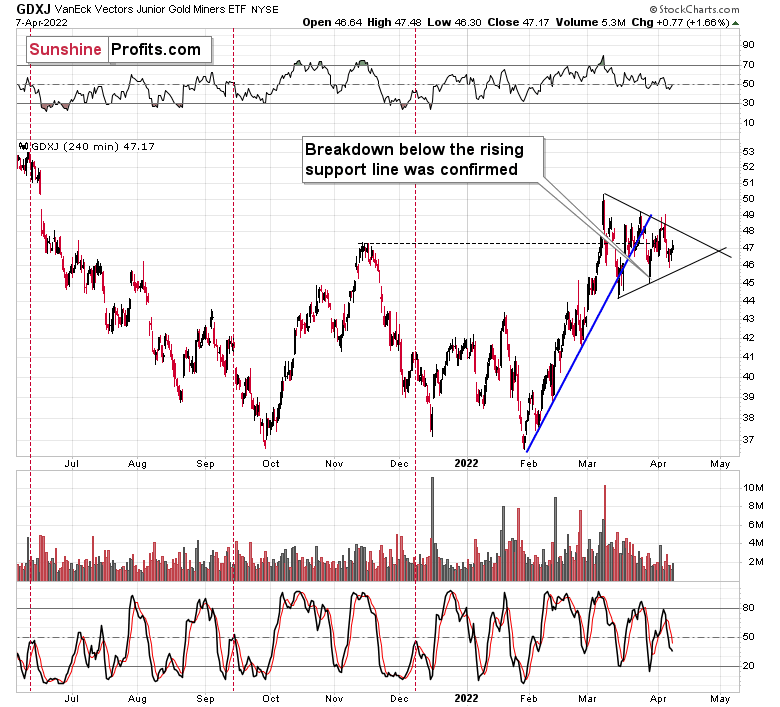
As you can see on the above charts, gold, silver, and mining stocks haven’t really done anything. They ended the day slightly higher, but not high enough to really change anything.
One notable detail is that the GDXJ once again closed above its late-2021 highs, but since all previous attempts to break above this level were invalidated, and since this move was not clear (yesterday’s close was just a few cents above the Nov. 2021 high in terms of the closing prices), I don’t view it as bullish. Especially that it formed at a very low volume. Breakouts – if they are to be viewed as important – should be accompanied by huge volume and we saw the opposite.
Having said that, let’s take a look at the markets from the fundamental point of view.
The Momentum Trade
With the bond market unhinged and equities pretending that all is well, the PMs look like the cleanest shirts in the basket of dirty laundry. For example, bond prices often move inversely to stock prices. When stocks fall, bonds are bid, and the latter serves as a hedge against uncertainty and volatility.
However, with inflation raging and the Fed hawked up, bond prices have been falling, yields have been rising, and risk-on/risk-off sentiment has done little to reassert the historical relationship. However, keep in mind, the bond market is pricing in the implications of the Fed’s war on inflation, while the general stock market and the PMs are not. As such, U.S. Treasuries’ safe-haven bid has evaporated, and in this upside-down world, stocks and commodities are incurring much less volatility.
Thus, please remember that short-term moves in the financial markets are not based on fundamentals. Instead, algorithms analyze sentiment indicators, and as long as momentum is bullish, why worry about medium-term fundamentals?
Think of it like this: we could present a quantitative trader with data that supports medium-term caution. However, he would respond with… who cares? In reality, momentum investors are so short-term-oriented that their strategy is to ride the wave higher and bolt at the first sign of trouble. As a result, with the PMs exhibiting less volatility, momentum investors haven’t seen the red flags that would cause them to exit their positions.
Furthermore, a subscriber asked me if “gold is now the only risk-off asset left standing” and if “this would explain why gold has been so resilient.” To answer, the conclusion is spot on.
With investors hiding out in gold despite its domestic fundamentals falling off a cliff, the Russia-Ukraine crisis has provided cover for overzealous investors. However, while gold permabulls use the elevated price to justify their narrative, the reality is that “those who cannot remember the past are condemned to repeat it.”
For context, we expect the PMs to soar over the long term. However, with the Fed hawked up and its rate hike cycle just beginning, we should witness sharp drawdowns before their secular bull markets continue.
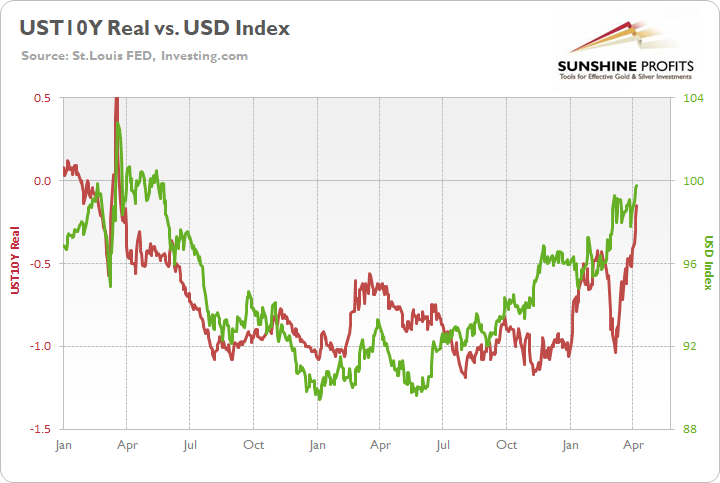
To that point, I’ve written a lot about U.S. real yields over the last several months. With the metric bullish for the USD Index and bearish for the PMs, I warned on Feb. 7 that the former’s short-term pullback contrasted with fundamental reality. I wrote:
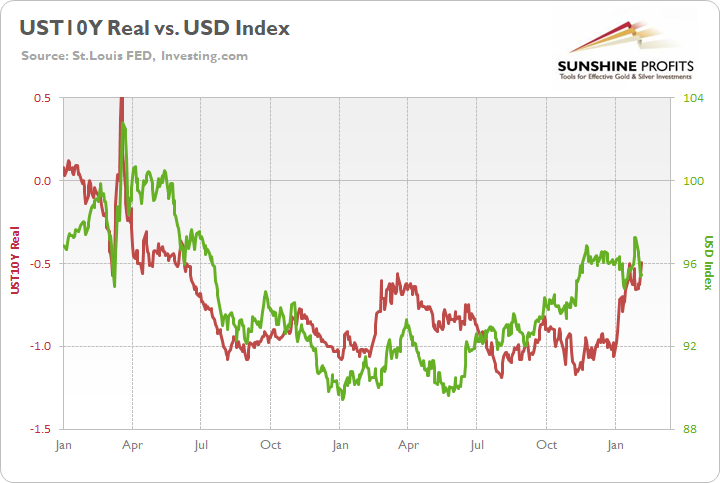
To explain, the green line above tracks the USD Index since January 2020, while the red line above tracks the U.S. 10-Year real yield. While the latter didn’t bottom in January 2021 like the USD Index and the FCI (though it was close), all three surged in late 2021 and hit new highs in 2022. Moreover, the U.S. 10-Year Treasury nominal and real yields hit new 2022 highs on Feb. 4.
Furthermore, with the Fed likely to raise interest rates at its March monetary policy meeting, a realization supports a higher U.S. 10-Year real yield, and a higher FCI. As a result, the fundamentals underpinning the USD Index remain robust, and short-term sentiment is likely responsible for the recent weakness.
Therefore, while the algorithms won the short-term battle, the fundamentals won the medium-term war. Moreover, with the U.S. 10-Year real yield surging in recent weeks, the USD Index has responded as expected.
Please see below:
However, gold prices’ persistent optimism is similar to the USD Index’s pullback in February. For example, the algorithms pushed the USD Index lower when momentum turned. However, reality re-emerged as time passed. Likewise, the algorithms are pushing the PMs higher now, but reality should also re-emerge over the next few months.
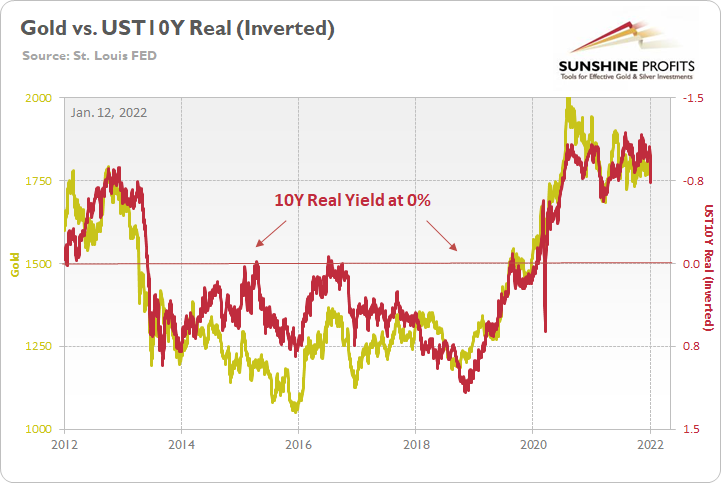
To explain, I wrote on Jan. 12:
The PMs are less volatile than speculative assets. However, it's important to remember that gold, silver, and mining stocks peaked amid the liquidity-fueled surge in the summer of 2020. Likewise, their uprisings coincided with real interest rates that were at all-time lows at the time.
Conversely, with the Fed's liquidity drain already unfolding and real interest rates poised to rise in the coming months, the PMs should suffer from the likely re-pricings. For example, when the U.S. 10-Year real yield was at 0% or higher from June 2013 until October 2018, gold was stuck below $1,400 during that timeframe and actually fell below $1,100. As a result, if the Fed pushes its hawkish chips into the middle, don't be surprised if the PMs fold in 2022.
Please see below:
To that point, the U.S. 10-Year real yield has surged in 2022, and hawkish remarks from the Fed lifted the metric to -0.16% on Apr. 7.
Please see below:
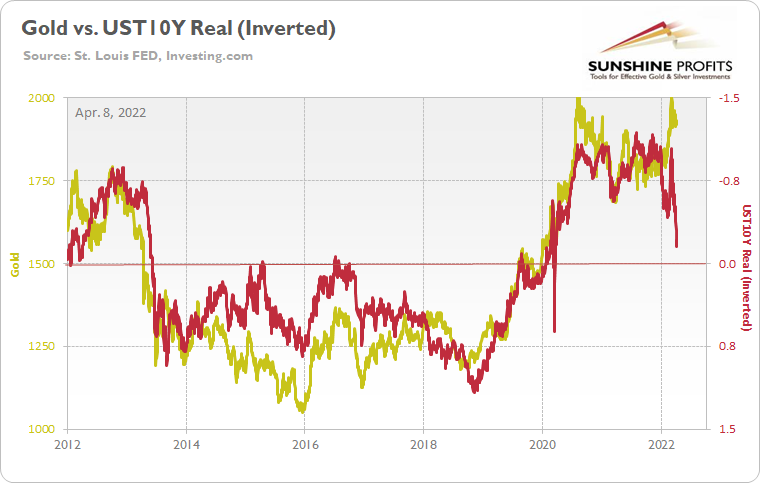
For your reference, the gold line above tracks the gold futures price, while the red line above tracks the inverted U.S. 10-Year real yield. For context, inverted means that the latter’s scale is flipped upside down and that a rising red line represents a falling U.S. 10-Year real yield, while a falling red line represents a rising U.S. 10-Year real yield.
If you analyze the left side of the chart, you can see that when the U.S. 10-Year real yield surged during the 2013 taper tantrum (depicted by the red line moving sharply lower), gold plunged by more than $500 in less than six months.
Moreover, if you focus your attention on the right side of the chart, you can see that the U.S. 10-Year real yield is gunning for neutral, and the Fed needs to push the metric above 0% to curb inflation.
As a result, the data couldn’t be clearer, and the fundamental outlooks for the USD Index and the U.S. 10-Year real yield are more bullish now than at the end of 2021. However, because algorithms rule the day in the short term, the timing of when reality will resurface is unclear.
Despite that, if we remove the Russia-Ukraine conflict from the equation, this is one of the worst medium-term fundamental setups for gold in a long time. Therefore, while the permabulls will shout that “this time is different,” history shows that the yellow metal can only ignore rising real yields for so long.
Furthermore, I wrote on Apr. 7 that the FOMC minutes show officials plan to raise interest rates several times in the coming months. Moreover, their use of terms like “faster,” “rapid” and “expeditiously” is not bullish for the PMs or the S&P 500. In addition, the crew also pledged to start reducing the balance sheet by ~$95 billion per month “at a coming meeting.” Likewise, the Fed minutes also stated:
“Many participants noted that one or more 50 basis point increases in the target range could be appropriate at future meetings, particularly if inflation pressures remained elevated or intensified. A number of participants noted that the Committee's previous communications had already contributed to a tightening of financial conditions, as evident in the notable increase in longer-term interest rates over recent months.”
As a result, the medium-term outlook remains unchanged: the Fed could double up its rate hikes at “one or more” meetings, and the future path depends heavily on inflation. However, with the latter still raging, the chances of a dovish pivot are slim to none.
As evidence, the Institute for Supply Management (ISM) released its U.S. Services PMI on Apr. 5. Moreover, the headline index increased from 56.5 in February to 58.3 in March. The report revealed:
“Prices paid by services organizations for materials and services increased in March for the 58th consecutive month, with the index registering 83.8 percent, 0.7 percentage point higher than the February figure of 83.1 percent. This is its second-highest reading ever, behind the seasonally adjusted figure of 83.9 percent registered in December 2021.”
In addition:
“Employment activity in the services sector grew in March after contracting in February. ISM’s Services Employment Index registered 54 percent in March, up 5.5 percentage points from the reading of 48.5 percent registered in February. Comments from respondents include: ‘Labor shortages seem to be improving as omicron has waned’ and ‘Hiring back to normal levels.’
As such, all of this is bullish for Fed policy.
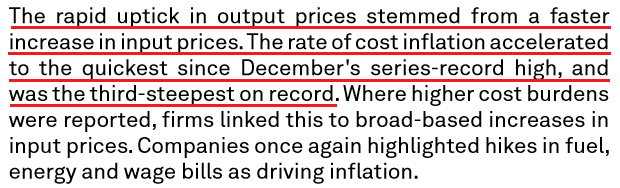
Likewise, S&P Global also released its U.S. Services PMI on Apr. 5. Here, the headline index increased from 56.5 in February to 58.0 in March. The report revealed:
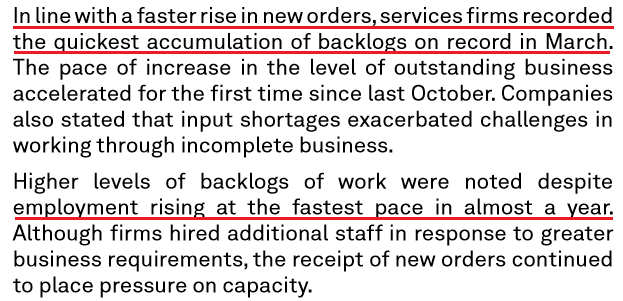
“On the price front, firms recorded a substantial increase in output charges during March. The rise in selling prices was the sharpest on record (since October 2009), as service providers reportedly passed through higher costs to clients, where possible.”
For more context:
 Source: S&P Global
Even more bullish for Fed policy:
 Source: S&P Global
The bottom line? While momentum remains gold and silver’s best friend, their domestic fundamental outlooks have deteriorated sharply in 2022. The USD Index and U.S. real yields have risen dramatically, and the Fed has turned the hawkish dial up from 60 to 100. However, the PMs have largely ignored all of these troubling developments.
Despite that, though, history shows that technicals and fundamentals win out over the medium term. Moreover, while sentiment remains uplifted for now, the pendulum can swing without warning. When this occurs, the PMs will confront one of the worst domestic fundamental environments since late 2018.
In conclusion, the PMs rallied on Apr. 7, as momentum doesn’t die easily. However, with the bearish medium-term thesis becoming clearer by the day, investors are fighting a battle they haven’t won in 10 years. As a result, while the timing remains uncertain, the PMs should suffer profound drawdowns once sentiment shifts.
Overview of the Upcoming Part of the Decline
- It seems to me that the post-decline consolidation is now over or very close to being over , and that gold, silver, and mining stocks are now likely to continue their medium-term decline.
- It seems that the first (bigger) stop for gold will be close to its previous 2021 lows, slightly below $1,800 . Then it will likely correct a bit, but it’s unclear if I want to exit or reverse the current short position based on that – it depends on the number and the nature of the bullish indications that we get at that time.
- After the above-mentioned correction, we’re likely to see a powerful slide, perhaps close to the 2020 low ($1,450 - $1,500).
- If we see a situation where miners slide in a meaningful and volatile way while silver doesn’t (it just declines moderately), I plan to – once again – switch from short positions in miners to short positions in silver. At this time, it’s too early to say at what price levels this could take place, and if we get this kind of opportunity at all – perhaps with gold close to $1,600.
- I plan to exit all remaining short positions once gold shows substantial strength relative to the USD Index while the latter is still rallying. This may be the case with gold close to $1,350 - $1,400. I expect silver to fall the hardest in the final part of the move. This moment (when gold performs very strongly against the rallying USD and miners are strong relative to gold after its substantial decline) is likely to be the best entry point for long-term investments, in my view. This can also happen with gold close to $1,375, but at the moment it’s too early to say with certainty.
- As a confirmation for the above, I will use the (upcoming or perhaps we have already seen it?) top in the general stock market as the starting point for the three-month countdown. The reason is that after the 1929 top, gold miners declined for about three months after the general stock market started to slide. We also saw some confirmations of this theory based on the analogy to 2008. All in all, the precious metals sector is likely to bottom about three months after the general stock market tops.
- The above is based on the information available today, and it might change in the following days/weeks.
You will find my general overview of the outlook for gold on the chart below:
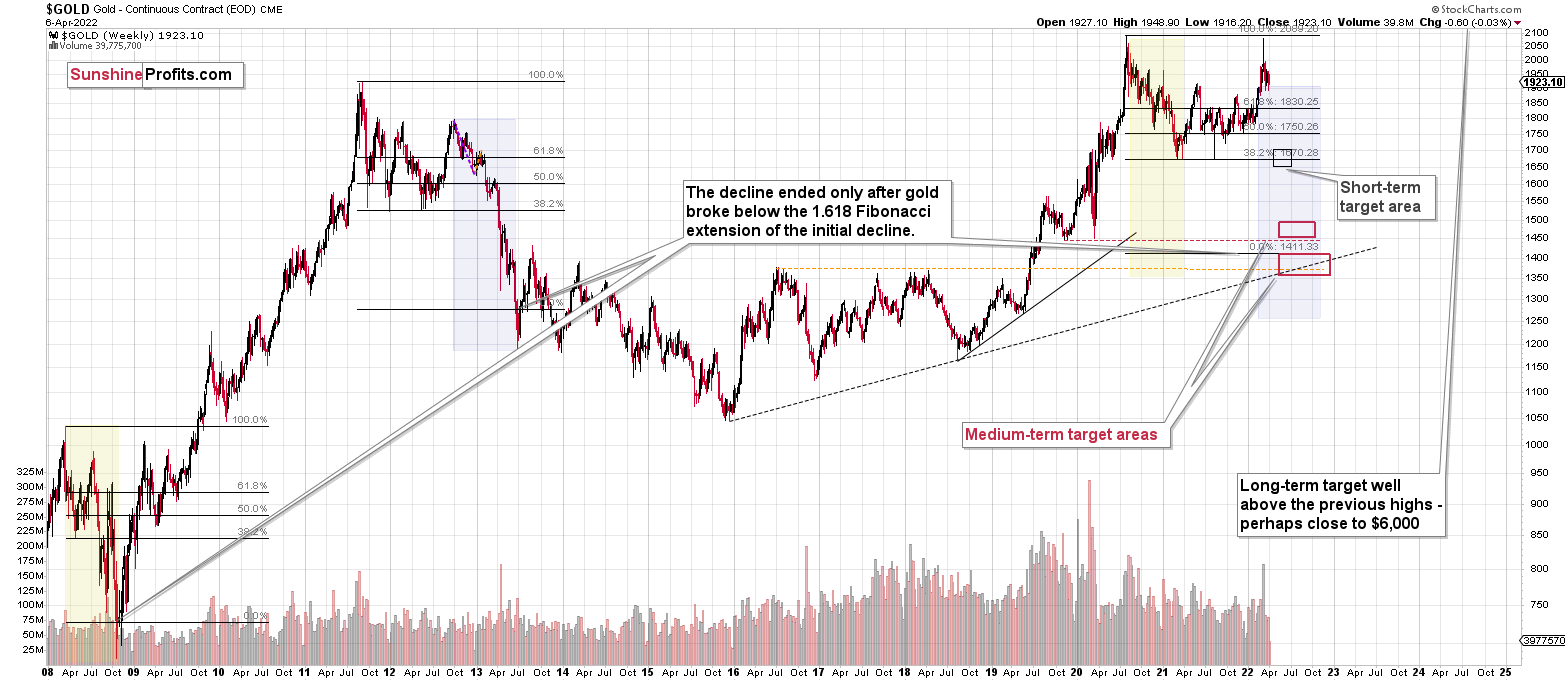
Please note that the above timing details are relatively broad and “for general overview only” – so that you know more or less what I think and how volatile I think the moves are likely to be – on an approximate basis. These time targets are not binding or clear enough for me to think that they should be used for purchasing options, warrants or similar instruments.
Summary
Summing up, despite the recent rally in gold, the outlook for junior mining stocks remains exactly as I described previously.
Crude oil’s extreme outperformance, the stock market’s weakness, and critical medium-term resistance levels reached by gold (all-time high!) and junior mining stocks – all indicate that the tops are at hand or have just formed.
Investing and trading are difficult. If it was easy, most people would be making money – and they’re not. Right now, it’s most difficult to ignore the urge to “run for cover” if you physically don’t have to. The markets move on “buy the rumor and sell the fact.” This repeats over and over again in many (all?) markets, and we have direct analogies to similar situations in gold itself. Junior miners are likely to decline the most, also based on the massive declines that are likely to take place (in fact, they have already started) in the stock markets.
From the medium-term point of view, the two key long-term factors remain the analogy to 2013 in gold and the broad head and shoulders pattern in the HUI Index. They both suggest much lower prices ahead.
It seems that our profits from short positions are going to become truly epic in the coming months.
After the sell-off (that takes gold to about $1,350-$1,500), I expect the precious metals to rally significantly. The final part of the decline might take as little as 1-5 weeks, so it's important to stay alert to any changes.
As always, we'll keep you - our subscribers - informed.
To summarize:
Trading capital (supplementary part of the portfolio; our opinion): Full speculative short positions (300% of the full position) in junior mining stocks are justified from the risk to reward point of view with the following binding exit profit-take price levels:
Mining stocks (price levels for the GDXJ ETF): binding profit-take exit price: $34.63; stop-loss: none (the volatility is too big to justify a stop-loss order in case of this particular trade)
Alternatively, if one seeks leverage, we’re providing the binding profit-take levels for the JDST (2x leveraged) and GDXD (3x leveraged – which is not suggested for most traders/investors due to the significant leverage). The binding profit-take level for the JDST: $14.98; stop-loss for the JDST: none (the volatility is too big to justify a SL order in case of this particular trade); binding profit-take level for the GDXD: $25.48; stop-loss for the GDXD: none (the volatility is too big to justify a SL order in case of this particular trade).
For-your-information targets (our opinion; we continue to think that mining stocks are the preferred way of taking advantage of the upcoming price move, but if for whatever reason one wants / has to use silver or gold for this trade, we are providing the details anyway.):
Silver futures downside profit-take exit price: $19.12
SLV profit-take exit price: $17.72
ZSL profit-take exit price: $38.28
Gold futures downside profit-take exit price: $1,683
HGD.TO – alternative (Canadian) inverse 2x leveraged gold stocks ETF – the upside profit-take exit price: $11.79
HZD.TO – alternative (Canadian) inverse 2x leveraged silver ETF – the upside profit-take exit price: $29.48
Long-term capital (core part of the portfolio; our opinion): No positions (in other words: cash
Insurance capital (core part of the portfolio; our opinion): Full position
Whether you already subscribed or not, we encourage you to find out how to make the most of our alerts and read our replies to the most common alert-and-gold-trading-related-questions.
Please note that we describe the situation for the day that the alert is posted in the trading section. In other words, if we are writing about a speculative position, it means that it is up-to-date on the day it was posted. We are also featuring the initial target prices to decide whether keeping a position on a given day is in tune with your approach (some moves are too small for medium-term traders, and some might appear too big for day-traders).
Additionally, you might want to read why our stop-loss orders are usually relatively far from the current price.
Please note that a full position doesn't mean using all of the capital for a given trade. You will find details on our thoughts on gold portfolio structuring in the Key Insights section on our website.
As a reminder - "initial target price" means exactly that - an "initial" one. It's not a price level at which we suggest closing positions. If this becomes the case (like it did in the previous trade), we will refer to these levels as levels of exit orders (exactly as we've done previously). Stop-loss levels, however, are naturally not "initial", but something that, in our opinion, might be entered as an order.
Since it is impossible to synchronize target prices and stop-loss levels for all the ETFs and ETNs with the main markets that we provide these levels for (gold, silver and mining stocks - the GDX ETF), the stop-loss levels and target prices for other ETNs and ETF (among other: UGL, GLL, AGQ, ZSL, NUGT, DUST, JNUG, JDST) are provided as supplementary, and not as "final". This means that if a stop-loss or a target level is reached for any of the "additional instruments" (GLL for instance), but not for the "main instrument" (gold in this case), we will view positions in both gold and GLL as still open and the stop-loss for GLL would have to be moved lower. On the other hand, if gold moves to a stop-loss level but GLL doesn't, then we will view both positions (in gold and GLL) as closed. In other words, since it's not possible to be 100% certain that each related instrument moves to a given level when the underlying instrument does, we can't provide levels that would be binding. The levels that we do provide are our best estimate of the levels that will correspond to the levels in the underlying assets, but it will be the underlying assets that one will need to focus on regarding the signs pointing to closing a given position or keeping it open. We might adjust the levels in the "additional instruments" without adjusting the levels in the "main instruments", which will simply mean that we have improved our estimation of these levels, not that we changed our outlook on the markets. We are already working on a tool that would update these levels daily for the most popular ETFs, ETNs and individual mining stocks.
Our preferred ways to invest in and to trade gold along with the reasoning can be found in the how to buy gold section. Furthermore, our preferred ETFs and ETNs can be found in our Gold & Silver ETF Ranking.
As a reminder, Gold & Silver Trading Alerts are posted before or on each trading day (we usually post them before the opening bell, but we don't promise doing that each day). If there's anything urgent, we will send you an additional small alert before posting the main one.
Thank you.
Przemyslaw Radomski, CFA
Founder, Editor-in-chief

