

Briefly: in our opinion, full (300% of the regular position size) speculative short positions in mining stocks are justified from the risk/reward point of view at the moment of publishing this Alert.
Given today’s pre-market slide in gold, it seems that the triangle-vertex-based turning point worked once again. Declines are likely next.
In yesterday’s analysis, I explained why the situation remains very similar to what happened in 2013, and that remains up-to-date. On top of that, two interesting things happened yesterday: one quite obvious and one less obvious.
White Metal Outperformance
The more obvious one was that silver outperformed gold on a short-term basis.
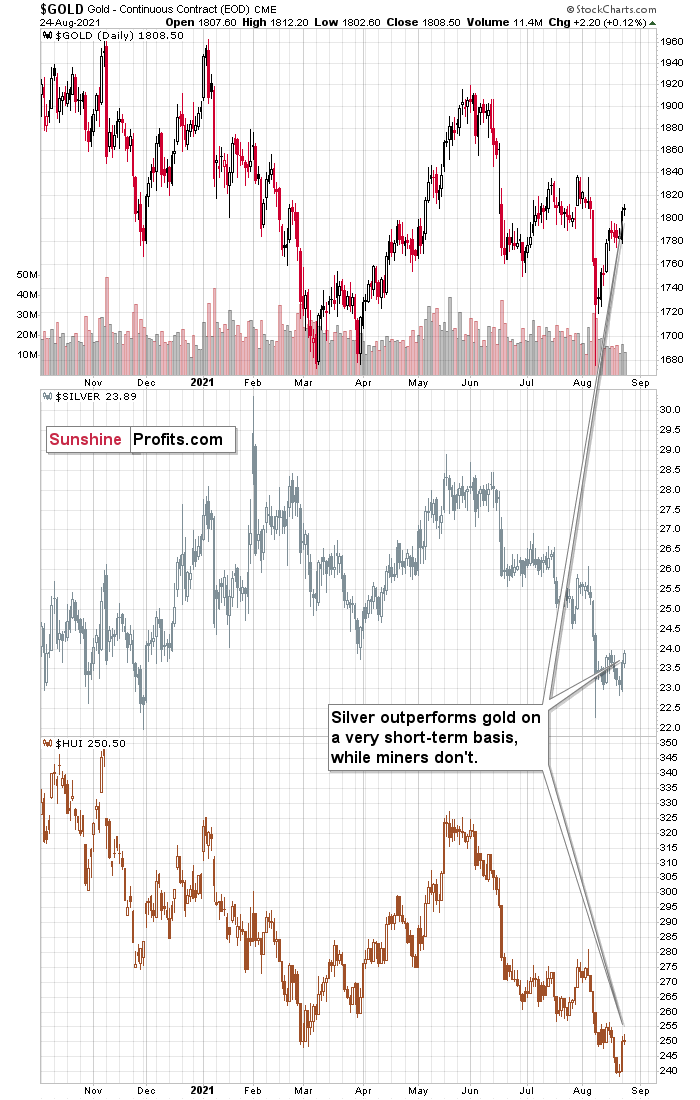
While miners and gold were almost flat yesterday, silver’s daily upswing was notable. Nothing to write home about, but it was visibly bigger than what we saw in gold and miners. These moments – when silver outperforms on a very short-term basis – tend to take place right before the prices of the precious metals and mining stocks decline.
Remember the early-August breakout in silver that turned out to be a fakeout? Silver broke above new highs while gold didn’t, so it outperformed on a very short-term basis. And just as lower prices followed then, lower prices are likely to follow soon (not necessarily immediately, though).
Have You Heard About GameStop?
The less obvious indication of a turnaround in gold came from the… GameStop stock price.
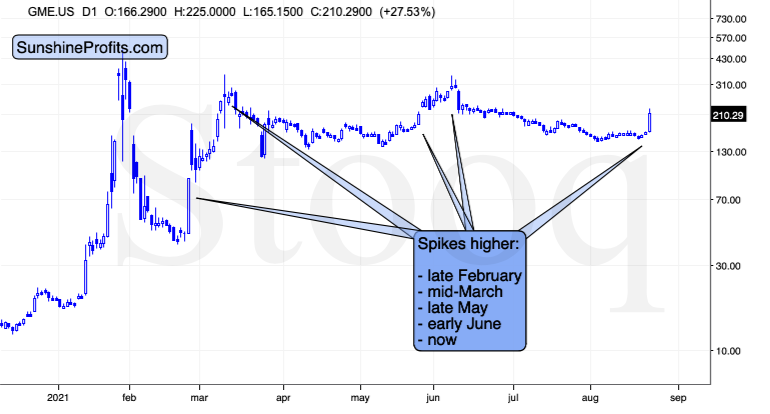
Yesterday’s sizable price spike is something that we saw several times this year. I’m not taking into account the January rally, as it was a specific forum-activity-based upswing that seems to be of one-of-a-kind nature. Except for yesterday’s price spike, there were also four other similar spikes. Let’s check if there was any kind of regularity on the gold market at the same time.
It turns out that in all four cases when the GameStop stock price spiked, gold was topping. Does it make any sense, and can one, therefore, count on this being repeated?
Actually, it does make sense. The assets are not really directly related, but they are related in terms of people’s emotions. The GameStop trade was quite an emotional one, people were jumping on board based on fear of missing out regardless of anything else. And nothing really changed since that time. The current valuations of the stock seem to be based on the same emotional aspect along with people’s ability to finance the purchases, perhaps based on leveraged stimulus-based funds. Consequently, the price spikes in GameStop might be a barometer for a specific type of emotionally driven purchases. And if the market is emotional in one specific way, it could impact more (all?) assets in one way or another. In the case of gold, it seems that when emotions (as indicated by GameStop stock) spiked, gold was topping.
Actually, it could be the case that the reason why silver outperforms gold on a short-term basis is related to the above. Silver is a smaller market, and it’s much more popular among individual investors than among institutions. No wonder that emotions play a part here, as the former are generally more emotional than the latter.
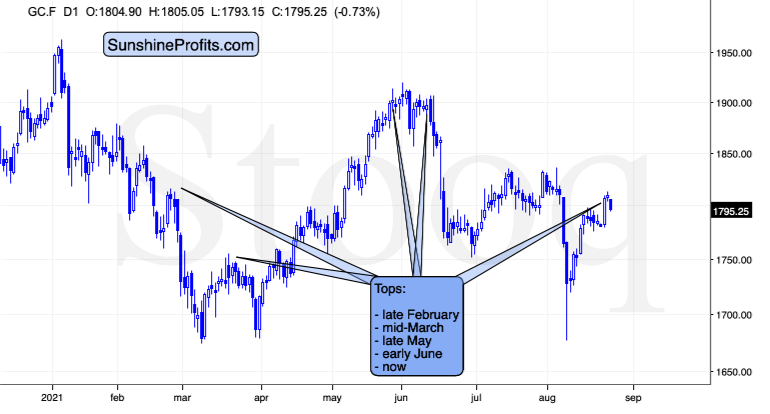
Having said that, let’s take a look at gold.
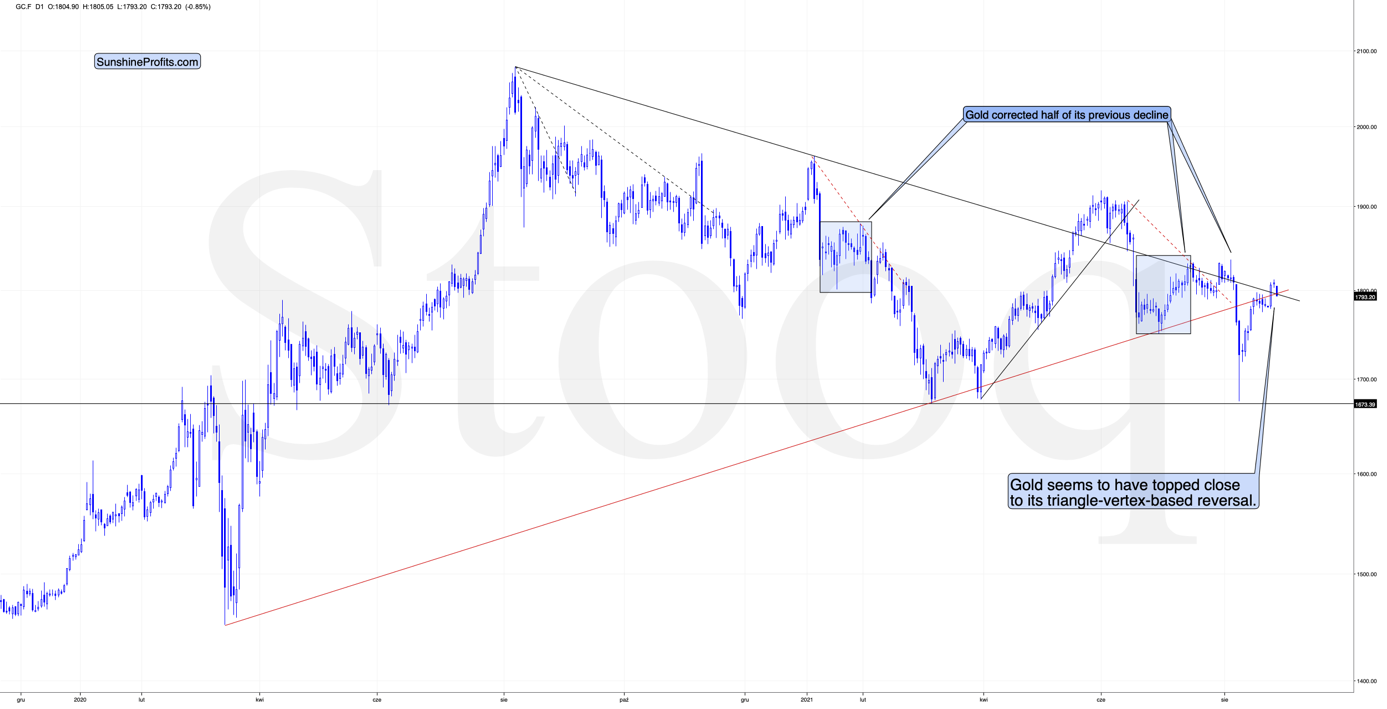
The yellow metal moved lower today, close to its triangle-vertex-based reversal. Consequently, the top might be in based on just that indication, and there are plenty more coming from other markets.
The USD Index, for example.
The Dollar Behavior
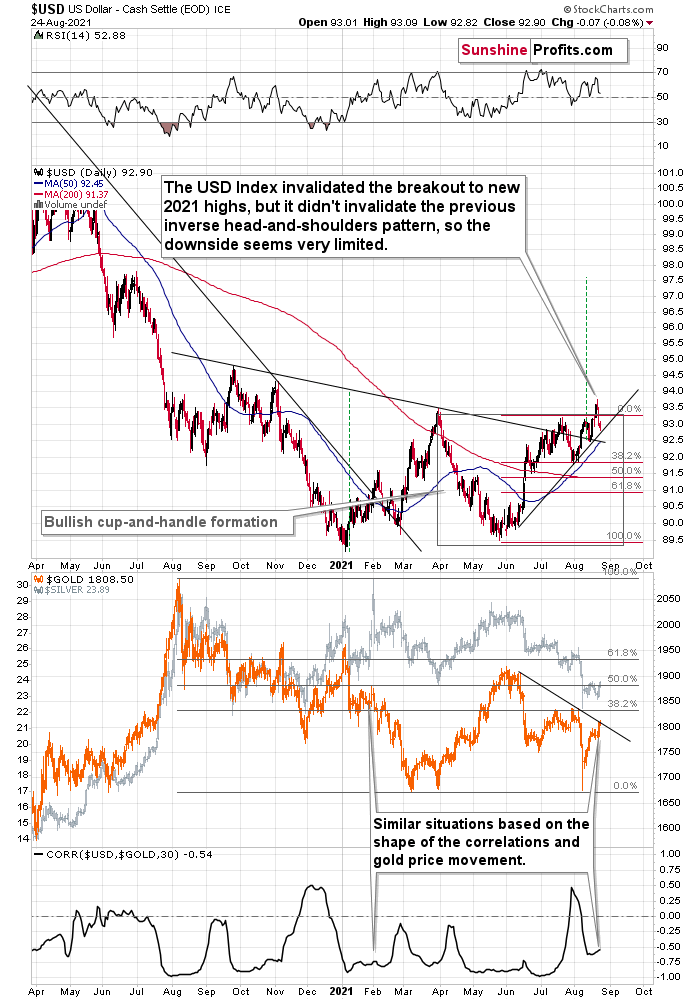
Yesterday, I commented on the above chart in the following way:
The USD Index invalidated the breakout to new 2021 highs, but it didn't invalidate the previous inverse head-and-shoulders pattern, so the downside seems very limited.
There’s a rising short-term support line based on the June and July lows that currently “says” that the USD Index is unlikely to fall below ~92.75. At the moment of writing these words, the USD Index is trading at about 93.07, so it’s very close to above-mentioned level.
And even if the USDX declines below it, there’s support at about 92.5 provided by the neck level of the previously confirmed inverse head-and-shoulders pattern. This means that the USDX is unlikely to decline below this level, and this in turn means that the downside seems to be limited to about 0.6 index point. That’s not a lot.
Remember when the USD Index previously invalidated the breakout above the inverse H&S pattern? I wrote then that it could decline to the nearest support level provided – then – by the 38.2% Fibonacci retracement. Now the nearest support is provided by the rising support line at about 92.75.
This doesn’t mean that gold will necessarily rally from here or that the rally will be substantial. On the lower part of the above chart, you can see that gold moved to its declining resistance line, which means that it could decline right away.
The USD Index didn’t move to the above-mentioned rising support line, but it was very close to it. The USD Index has been relatively flat so far today, but gold is already down, so it seems that even if the USD Index bottoms slightly lower, it might not take gold to new short-term highs.
All in all, it seems that the precious metals sector is ready for another sizable decline.
Having said that, let’s take a look at the markets from a more fundamental angle.
Not So Transitory
With inflation soaring and supply chain disruptions from the Delta variant accelerating the surge, the U.S. Federal Reserve’s (Fed) dual mandate remains under immense pressure. And while the latest coronavirus strain could delay the Fed’s taper timeline, the PMs’ optimism was nowhere to be found on Aug. 24. For context, when inflation rages, the Fed has to choose between calming the storm or risking a faster reduction in its bond-buying program in the future. And with the PMs extremely allergic to higher interest rates, U.S. Treasury yields signal that the immaterial pause is unlikely to change the Fed’s calculus over the medium term.
Please see below:
 Source: Investing.com
Likewise, it’s important to remember that investors are forward-looking. And with the Fed’s rhetoric known for rattling precious metals investors, the threat of another hawkish shift has market participants wary of a profound shakeout. As a result, with U.S. Treasury yields demonstrating upward momentum and surging inflation helping to sustain their ascent, the PMs likely won’t gain any serious traction even if the Fed preaches patience.
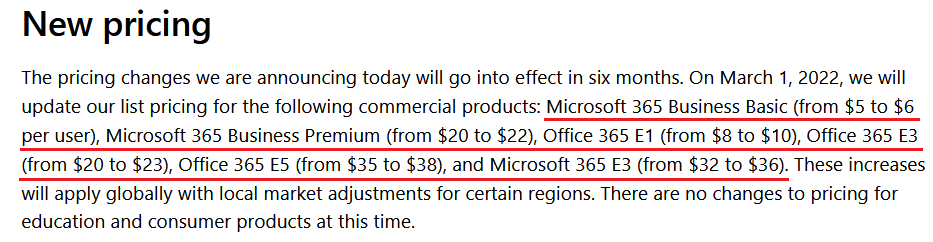
Moreover, the longer the Fed waits to reduce its bond-buying program, the greater the problem becomes. To explain, while I’ve discussed the rampant input inflation that’s plaguing U.S. manufacturers, now, U.S. technology companies are accelerating the inflationary momentum as well. For example, Microsoft announced on Aug. 19 “the first substantive pricing update since we launched Office 365 a decade ago.” For context, the “transitory” increases range from ~9% to 25%.
Please see below:
 Source: Microsoft
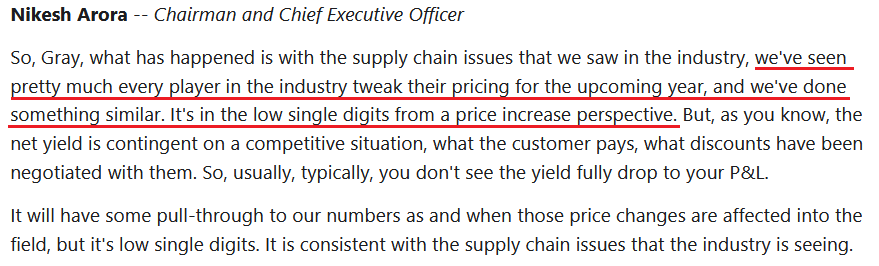
In addition, Palo Alto Networks – an American cybersecurity firm – is following suit. During its fourth-quarter earnings call on Aug. 23, CEO Nikesh Arora said that supply chain disruptions have caused the firm to raise prices. Moreover, with the company providing robust guidance for fiscal 2022, Arora said that “multiple drivers give us conviction in objectives for FY '22 and beyond… [and] I believe there's some pent-up hardware demand and we're going to see that come through in Q1 and the rest of FY '22.”
Please see below:
 Source: Palo Alto Networks/The Motley Fool
On top of that, the Richmond Fed released its Fifth District Survey of Manufacturing Activity on Aug. 24. And while the “composite index declined from 27 in July to 9 in August,” the report revealed that “lead times continued to increase and inventories remained low.” For context, because surveys depict month-over-month (MoM) activity, I warned previously that depressed sentiment would likely emerge as the Delta variant spreads. However, while the U.S. economic recovery takes a breather, the Richmond Fed’s “wage index hit a record high” and its prices received index followed suit.
Please see below:
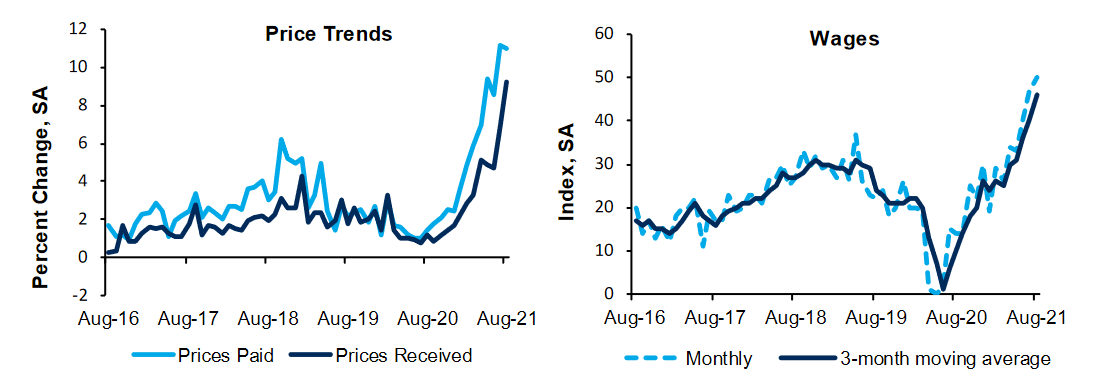 Source: Richmond Fed
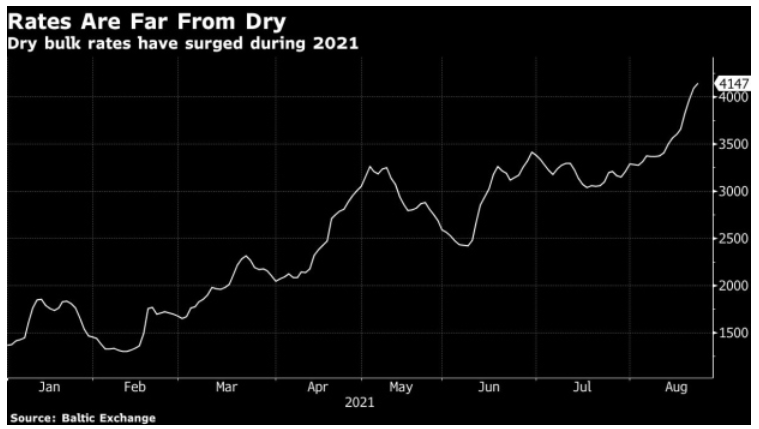
If that wasn’t enough, the Baltic Dry Index – a benchmark measure of commodity shipping costs – recorded its 11th consecutive daily increase on Aug. 24. Jan Rindbo, CEO of D/S Norden A/S – a 150-year-old Danish operator of more than 500 shipping vessels – said:
“Earlier in the year, people thought this was a short-term spike in the market, but now people see it as more structural and longer term.”
Please see below:
Rent Flash Flood
In addition, while I’ve been warning for months about the forthcoming tsunami, the U.S. government’s measure of rent inflation is still extremely subdued. And with RealPage – a technology platform that serves over 19 million rental units worldwide – revealing that rent prices surged by 17% year-over-year (YoY ) in July (an all-time high), the inflationary pressures remain robust. “It’s always been hard to find a home if you have limited income,” said Jay Parsons, deputy chief economist at RealPage. “What’s crazy now is you can have a relatively high income and still have a hard time.” For context, rents account for more than 30% of the movement of the headline Consumer Price Index (CPI) and more than 40% of the movement of the core CPI and that’s why the data is so important.
Please see below:
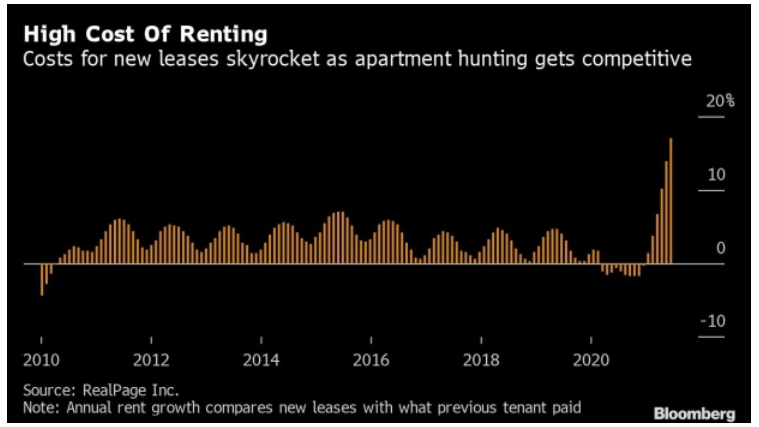
To explain, the brown bars above track the YoY percentage change in rental prices. If you analyze the right side of the chart, you can see that the momentum is still accelerating.
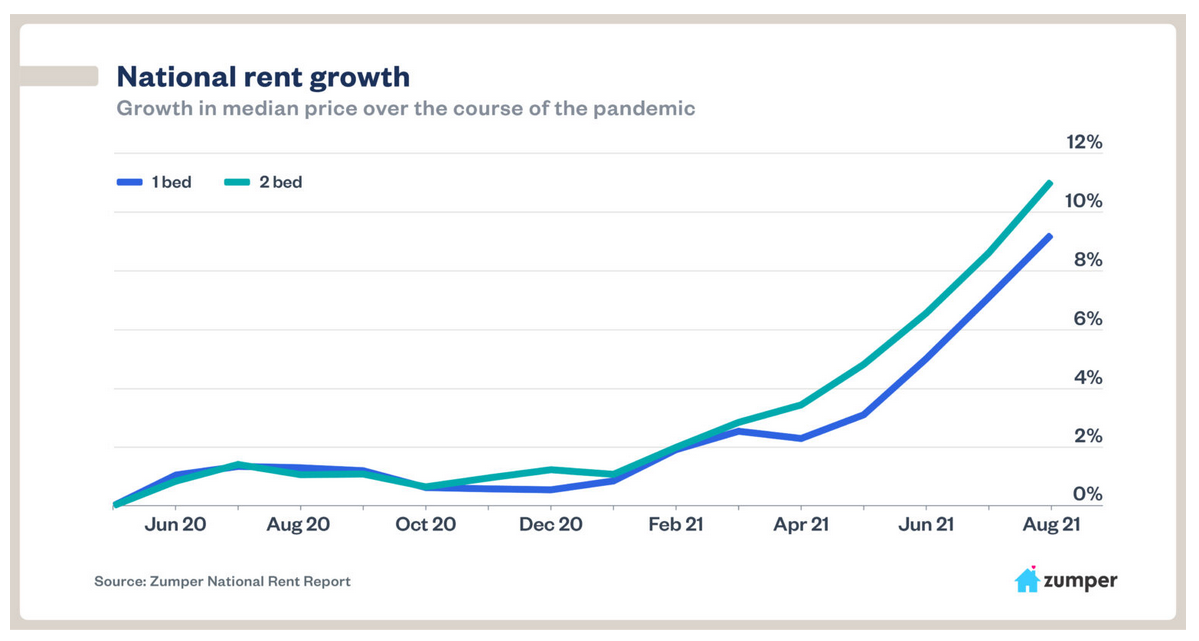
As further evidence, Zumper – an online platform that helps connect landlords and tenants – released its National Rent Report on Aug. 24. An excerpt read:
“After the pandemic began in March 2020, prospective buyers rushed into local home sales markets in hopes of acclimating their living arrangement to stay-at-home orders and work-from-home policies. Sales volume and home valuations skyrocketed as a result of the sudden and surprising demand. That’s now trickling down to the rental market and causing massive spikes in rent. Zumper’s national rent index for August has one-bedroom median rent up 9.2 percent since the second quarter of 2020, and two-bedrooms are up 11 percent.”
Please see below:
Moreover, as schools reopen in September and U.S. citizens remain flush with cash due to enhanced unemployment benefits and record job openings, seasonal patterns also imply a sharp increase in rental inflation in the coming months:
“It’s not just the overheated home sales market contributing to these numbers. As the economy has improved and unemployment has fallen, people who are making more money have also been deciding to move. Those who moved in with family during the pandemic are moving out now that they have jobs or schools to return to. A lot of the cyclical nature of rent prices — where rent rises in the spring and summer and falls in the winter — stopped after the beginning of the pandemic, which set off a massive wave of domestic migration unrelated to seasonality. But with universities opening for in-person learning this fall, the events that drive that cyclical nature of rent are returning, leading to the normal spike in rent that happens as students move. Altogether, this creates a recipe for unprecedented rises in rent across the country.”
The bottom line? With price stability (controlling inflation) one-half of the Fed’s dual mandate, not only has the Delta variant upended supply chains and accelerated the inflationary spike, but investors are still underestimating potential rent inflation. As a result, while the Fed can delay the taper announcement for a month or so, the date is fundamentally immaterial from a medium-term perspective. And because of that, the PMs’ likely downfall still remains on track.
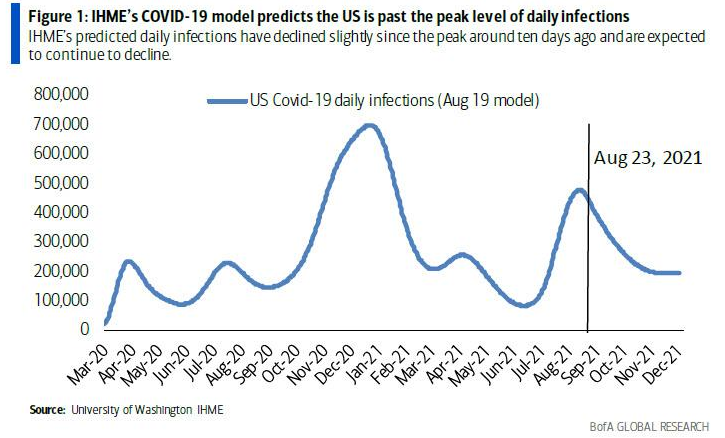
In conclusion, the PMs were quite shy on Aug. 24, as gold mining stocks failed to rekindle the optimism that erupted during their one-day rally. Moreover, with the USD Index holding firm and rising U.S. Treasury yields signaling that the Delta variant may have already peaked (see the chart below for more evidence), the PMs could run out of gas in the near future. And while Fed Chairman Jerome Powell could talk down the U.S. dollar and uplift the PMs during his speech on Aug. 27, surging inflation and rising U.S. nonfarm payrolls will likely force his hand sooner rather than later. As a result, the PMs’ medium-term downtrend still remains intact.
Overview of the Upcoming Part of the Decline
- The corrective upswing in gold is over, and the big decline seems to be already underway.
- After the miners slide in a meaningful and volatile way but silver doesn’t (and it just declines moderately), I plan to switch from short positions in miners to short positions in silver. At this time, it’s too early to say at what price levels this would take place – perhaps with gold close to $1,600. I plan to exit those short positions when gold shows substantial strength relative to the USD Index, while the latter is still rallying. This might take place with gold close to $1,350 - $1,500 and the entire decline (from above $1,900 to about $1,475) would be likely to take place within 6-20 weeks. I expect silver to fall the hardest in the final part of the move. This moment (when gold performs very strongly against the rallying USD and miners are strong relative to gold – after gold has already declined substantially) is likely to be the best entry point for long-term investments, in my view. This might also happen with gold close to $1,475, but it’s too early to say with certainty at this time.
- As a confirmation for the above, I will use the (upcoming or perhaps we have already seen it?) top in the general stock market as the starting point for the three-month countdown. The reason is that after the 1929 top, gold miners declined for about three months after the general stock market started to slide. We also saw some confirmations of this theory based on the analogy to 2008. All in all, the precious metals sector would be likely to bottom about three months after the general stock market tops.
- The above is based on the information available today, and it might change in the following days/weeks.
Please note that the above timing details are relatively broad and “for general overview only” – so that you know more or less what I think and how volatile I think the moves are likely to be – on an approximate basis. These time targets are not binding or clear enough for me to think that they should be used for purchasing options, warrants or similar instruments.
Summary
To summarize, the medium- and short-term outlooks for the precious metals sector remain down. The breakdown to new yearly lows in the HUI Index and to new yearly highs in the USD Index serve as profound confirmations that a huge downswing in the precious metals sector is underway and that its biggest part is likely just ahead. Regardless of the recent upswing in the PMs and miners.
It seems that our profits from the short positions are going to become truly epic in the following weeks.
After the sell-off (that takes gold to about $1,350 - $1,500), I expect the precious metals to rally significantly. The final part of the decline might take as little as 1-5 weeks, so it's important to stay alert to any changes.
Most importantly, please stay healthy and safe. We made a lot of money last March and this March, and it seems that we’re about to make much more on the upcoming decline, but you have to be healthy to enjoy the results.
As always, we'll keep you - our subscribers - informed.
By the way, we’re currently providing you with the possibility to extend your subscription by a year, two years or even three years with a special 20% discount. This discount can be applied right away, without the need to wait for your next renewal – if you choose to secure your premium access and complete the payment upfront. The boring time in the PMs is definitely over, and the time to pay close attention to the market is here. Naturally, it’s your capital, and the choice is up to you, but it seems that it might be a good idea to secure more premium access now while saving 20% at the same time. Our support team will be happy to assist you in the above-described upgrade at preferential terms – if you’d like to proceed, please contact us.
To summarize:
Trading capital (supplementary part of the portfolio; our opinion): Full speculative short positions (300% of the full position) in mining stocks are justified from the risk to reward point of view with the following binding exit profit-take price levels:
Mining stocks (price levels for the GDXJ ETF): binding profit-take exit price: $35.73; stop-loss: none (the volatility is too big to justify a stop-loss order in case of this particular trade)
Alternatively, if one seeks leverage, we’re providing the binding profit-take levels for the JDST (2x leveraged) and GDXD (3x leveraged – which is not suggested for most traders/investors due to the significant leverage). The binding profit-take level for the JDST: $16.96; stop-loss for the JDST: none (the volatility is too big to justify a SL order in case of this particular trade); binding profit-take level for the GDXD: $35.46; stop-loss for the GDXD: none (the volatility is too big to justify a SL order in case of this particular trade).
For-your-information targets (our opinion; we continue to think that mining stocks are the preferred way of taking advantage of the upcoming price move, but if for whatever reason one wants / has to use silver or gold for this trade, we are providing the details anyway.):
Silver futures upside profit-take exit price: unclear at this time - initially, it might be a good idea to exit, when gold moves to $1,683
Gold futures upside profit-take exit price: $1,683
HGD.TO – alternative (Canadian) inverse 2x leveraged gold stocks ETF – the upside profit-take exit price: $11.38
Long-term capital (core part of the portfolio; our opinion): No positions (in other words: cash
Insurance capital (core part of the portfolio; our opinion): Full position
Whether you already subscribed or not, we encourage you to find out how to make the most of our alerts and read our replies to the most common alert-and-gold-trading-related-questions.
Please note that we describe the situation for the day that the alert is posted in the trading section. In other words, if we are writing about a speculative position, it means that it is up-to-date on the day it was posted. We are also featuring the initial target prices to decide whether keeping a position on a given day is in tune with your approach (some moves are too small for medium-term traders, and some might appear too big for day-traders).
Additionally, you might want to read why our stop-loss orders are usually relatively far from the current price.
Please note that a full position doesn't mean using all of the capital for a given trade. You will find details on our thoughts on gold portfolio structuring in the Key Insights section on our website.
As a reminder - "initial target price" means exactly that - an "initial" one. It's not a price level at which we suggest closing positions. If this becomes the case (like it did in the previous trade), we will refer to these levels as levels of exit orders (exactly as we've done previously). Stop-loss levels, however, are naturally not "initial", but something that, in our opinion, might be entered as an order.
Since it is impossible to synchronize target prices and stop-loss levels for all the ETFs and ETNs with the main markets that we provide these levels for (gold, silver and mining stocks - the GDX ETF), the stop-loss levels and target prices for other ETNs and ETF (among other: UGL, GLL, AGQ, ZSL, NUGT, DUST, JNUG, JDST) are provided as supplementary, and not as "final". This means that if a stop-loss or a target level is reached for any of the "additional instruments" (GLL for instance), but not for the "main instrument" (gold in this case), we will view positions in both gold and GLL as still open and the stop-loss for GLL would have to be moved lower. On the other hand, if gold moves to a stop-loss level but GLL doesn't, then we will view both positions (in gold and GLL) as closed. In other words, since it's not possible to be 100% certain that each related instrument moves to a given level when the underlying instrument does, we can't provide levels that would be binding. The levels that we do provide are our best estimate of the levels that will correspond to the levels in the underlying assets, but it will be the underlying assets that one will need to focus on regarding the signs pointing to closing a given position or keeping it open. We might adjust the levels in the "additional instruments" without adjusting the levels in the "main instruments", which will simply mean that we have improved our estimation of these levels, not that we changed our outlook on the markets. We are already working on a tool that would update these levels daily for the most popular ETFs, ETNs and individual mining stocks.
Our preferred ways to invest in and to trade gold along with the reasoning can be found in the how to buy gold section. Furthermore, our preferred ETFs and ETNs can be found in our Gold & Silver ETF Ranking.
As a reminder, Gold & Silver Trading Alerts are posted before or on each trading day (we usually post them before the opening bell, but we don't promise doing that each day). If there's anything urgent, we will send you an additional small alert before posting the main one.
Thank you.
Przemyslaw Radomski, CFA
Founder, Editor-in-chief

