

Briefly: in our opinion, full (300% of the regular position size) speculative short positions in mining stocks are justified from the risk/reward point of view at the moment of publishing this Alert.
I could write a nice lengthy introduction today, but it seems that there’s only one question on your mind right now, so I’ll quickly address it instead. Has the outlook for gold, silver, and mining stocks become bullish because of yesterday’s rally? My answer is: no, it hasn’t changed.
Let’s jump into the charts.
Support the Dollar
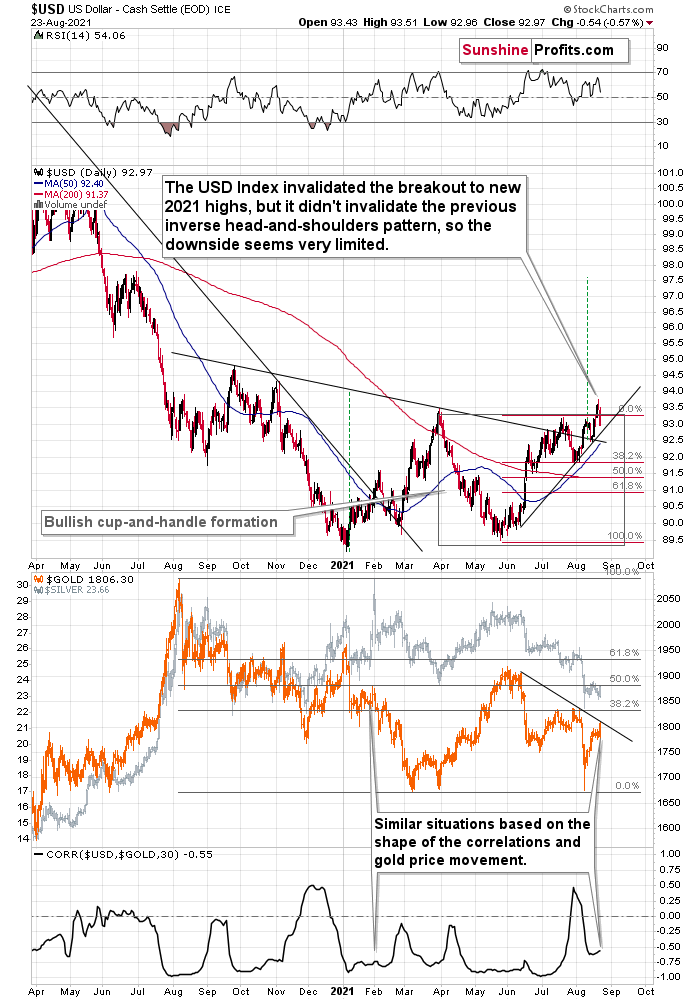
The USD Index invalidated the breakout to new 2021 highs, but it didn't invalidate the previous inverse head-and-shoulders pattern, so the downside seems very limited.
There’s a rising short-term support line based on the June and July lows that currently “says” that the USD Index is unlikely to fall below ~92.75. At the moment of writing these words, the USD Index is trading at about 93.07, so it’s very close to above-mentioned level.
And even if the USDX declines below it, there’s support at about 92.5 provided by the neck level of the previously confirmed inverse head-and-shoulders pattern. This means that the USDX is unlikely to decline below this level, and this in turn means that the downside seems to be limited to about 0.6 index point. That’s not a lot.
Remember when the USD Index previously invalidated the breakout above the inverse H&S pattern? I wrote then that it could decline to the nearest support level provided – then – by the 38.2% Fibonacci retracement. Now the nearest support is provided by the rising support line at about 92.75.
This doesn’t mean that gold will necessarily rally from here or that the rally will be substantial. On the lower part of the above chart, you can see that gold moved to its declining resistance line, which means that it could decline right away. We can see it more clearly on the gold chart below.
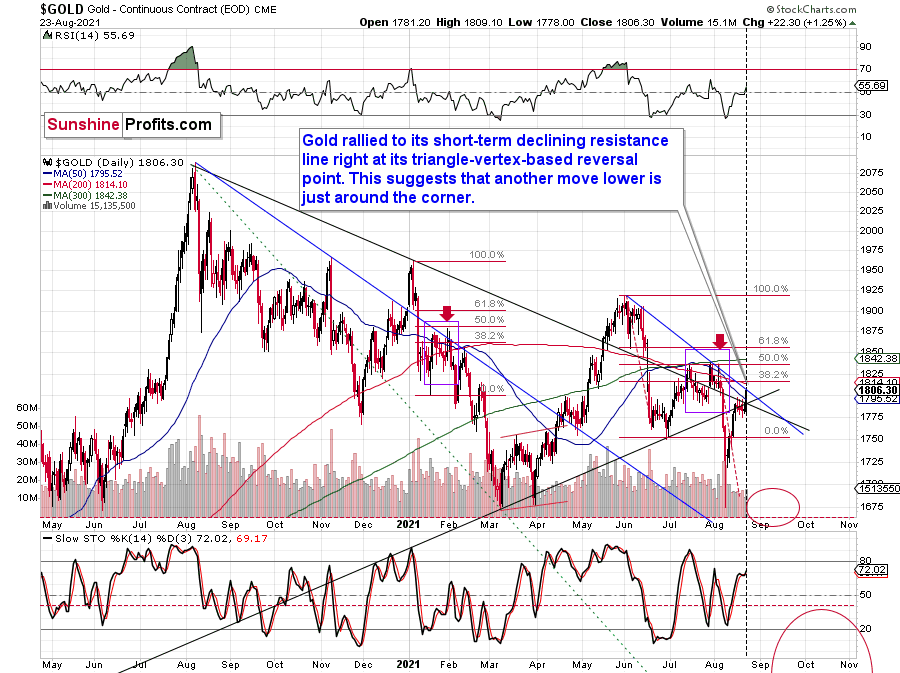
In this case, I marked the declining short-term resistance line with blue. The combination of the resistance line being reached with the fact that gold did that right on its reversal day indicated by the triangle’s vertex makes it even more likely that gold will reverse its course shortly.
We can see the same thing – gold moving to its resistance line – also when we look at its performance through its most popular proxy – the GLD ETF.
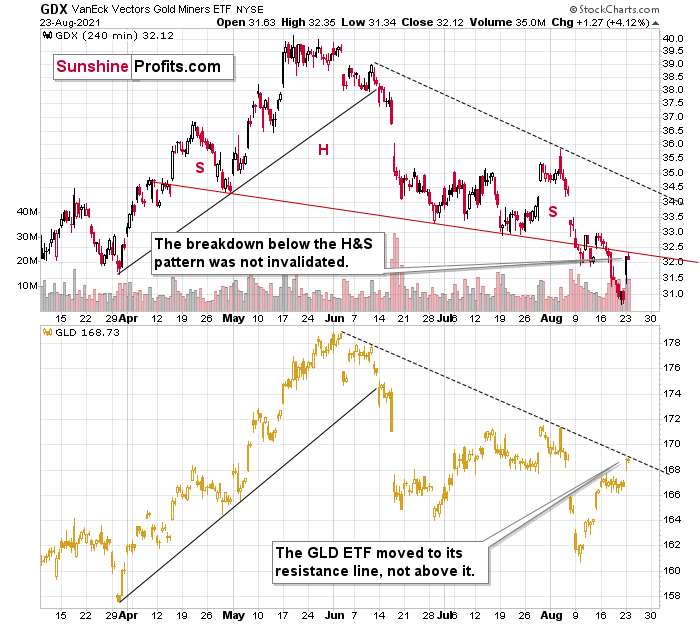
In this case, we can compare where gold rallied to where the mining stocks (the GDX ETF) rallied. And while the GLD moved to its declining resistance line, the GDX ETF was not even close to its analogous dashed declining resistance line.
Instead, the GDX ETF moved back to its previously broken neckline of the head and shoulders pattern and closed slightly below it.
This is more important than comparing the GDX’s closing price to its previous yearly low — it closed slightly above it.
The 2013 Analogue Still in Play
And speaking of mining stocks, the HUI Index closed slightly above its previous March lows (in terms of the closing prices), but it was just 0.24 index point rally above it.
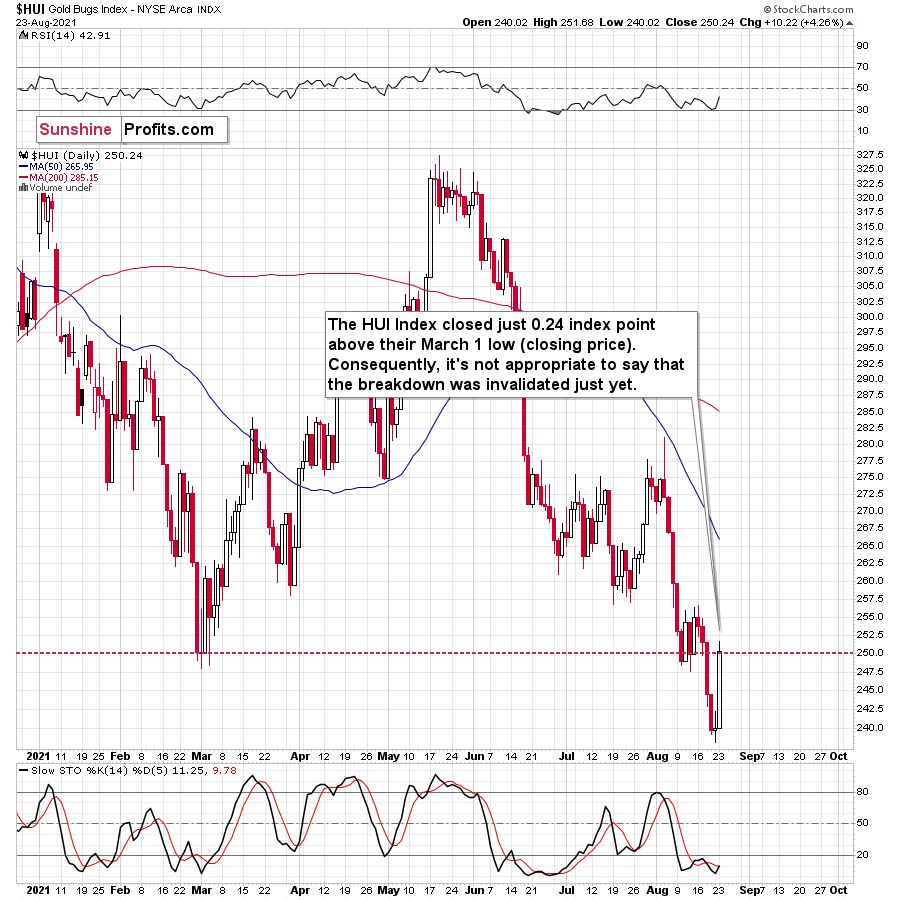
Consequently, it’s not appropriate to say that the breakdown was truly invalidated. It’s kind of a “gray area” of invalidations. That’s not the most important point of view though.
The most important point of view is the broad point of view.
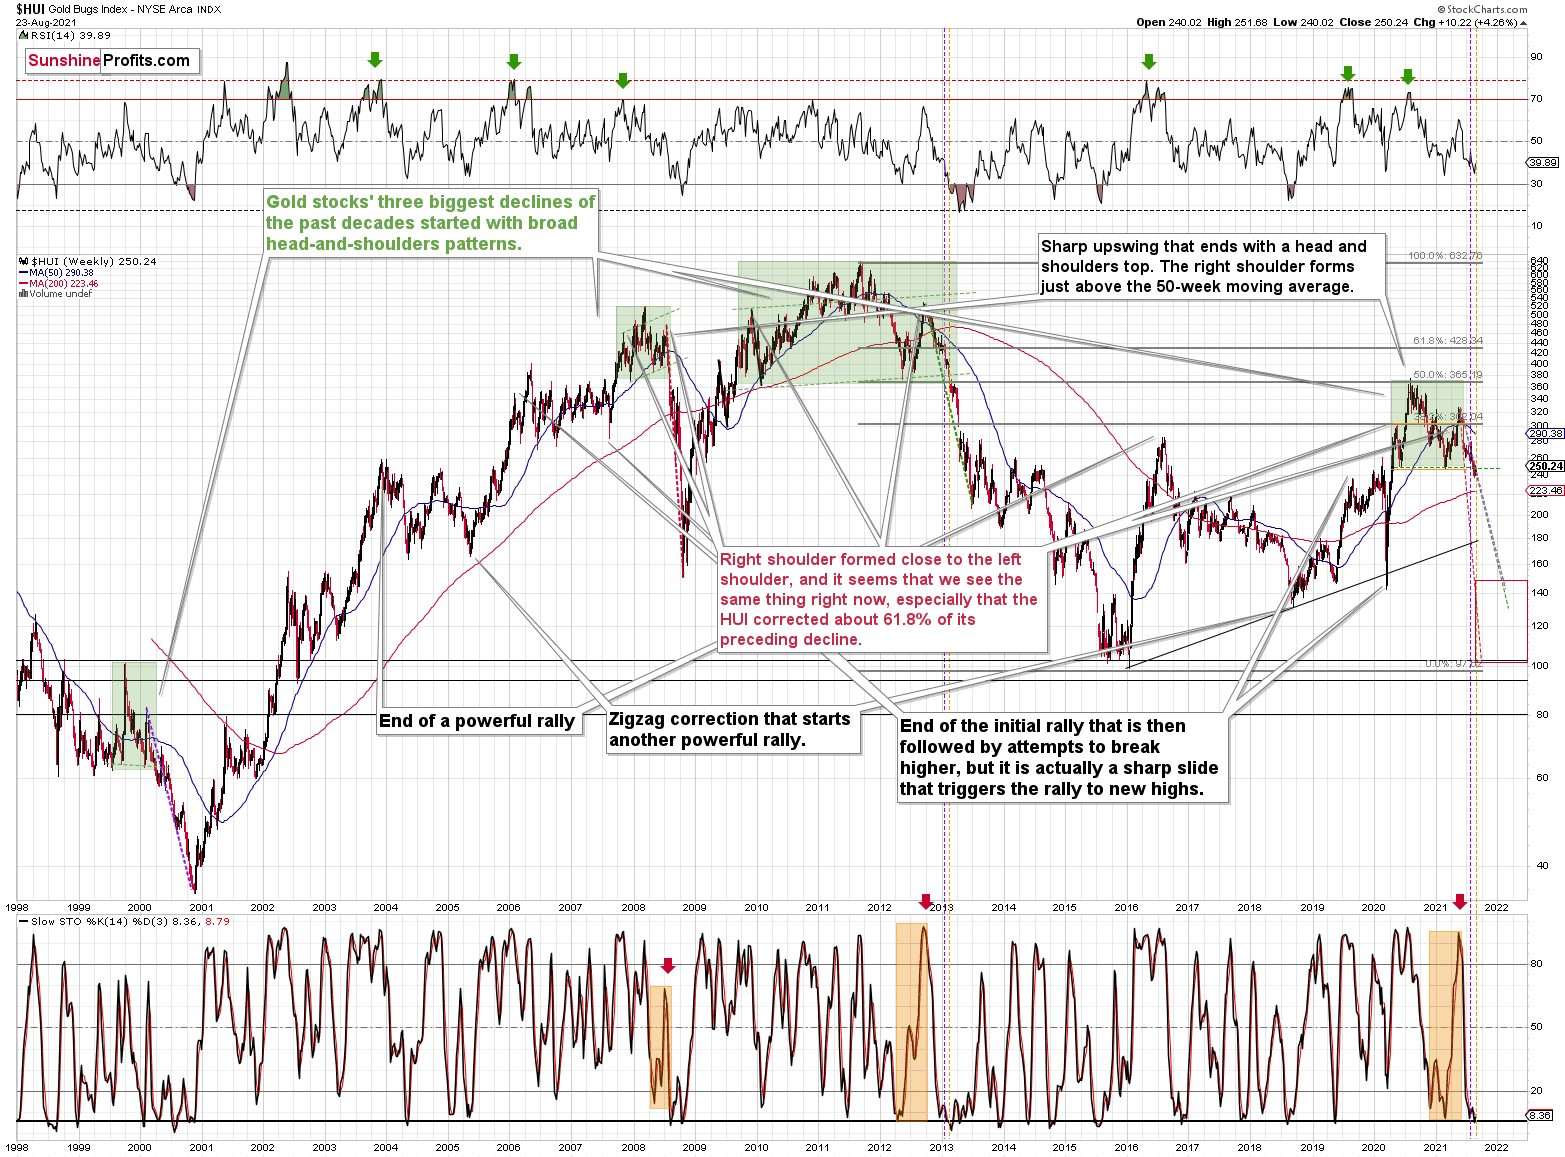
Do you see any change with regard to the similarity between now and what happened in 2013? No? Because nothing changed with regard to it.
It’s useful to keep in mind that the current post-broad-head-and-shoulders pattern is not only similar to what happened in 2013 but also to what happened in 2008 and… in 2000. In the case of the former, there were ~4%-8% corrective upswings after the breakdown below the H&S pattern. In the case of the 2008 slide, there was no short-term correction, and in the case of the 2000 decline, there was even a corrective upswing that pretended (!!!) to invalidate the head and shoulders pattern, after which the HUI Index declined about half of its value.
Gold stocks moved higher about 4% so far this week. This is in perfect tune with what happened in 2013 and in 2000.
In fact, let’s check what exactly happened in 2013 in the GDX ETF.
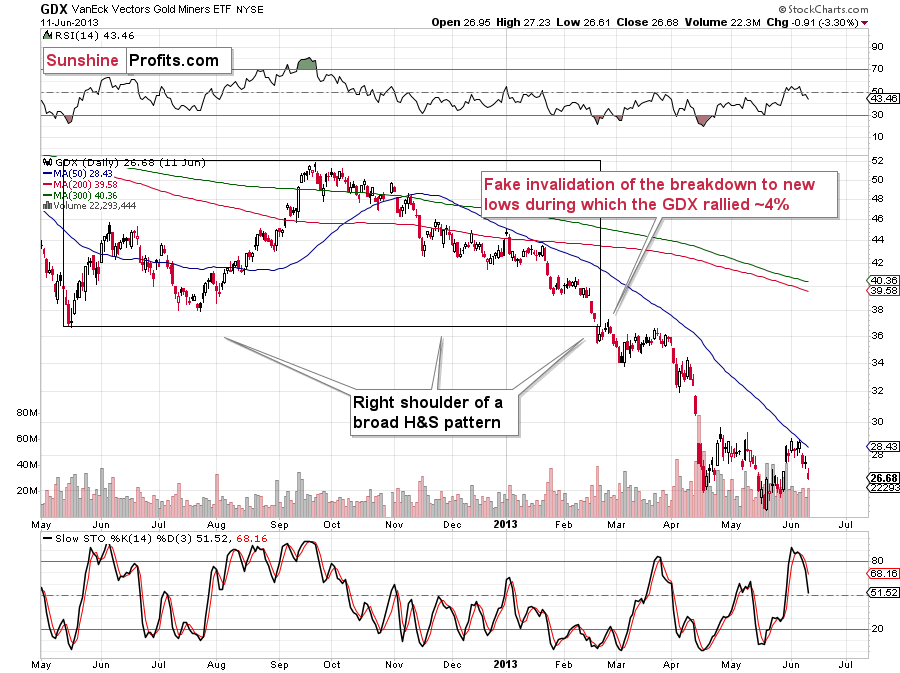
Right after breaking below the previous lows, there was a ~4% rally that took the GDX ETF above the previous low in terms of the closing price, but only slightly so. Seems familiar?
Yes, that’s exactly what happened yesterday.
If the analogy to 2013 is being repeated almost to the letter, should this performance be really treated as something bullish? No.
Do I think that any adjustment in our short positions in the junior mining stocks is justified at this time? Once again – no.
Having said that, let’s take a look at the markets from a more fundamental angle.
Bad News Is Good News
With the spread of the Delta variant threatening to delay the U.S. Federal Reserve’s (Fed) taper timeline, investors cheered economic weakness on Aug. 23. And as stocks surged and the USD Index faltered, the PMs were given the ‘all clear’ for a relief rally. However, while sentiment often rules the day in the short term, the PMs’ bearish outlook for the medium term remains intact.
Case in point: with the Kansas City Fed announcing that its annual Jackson Hole Economic Symposium will take place virtually due to the spread of the Delta variant, Esther George said that “we are disappointed that health conditions will prevent us from being able to gather in person” on Aug. 27. And with the latest coronavirus strain causing Goldman Sachs and Bank of America to reduce their third-quarter U.S. GDP growth estimates, the former wrote that it provides the perfect cover for the Fed to preach even more patience.
Please see below:
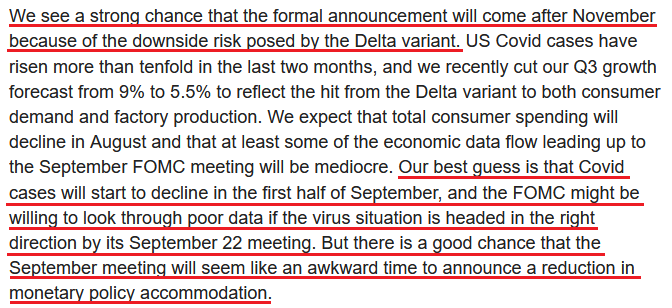 Source: Zero Hedge
To that point, while the Fed has ample support to delay its taper announcement, the fundamental drivers that molded its hawkish shift remain unchanged. First, the Fed’s daily reverse repurchase agreements hit another all-time high on Aug. 23, with 76 counterparties siphoning nearly $1.136 trillion out of the U.S. financial system.
Please see below:
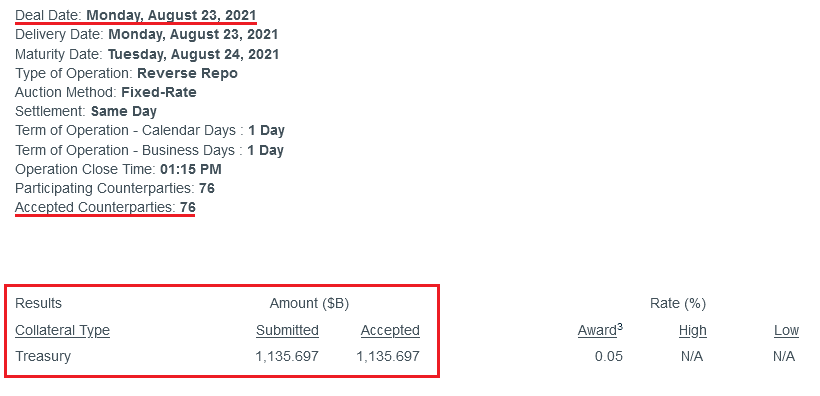 Source: New York Fed
To explain, a reverse repurchase agreement (repo) occurs when an institution offloads cash to the FED in exchange for a Treasury security (on an overnight or short-term basis). And with U.S. financial institutions currently flooded with excess liquidity, they’re shipping cash to the FED at an alarming rate. And while I’ve been warning for months that the activity is the fundamental equivalent of a taper – due to the lower supply of U.S. dollars (which is bullish for the USD Index) – the psychological effect is not the same. Thus, while sentiment abandoned the U.S. dollar on Aug. 23, the greenback’s fundamentals remain robust.
Second, while the Fed has a dual mandate of maximum employment and price stability (controlling inflation), Chairman Jerome Powell remains fixated on the former. However, with enhanced unemployment benefits set to expire in September, the U.S. labor market’s recovery should keep the pressure on the Fed.
To explain, I wrote on Jun. 9:
With U.S. nonfarm payrolls well below their pre-pandemic highs, the FED can ignore rampant inflation and use high unemployment as an excuse for further easing. However, with the U.S. Bureau of Labor Statistics (BLS) revealing on Jun. 8 that U.S. job openings surged to an all-time high of 9.286 million – and came in well above the consensus estimate of 8.300 million – the only thing depressing the U.S. labor market are ill-advised enhanced unemployment benefits.
Please see below:
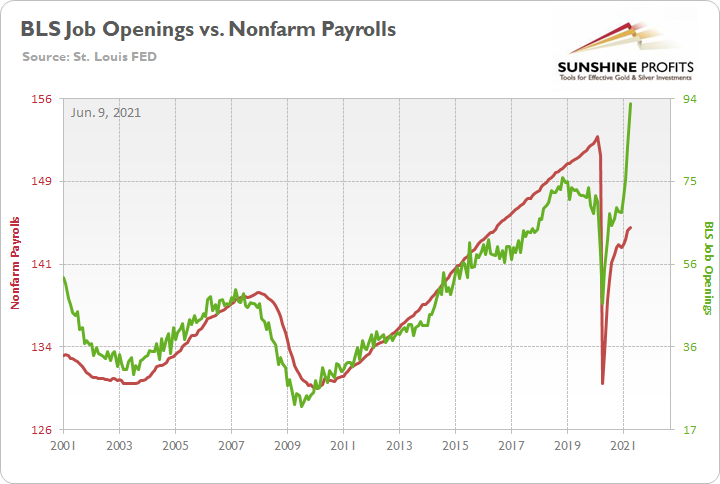
To explain, the red line above tracks U.S. nonfarm payrolls, while the green line above tracks U.S. job openings. If you analyze the relationship, you can see that the latter is often a strong predictor of the former. However, with enhanced unemployment benefits still in effect until mid-to-late June or early July (across ~25 states) – and nationwide until Sep. 6 (expected) – the shift likely won’t occur overnight. But once the benefits expire, U.S. nonfarm payrolls will likely spike in August (reflecting July’s data) and September (reflecting August’s data) and lift the U.S. 10-Year Treasury yield and the USD Index in the process.
The Nationwide Cut-Off Incoming
Moreover, after U.S. nonfarm payrolls came in at 943,000 vs. 845,000 expected (Dow Jones consensus estimate) on Aug. 6, the employment outperformance buoyed U.S. Treasury yields and the USD Index and dropped the guillotine on the PMs. And with another reenactment likely to occur over the medium term, the Delta variant is only delaying the inevitable.
Please see below:
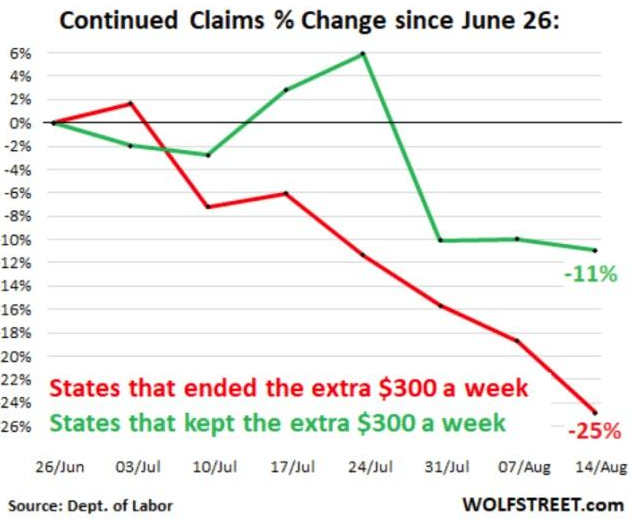
To explain, the green line above tracks continuing jobless claims in U.S. states where enhanced unemployment benefits are still in effect, while the red line above tracks continuing jobless claims in U.S. states where enhanced unemployment benefits have expired. If you analyze the right side of the chart, you can see that states which eliminated enhanced unemployment benefits saw continuing jobless claims fall by 25% since June 26. Conversely, continuing jobless claims in ‘generous’ states have only fallen by 11% during the same timeframe. As a result, with September fast approaching, the nationwide cut-off will likely accelerate the employment momentum. And with that, the Delta-fueled delay in the Fed’s taper timeline will likely prove immaterial.
Third, while the minutes from the Fed’s July 27/28 policy meeting (released on Aug. 18) revealed that “the staff's near-term outlook for inflation was revised up further in response to incoming data” and that “most participants remarked that this standard had been achieved with respect to the price-stability goal,” inflationary pressures are still sizzling. For example, IHS Markit released its U.S. Composite, Manufacturing and Services PMIs on Aug. 23. And while the consolidated output index declined from 59.9 in July to 55.4 in August – due to “capacity pressures, material shortages and the spread of the Delta variant” – the inflation acceleration showed no signs of slowing down.
Regarding the U.S. manufacturing sector:
“Challenges fulfilling new orders and an unprecedented deterioration in vendor performance led to the second-steepest rise in backlogs of work in the over 14-year series history…. Contributing to the substantial rise in cost burdens during August was a marked increase in purchasing activity amid efforts to build safety stocks. The rate of input price inflation was the fastest on record (since May 2007) as suppliers hiked their charges again. Meanwhile, firms increased their own selling prices at the steepest rate in the series history in the hope of partially passing on higher costs to clients.”
Regarding the U.S. services sector, which incurs the brunt of the Delta variant’s wrath:
“Input costs rose markedly and at one of the fastest paces on record amid significant hikes in supplier prices and greater wage bills. Subsequently, service providers raised their selling prices at a sharper rate.”
Survey About Inflation? Higher and Higher…
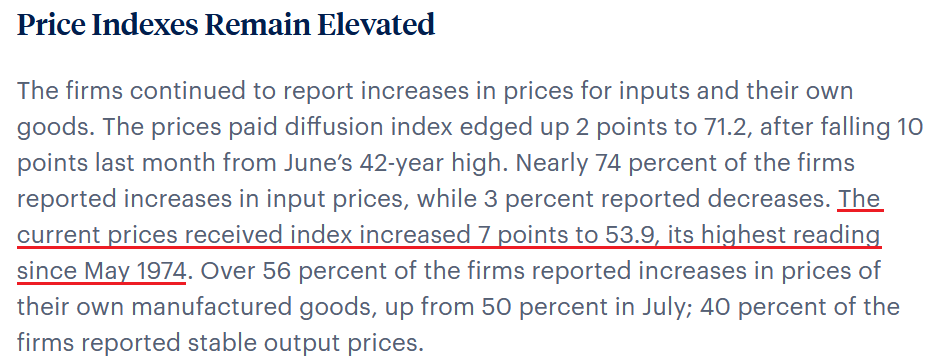
As further evidence, the Philadelphia Fed released its Manufacturing Business Outlook Survey on Aug. 19, and while its diffusion index for current activity “decreased 3 points to 19.4 in August,” the inflationary record remains on repeat:
 Source: Philadelphia Fed
On top of that, respondents were asked about their 12-month inflation expectations, and their answers were compared to the initial responses in May. For context, it’s important to remember that the Fed has a 2% annual inflation target:
“Regarding their own prices, the firms’ median forecast was for an increase of 5.0 percent, the same as when the question was last asked in May. The firms’ actual price change over the past year was 3.0 percent. The firms expect their employee compensation costs (wages plus benefits on a per employee basis) to rise 4.0 percent over the next four quarters, the same as in May. When asked about the rate of inflation for U.S. consumers over the next year, the firms’ median forecast was 5.0 percent, an increase from 4.0 percent in May.”
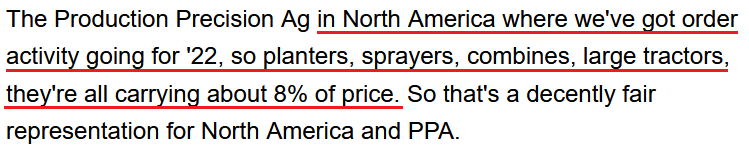
Finally, the corporate earnings calls remain riddled with inflationary warnings. And with Deere & Company – an American manufacturer of machinery, engines and heavy agricultural equipment – the latest to sound the alarm, big business continues to up the ante. Management said on Aug. 20:
“For Fiscal year '21, our full-year outlook for net income is now forecast to be between $5.7 and $9.5 billion. The full-year forecast reflects the impact from higher raw material prices and logistics costs, which we estimate to have added an additional $1.5 billion in expense, experienced mostly in the back half of the year.”
And how is the company responding to the inflationary pressures?
 Source: Deere & Company/Seeking Alpha
The bottom line? With inflation surging, employment improving and the Fed’s dual mandate close to completion, the Delta variant is likely a bump in the road. Thus, while the PMs rejoiced over the prospective taper delay, confronting medium-term reality will likely be unkind.
In conclusion, it was off to the races for the PMs on Aug. 23, as everything from oil to copper to Tesla sought higher ground. However, while the daily celebration emphasized the power of sentiment, when narratives lack fundamental foundations, it’s important not to overreact. As a result, while the PMs surfed investors’ wave of daily optimism, the metals’ medium-term outlook still remains profoundly bearish.
Overview of the Upcoming Part of the Decline
- The corrective upswing in gold is over, and the big decline seems to be already underway.
- After the miners slide in a meaningful and volatile way but silver doesn’t (and it just declines moderately), I plan to switch from short positions in miners to short positions in silver. At this time, it’s too early to say at what price levels this would take place – perhaps with gold close to $1,600. I plan to exit those short positions when gold shows substantial strength relative to the USD Index, while the latter is still rallying. This might take place with gold close to $1,350 - $1,500 and the entire decline (from above $1,900 to about $1,475) would be likely to take place within 6-20 weeks. I expect silver to fall the hardest in the final part of the move. This moment (when gold performs very strongly against the rallying USD and miners are strong relative to gold – after gold has already declined substantially) is likely to be the best entry point for long-term investments, in my view. This might also happen with gold close to $1,475, but it’s too early to say with certainty at this time.
- As a confirmation for the above, I will use the (upcoming or perhaps we have already seen it?) top in the general stock market as the starting point for the three-month countdown. The reason is that after the 1929 top, gold miners declined for about three months after the general stock market started to slide. We also saw some confirmations of this theory based on the analogy to 2008. All in all, the precious metals sector would be likely to bottom about three months after the general stock market tops.
- The above is based on the information available today, and it might change in the following days/weeks.
Please note that the above timing details are relatively broad and “for general overview only” – so that you know more or less what I think and how volatile I think the moves are likely to be – on an approximate basis. These time targets are not binding or clear enough for me to think that they should be used for purchasing options, warrants or similar instruments.
Letters to the Editor
Q: Hi, thank you for your great analysis. When the GDX hits your target of $28 or so... do you plan to take short-term long positions?
A: It’s unclear yet. It depends on the way it reaches this target. It seems that we are in a very strong downtrend, so trying to time corrective upswings is particularly risky. I’d need to see a really substantial combination of bullish confirmations to bet on higher prices.
Ideally, we would switch to a short position in silver before the GDX reaches $28, and the GDX would show strength while silver declines profoundly. At the same time, gold would reach its previous 2021 lows, and the USD Index would encounter some kind of resistance. In this kind of situation, I would likely open a temporary long position in mining stocks. But if we don’t get the above-mentioned scenario, it will depend on what we actually get.
Q: I appreciate your clarification in Alert#2... but it leaves some uncertainty about the dollar and the HUI. Do you think that maybe it would be convenient to reduce some amount? I trust you and your sincerity.
A: Thank you for your trust – it means a lot to me. I’m not adjusting the position size of the current short position, and I provided an explanation for that in the technical part of today’s analysis.
Summary
To summarize, the medium- and short-term outlooks for the precious metals sector remain down. The breakdown to new yearly lows in the HUI Index and to new yearly highs in the USD Index serve as profound confirmations that a huge downswing in the precious metals sector is underway and that its biggest part is likely just ahead. Regardless of yesterday’s upswing in the PMs and miners.
It seems that our profits from the short positions are going to become truly epic in the following weeks.
After the sell-off (that takes gold to about $1,350 - $1,500), I expect the precious metals to rally significantly. The final part of the decline might take as little as 1-5 weeks, so it's important to stay alert to any changes.
Most importantly, please stay healthy and safe. We made a lot of money last March and this March, and it seems that we’re about to make much more on the upcoming decline, but you have to be healthy to enjoy the results.
As always, we'll keep you - our subscribers - informed.
By the way, we’re currently providing you with the possibility to extend your subscription by a year, two years or even three years with a special 20% discount. This discount can be applied right away, without the need to wait for your next renewal – if you choose to secure your premium access and complete the payment upfront. The boring time in the PMs is definitely over, and the time to pay close attention to the market is here. Naturally, it’s your capital, and the choice is up to you, but it seems that it might be a good idea to secure more premium access now while saving 20% at the same time. Our support team will be happy to assist you in the above-described upgrade at preferential terms – if you’d like to proceed, please contact us.
To summarize:
Trading capital (supplementary part of the portfolio; our opinion): Full speculative short positions (300% of the full position) in mining stocks are justified from the risk to reward point of view with the following binding exit profit-take price levels:
Mining stocks (price levels for the GDXJ ETF): binding profit-take exit price: $35.73; stop-loss: none (the volatility is too big to justify a stop-loss order in case of this particular trade)
Alternatively, if one seeks leverage, we’re providing the binding profit-take levels for the JDST (2x leveraged) and GDXD (3x leveraged – which is not suggested for most traders/investors due to the significant leverage). The binding profit-take level for the JDST: $16.96; stop-loss for the JDST: none (the volatility is too big to justify a SL order in case of this particular trade); binding profit-take level for the GDXD: $35.46; stop-loss for the GDXD: none (the volatility is too big to justify a SL order in case of this particular trade).
For-your-information targets (our opinion; we continue to think that mining stocks are the preferred way of taking advantage of the upcoming price move, but if for whatever reason one wants / has to use silver or gold for this trade, we are providing the details anyway.):
Silver futures upside profit-take exit price: unclear at this time - initially, it might be a good idea to exit, when gold moves to $1,683
Gold futures upside profit-take exit price: $1,683
HGD.TO – alternative (Canadian) inverse 2x leveraged gold stocks ETF – the upside profit-take exit price: $11.38
Long-term capital (core part of the portfolio; our opinion): No positions (in other words: cash
Insurance capital (core part of the portfolio; our opinion): Full position
Whether you already subscribed or not, we encourage you to find out how to make the most of our alerts and read our replies to the most common alert-and-gold-trading-related-questions.
Please note that we describe the situation for the day that the alert is posted in the trading section. In other words, if we are writing about a speculative position, it means that it is up-to-date on the day it was posted. We are also featuring the initial target prices to decide whether keeping a position on a given day is in tune with your approach (some moves are too small for medium-term traders, and some might appear too big for day-traders).
Additionally, you might want to read why our stop-loss orders are usually relatively far from the current price.
Please note that a full position doesn't mean using all of the capital for a given trade. You will find details on our thoughts on gold portfolio structuring in the Key Insights section on our website.
As a reminder - "initial target price" means exactly that - an "initial" one. It's not a price level at which we suggest closing positions. If this becomes the case (like it did in the previous trade), we will refer to these levels as levels of exit orders (exactly as we've done previously). Stop-loss levels, however, are naturally not "initial", but something that, in our opinion, might be entered as an order.
Since it is impossible to synchronize target prices and stop-loss levels for all the ETFs and ETNs with the main markets that we provide these levels for (gold, silver and mining stocks - the GDX ETF), the stop-loss levels and target prices for other ETNs and ETF (among other: UGL, GLL, AGQ, ZSL, NUGT, DUST, JNUG, JDST) are provided as supplementary, and not as "final". This means that if a stop-loss or a target level is reached for any of the "additional instruments" (GLL for instance), but not for the "main instrument" (gold in this case), we will view positions in both gold and GLL as still open and the stop-loss for GLL would have to be moved lower. On the other hand, if gold moves to a stop-loss level but GLL doesn't, then we will view both positions (in gold and GLL) as closed. In other words, since it's not possible to be 100% certain that each related instrument moves to a given level when the underlying instrument does, we can't provide levels that would be binding. The levels that we do provide are our best estimate of the levels that will correspond to the levels in the underlying assets, but it will be the underlying assets that one will need to focus on regarding the signs pointing to closing a given position or keeping it open. We might adjust the levels in the "additional instruments" without adjusting the levels in the "main instruments", which will simply mean that we have improved our estimation of these levels, not that we changed our outlook on the markets. We are already working on a tool that would update these levels daily for the most popular ETFs, ETNs and individual mining stocks.
Our preferred ways to invest in and to trade gold along with the reasoning can be found in the how to buy gold section. Furthermore, our preferred ETFs and ETNs can be found in our Gold & Silver ETF Ranking.
As a reminder, Gold & Silver Trading Alerts are posted before or on each trading day (we usually post them before the opening bell, but we don't promise doing that each day). If there's anything urgent, we will send you an additional small alert before posting the main one.
Thank you.
Przemyslaw Radomski, CFA
Founder, Editor-in-chief

