

The key things that I described in last week’s flagship analysis (posted on Thursday) remain up-to-date, but there are a few specific comments that I would like to make today about Friday’s session.
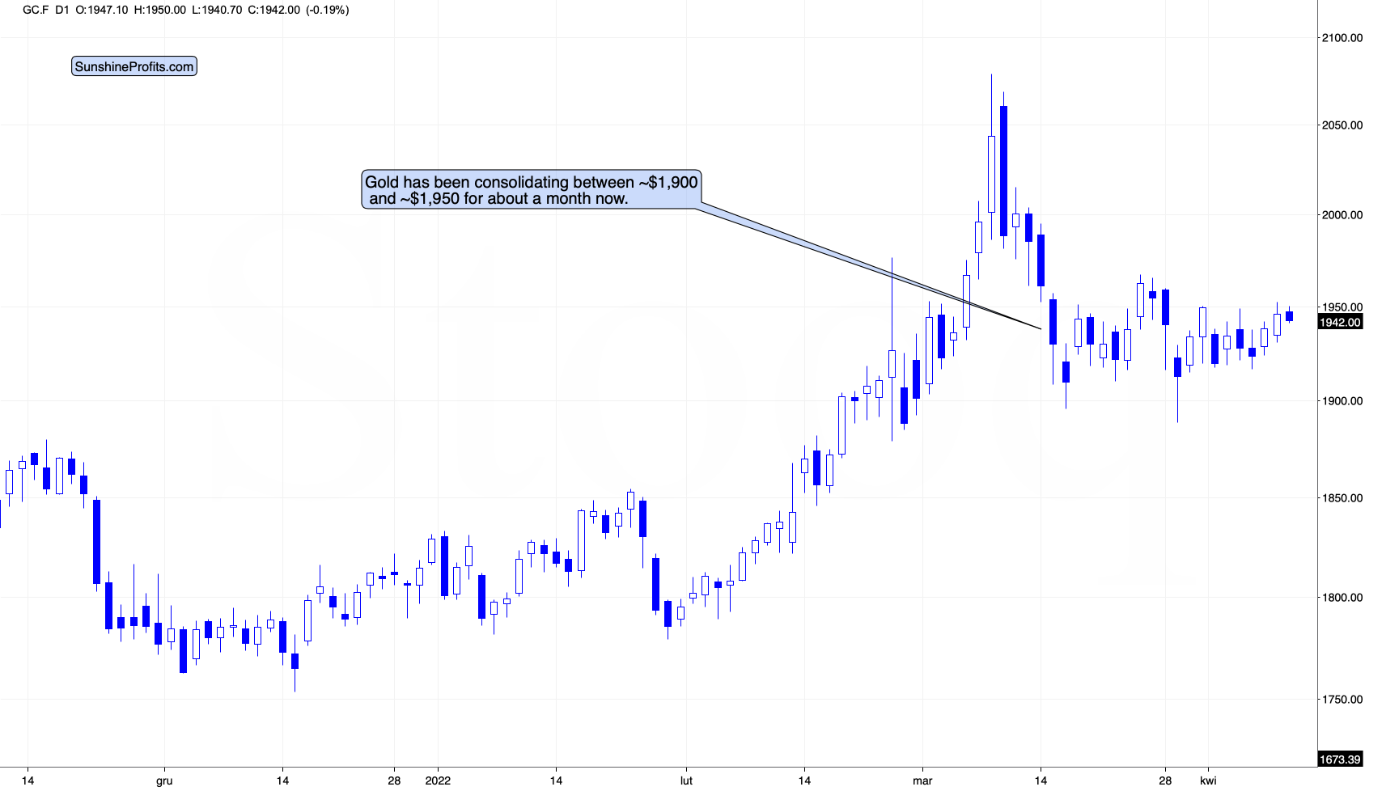
Gold prices moved higher on Friday, and they are somewhat down so far today, which means that overall the monthly consolidation continues.
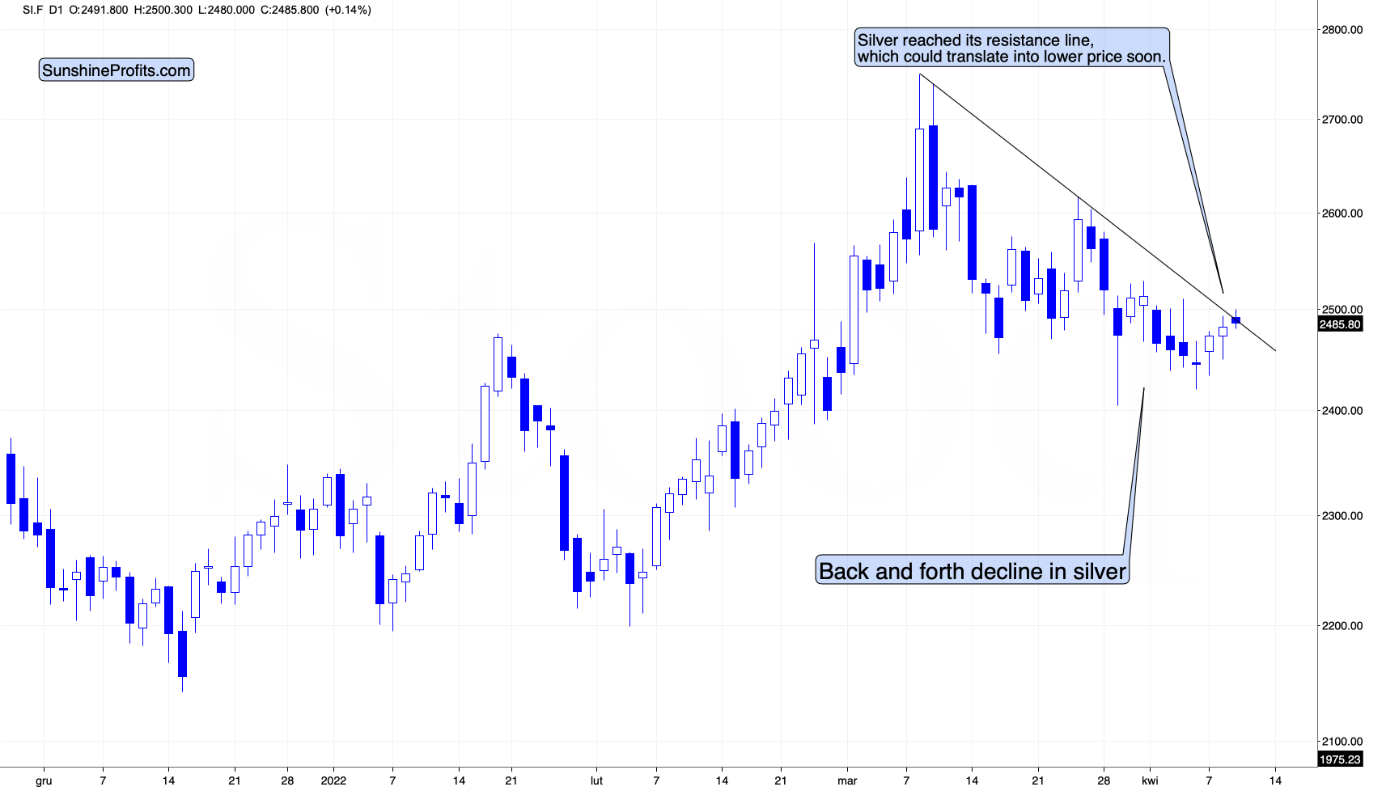
Silver prices moved higher, but it was nothing to write home about, and overall, silver continues to decline in a back-and-forth manner.
Moreover, since the white metal just moved to its declining resistance line, the odds are that we’ll see another short-term downswing shortly.
The above-mentioned moves in gold and silver are in perfect tune with what we saw in 2012 in both precious metals right after the final pre-slide top.
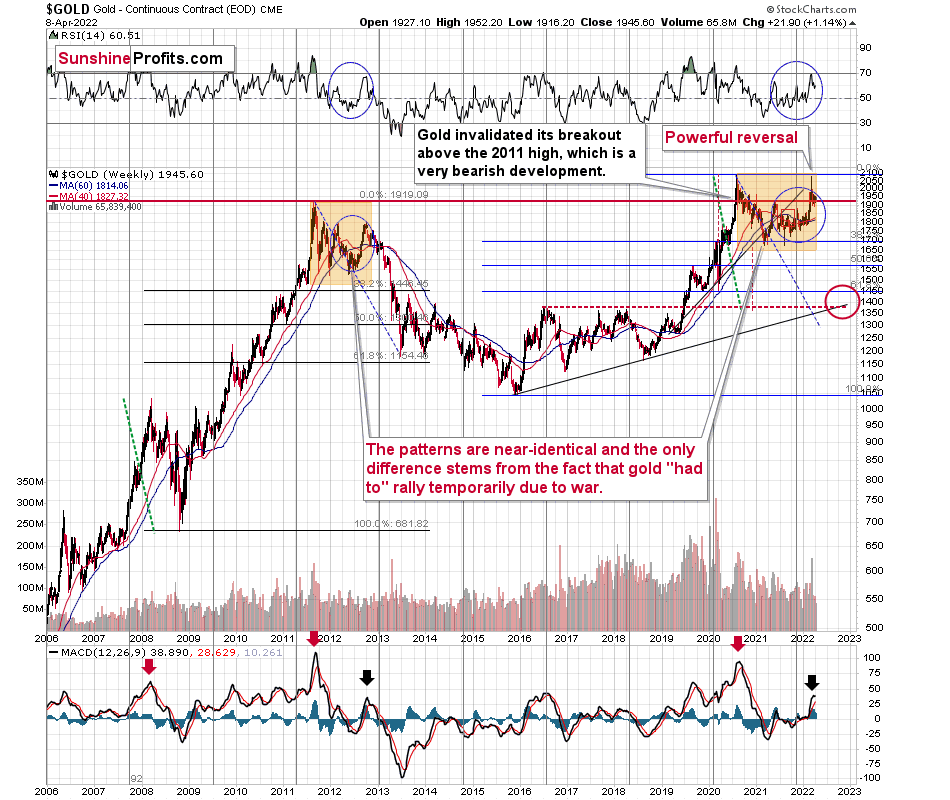
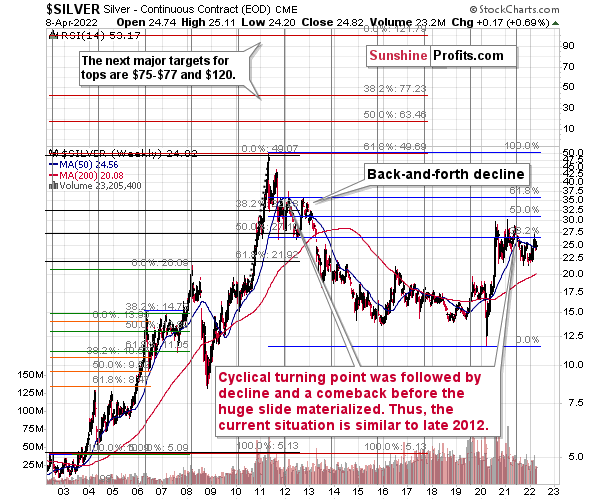
In both cases, the decline first took the form of a back-and-forth move lower, which is generally what we see on the charts right now. Therefore, lower, not higher, values of precious metals are to be expected in the medium term, even though it’s not 100% clear when the short-term consolidation will end.
Silver’s move to its declining resistance line suggests that another short-term decline is just around the corner, but then again, silver is known for fake breakouts right before declining, so it wouldn’t be surprising to see some short-term strength before a much bigger decline resumes.
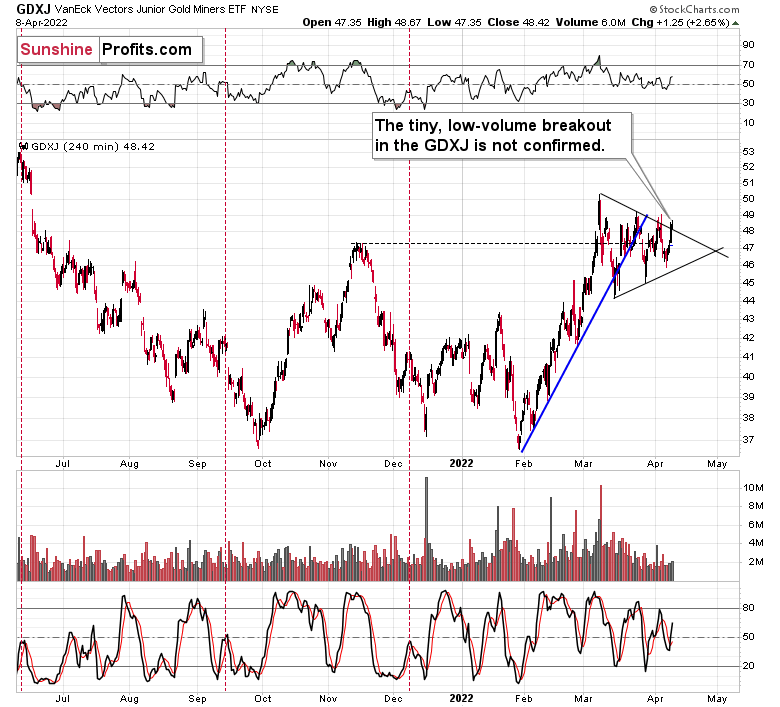
Junior miners moved slightly above their triangle pattern, but this breakout is far from being confirmed. The GDXJ closed the day just slightly above the upper border of the triangle, and the move took place on relatively low volume. This indicates that market participants are not convinced that the next move will really be to the upside.
Also, since I already wrote about the similarity to 2012 in gold and silver, let’s see how GDXJ performed at that time.
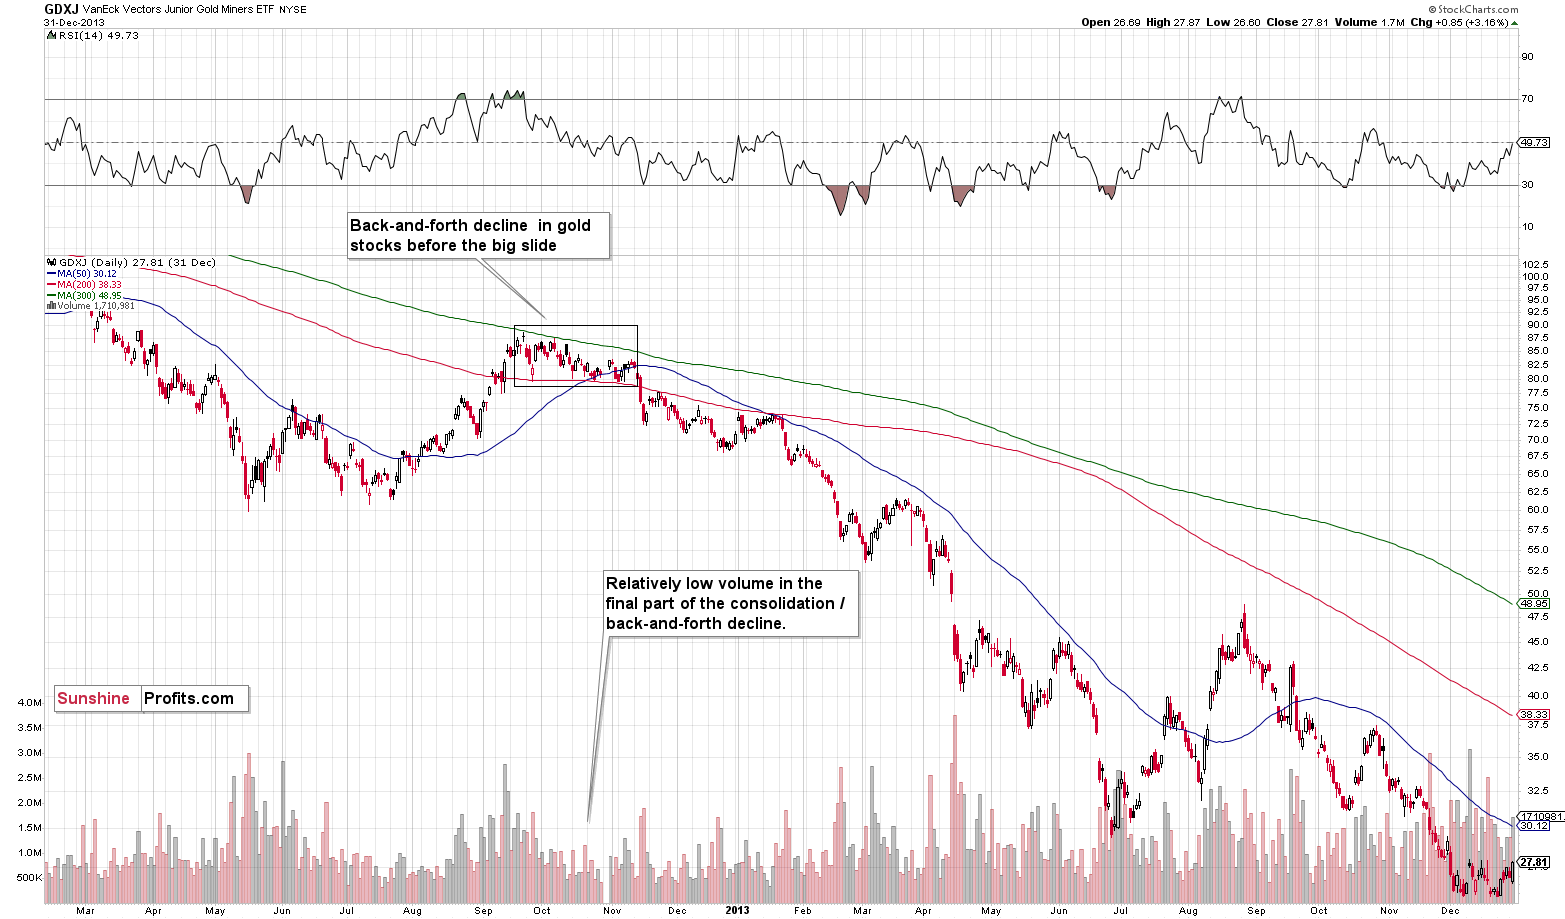
In short, it performed similarly.
At first, in late-September 2012 and early-October 2012, junior miners consolidated, and then they declined, thus entering the back-and-forth decline mode. It happened on relatively low volume.
What happened next?
Well, at the late-2012 top, the GDXJ closed at $87.83. Months later, it closed at $29.59, or roughly one third of its initial price. In other words, junior miners erased about two-thirds of their initial price. Yes, it was a great time for inversely trading instruments. The JDST wasn’t trading at that time yet, but DUST (which trades opposite to GDX) moved up by over 600%.
Even though the short-term outlook is somewhat unclear, the medium-term outlook for the precious metals sector remains very bearish, and the upside potential for the short positions in junior mining stocks remains enormous, in my opinion. In my view, patience is likely to be very well rewarded.
Briefly: in our opinion, full (300% of the regular position size) speculative short positions in junior mining stocks are justified from the risk/reward point of view at the moment of publishing this Alert.
The key things that I described in last week’s flagship analysis (posted on Thursday) remain up-to-date, but there are a few specific comments that I would like to make today about Friday’s session.
Gold prices moved higher on Friday, and they are somewhat down so far today, which means that overall the monthly consolidation continues.
Silver prices moved higher, but it was nothing to write home about, and overall, silver continues to decline in a back-and-forth manner.
Moreover, since the white metal just moved to its declining resistance line, the odds are that we’ll see another short-term downswing shortly.
The above-mentioned moves in gold and silver are in perfect tune with what we saw in 2012 in both precious metals right after the final pre-slide top.
In both cases, the decline first took the form of a back-and-forth move lower, which is generally what we see on the charts right now. Therefore, lower, not higher, values of precious metals are to be expected in the medium term, even though it’s not 100% clear when the short-term consolidation will end.
Silver’s move to its declining resistance line suggests that another short-term decline is just around the corner, but then again, silver is known for fake breakouts right before declining, so it wouldn’t be surprising to see some short-term strength before a much bigger decline resumes.
Junior miners moved slightly above their triangle pattern, but this breakout is far from being confirmed. The GDXJ closed the day just slightly above the upper border of the triangle, and the move took place on relatively low volume. This indicates that market participants are not convinced that the next move will really be to the upside.
Also, since I already wrote about the similarity to 2012 in gold and silver, let’s see how GDXJ performed at that time.
In short, it performed similarly.
At first, in late-September 2012 and early-October 2012, junior miners consolidated, and then they declined, thus entering the back-and-forth decline mode. It happened on relatively low volume.
What happened next?
Well, at the late-2012 top, the GDXJ closed at $87.83. Months later, it closed at $29.59, or roughly one third of its initial price. In other words, junior miners erased about two-thirds of their initial price. Yes, it was a great time for inversely trading instruments. The JDST wasn’t trading at that time yet, but DUST (which trades opposite to GDX) moved up by over 600%.
Even though the short-term outlook is somewhat unclear, the medium-term outlook for the precious metals sector remains very bearish, and the upside potential for the short positions in junior mining stocks remains enormous, in my opinion. In my view, patience is likely to be very well rewarded.
Having said that, let’s take a look at the markets from a more fundamental point of view.
The Real Deal
While the PMs suffered mightily in 2021 and early 2022, the Russia-Ukraine conflict shifted the narrative. Now, commodities are en vogue, and the trend-following algorithms are riding the momentum.
However, history is undefeated, and gold is following its post-crisis script. To explain, U.S. real yields have a material impact on the PMs. When real interest rates are negative, bond investors earn a higher theoretical return by owning gold. As a result, bond investors often shift their asset allocations, and the PMs benefit.
Conversely, when real interest rates turn positive, nominal yields outpace inflation and bonds offer a higher theoretical return than gold. For context, I'm referencing the breakeven inflation rates that pertain to specific bond maturities, not the Consumer Price Index (CPI). Moreover, with real interest rates poised to turn positive in the coming months, gold should suffer profoundly once its war premiums unravel.
The historical fundamental playbook shows:
- When a crisis erupts, the Fed cuts interest rates and commences QE.
- Real yields turn deeply negative.
- Gold rallies sharply.
- As the Fed normalizes monetary policy, real yields surge and gold plunges.
Please see below:
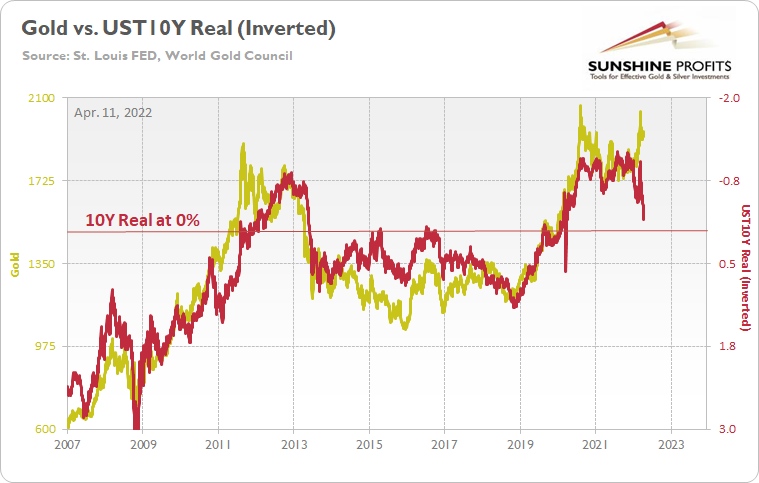
To explain, the gold line above tracks the price tallied by the World Gold Council, while the red line above tracks the inverted U.S. 10-Year real yield. For context, inverted means that the latter's scale is flipped upside down and that a rising red line represents a falling U.S. 10-Year real yield, while a falling red line represents a rising U.S. 10-Year real yield.
Moreover, while I've shown variations of this chart before, the long-term implications are profound. For example, if you analyze the left side of the chart, you can see that the U.S. 10-Year real yield soared and gold plunged during the global financial crisis (GFC). However, when the Fed launched QE and the U.S. 10-Year real yield sank to an all-time low, gold hit a new all-time high along the way.
Furthermore, the current situation is a spitting image of the past. When Fed Chairman Jerome Powell performed a dovish pivot in late 2018, the U.S. 10-Year real yield suffered. Then, when the Fed fired its liquidity bazooka in March 2020, it pushed the metric to another all-time low, and – surprise, surprise – gold hit another all-time high.
However, we're now in stage four of the historical fundamental playbook. With the Fed normalizing policy, the U.S. 10-Year real yield has surged in recent weeks. Moreover, the Fed needs to push the metric above 0% to curb inflation.
Thus, it's likely only a matter of time until the milestone is achieved. In addition, a U.S. 10-Year real yield of 0% implies a gold price of about $1,500, and while the current narrative suggests otherwise, is this time really different?
To that point, while gold permabulls believe that none of this matters, investors will likely ignore the data at their own peril. For example, the chart above is comprised of daily figures. If the fit of the two lines wasn't enough, gold and the U.S. 10-Year real yield have a daily correlation of -0.92 since 2007. Therefore, we must ignore 15+ years of historical data to assume that gold's best days lie ahead.
To clarify: I'm not writing that gold should decline because I want it to materialize. I'm simply presenting objective data that shows how out of touch sentiment is with fundamental reality. As evidence, the permabulls are all-in on the "this time is different" mantra.
Please see below:
 Source: Twitter
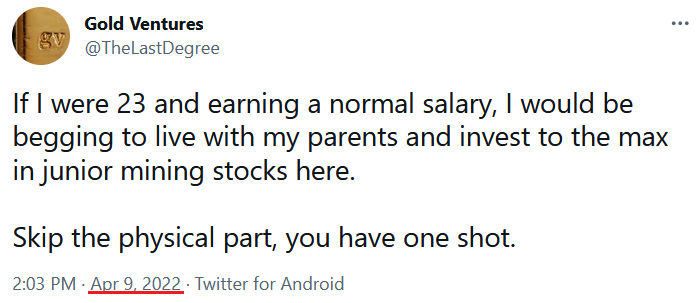
Thus, does this seem like good advice with the Fed normalizing policy, real yields rallying, and the yellow metal following the same post-GFC script? As such, gold investors have let higher prices cloud their judgment. With the metals remaining resilient, investors assume that fundamentals are the driving force behind the recent gains. However, trend-following algorithms – that are short-term oriented and don’t care about fundamentals – move markets. When they bail, reality re-emerges.
Let’s conduct a history lesson. Here are some headlines that emerged when the U.S. 10-Year real yield was at or near an all-time low and gold was at or near an all-time high in 2011-2012:
 Source: MarketWatch
And:
 Source: CNBC
And:
 Source: Business Insider
As a result, while the permabulls assumed that the Fed wouldn’t normalize policy, and/or the U.S. 10-Year real yield didn’t matter in 2011-2012, the rest is history. Now, we have commentators encouraging investors to “invest to the max in junior mining stocks here” with no regard for fundamentals or historical precedent, and, of course, more gold permabulls are joining the fray:
 Source: Kitco
And:
 Source: Business Standard
Notice a pattern here? I’ve noted on several occasions that investors are often the most bearish at the bottom and the most bullish at the top. However, with 2011-2012 a clear example of gold outperforming the U.S. 10-Year real yield and then eventually plunging, it’s surprising that the crowd would fall for the same trick twice. However, it’s simply how investor psychology works.
Furthermore, while the Russia-Ukraine conflict allows investors to ignore gold’s rapidly declining domestic fundamentals, more Fed officials have reiterated their hawkish message in recent days.
For example, St. Louis Fed President James Bullard said on Apr. 7: “U.S. inflation is exceptionally high, and that doesn’t mean 2.1% or 2.2% or something. This means comparable to what we saw in the high inflation era in the 1970s and early 1980s. Even if you’re very generous to the Fed in interpreting what the inflation rate really is today (…), you’d have to raise the policy rate a lot.”
In addition:
“The difference between today and the 1970s is central bankers have a lot more credibility,” he said. “In the ’70s, no one believed the Fed would do anything about inflation. It was kind of a chaotic era. You really needed [former Fed Chair Paul] Volcker to come in (…). He slayed the inflation dragon and established credibility. After that, people believed the central bank would bring inflation under control.”
As a result, Bullard is still warning that the Fed isn’t playing around with inflation.
Please see below:
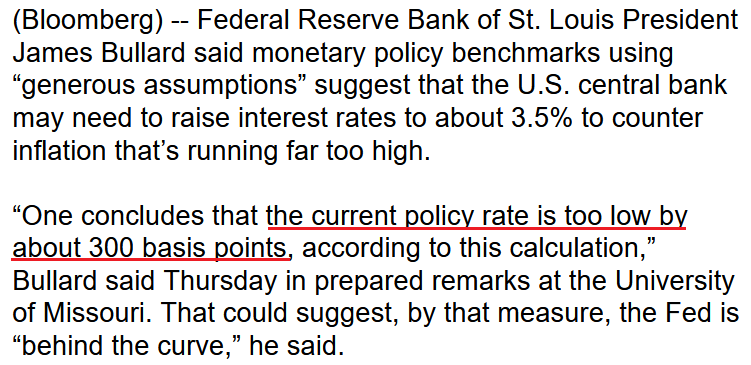 Source: Bloomberg
Likewise, Atlanta Fed President Raphael Bostic said on Apr. 7: "It's time that we get off of our emergency stance. I think it's really appropriate that we move our policy closer to a neutral position, but I think we need to do it in a measured way."
In addition, Chicago Fed President Charles Evans said on Apr. 7: "I'm optimistic that we can get to neutral, look around, and find that we're not necessarily that far from where we need to go."
For context, Bullard’s view of neutral (3%) is on the hawkish side. However, since Bostic and Evans noted previously that neutral is in the 2% to 2.5% range, that’s eight to 10 rate hikes in 12 months or less, and that amount of tightening dwarfs what we witnessed post-GFC.
Furthering the point, Cleveland Fed President Loretta Mester told CBS on Apr. 10:
“We are very committed to maintaining our and achieving our dual mandate goals of maximum employment and price stability. And we are taking actions, we have the process underway to remove accommodation (…). That will help to reduce excess demand, which is outpacing constrained supply and bring price pressures down.”
She added:
“It's no doubt that it's very painful to have these high prices. I mean, it's even worse if you look at low-income consumers because they spend a greater portion of their consumption basket on the essentials housing, you know, energy, food and all those prices are going up at a higher inflation rate than just the average inflation rate (…).”
“This is a serious problem and it's a real painful problem for many in the country. Wages are going up, so that's a good thing. But for many families, they're not going up at the pace that inflation is going up. So, it's very important that we get inflation under control.”
The bottom line? Shades of 2011-2012 are abound, and gold permabulls feel rejuvenated. However, the reality is that real yields are rising, and the Fed is much more hawkish now than it was post-GFC. Moreover, the Fed needs to push the U.S. 10-Year real yield into positive territory to curb abnormally high inflation. As a result, while timing remains uncertain, the PMs should suffer profound drawdowns when sentiment shifts.
In conclusion, the PMs rallied on Apr. 8, as momentum remains abundant. However, while prices and optimism have increased in recent weeks, fundamentals have deteriorated sharply. Moreover, with the Fed’s war on inflation bullish for the USD Index and the U.S. 10-Year real yield, the PMs’ fundamental outlooks should worsen even more in the coming months. Thus, the data highlights how the PMs are on the wrong side of the 2011-2012 analog, and overzealous investors should suffer the same consequences over the medium term.
Overview of the Upcoming Part of the Decline
- It seems to me that the post-decline consolidation is now over or very close to being over , and that gold, silver, and mining stocks are now likely to continue their medium-term decline.
- It seems that the first (bigger) stop for gold will be close to its previous 2021 lows, slightly below $1,800 . Then it will likely correct a bit, but it’s unclear if I want to exit or reverse the current short position based on that – it depends on the number and the nature of the bullish indications that we get at that time.
- After the above-mentioned correction, we’re likely to see a powerful slide, perhaps close to the 2020 low ($1,450 - $1,500).
- If we see a situation where miners slide in a meaningful and volatile way while silver doesn’t (it just declines moderately), I plan to – once again – switch from short positions in miners to short positions in silver. At this time, it’s too early to say at what price levels this could take place, and if we get this kind of opportunity at all – perhaps with gold close to $1,600.
- I plan to exit all remaining short positions once gold shows substantial strength relative to the USD Index while the latter is still rallying. This may be the case with gold close to $1,350 - $1,400. I expect silver to fall the hardest in the final part of the move. This moment (when gold performs very strongly against the rallying USD and miners are strong relative to gold after its substantial decline) is likely to be the best entry point for long-term investments, in my view. This can also happen with gold close to $1,375, but at the moment it’s too early to say with certainty.
- As a confirmation for the above, I will use the (upcoming or perhaps we have already seen it?) top in the general stock market as the starting point for the three-month countdown. The reason is that after the 1929 top, gold miners declined for about three months after the general stock market started to slide. We also saw some confirmations of this theory based on the analogy to 2008. All in all, the precious metals sector is likely to bottom about three months after the general stock market tops.
- The above is based on the information available today, and it might change in the following days/weeks.
You will find my general overview of the outlook for gold on the chart below:
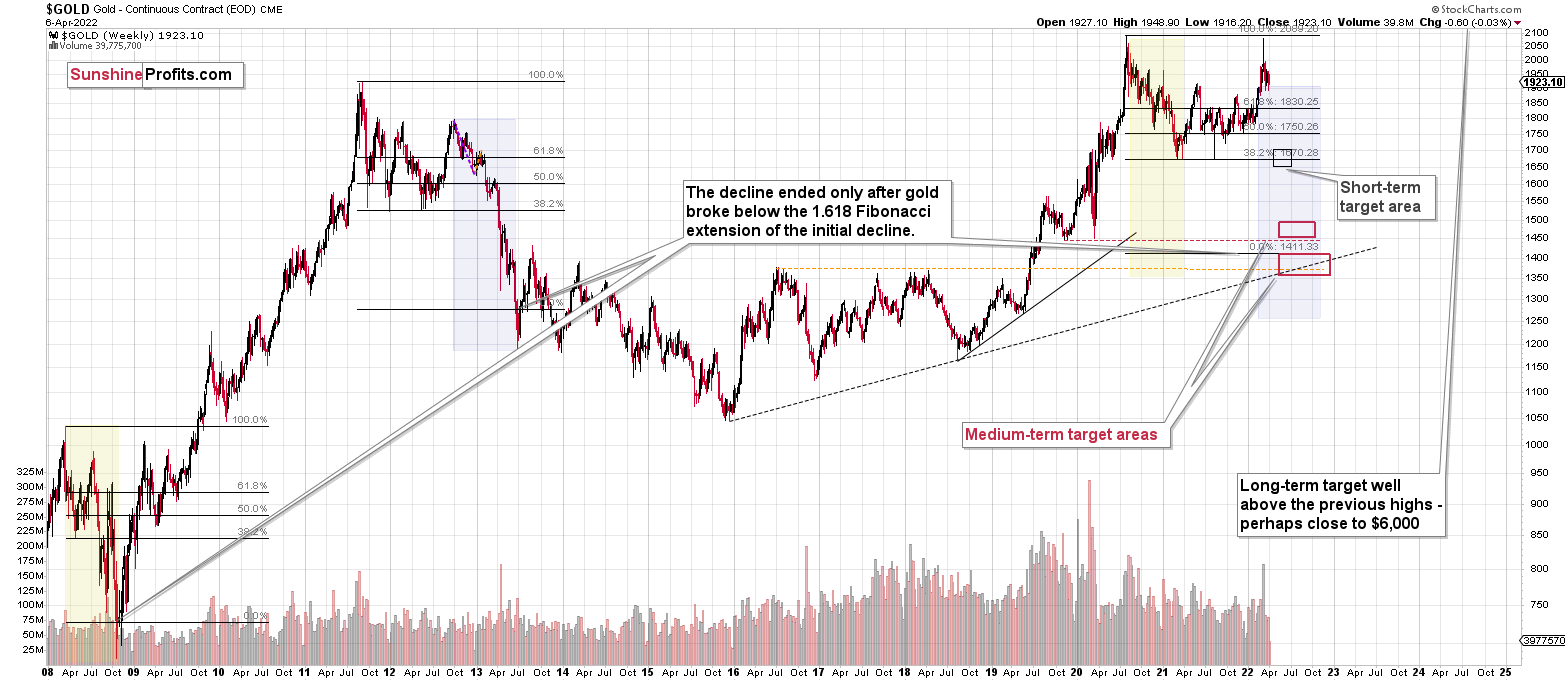
Please note that the above timing details are relatively broad and “for general overview only” – so that you know more or less what I think and how volatile I think the moves are likely to be – on an approximate basis. These time targets are not binding or clear enough for me to think that they should be used for purchasing options, warrants or similar instruments.
Summary
Summing up, despite the recent rally in gold, the outlook for junior mining stocks remains exactly as I described previously.
Crude oil’s extreme outperformance, the stock market’s weakness, and critical medium-term resistance levels reached by gold (all-time high!) and junior mining stocks – all indicate that the tops are at hand or have just formed.
Investing and trading are difficult. If it was easy, most people would be making money – and they’re not. Right now, it’s most difficult to ignore the urge to “run for cover” if you physically don’t have to. The markets move on “buy the rumor and sell the fact.” This repeats over and over again in many (all?) markets, and we have direct analogies to similar situations in gold itself. Junior miners are likely to decline the most, also based on the massive declines that are likely to take place (in fact, they have already started) in the stock markets.
From the medium-term point of view, the two key long-term factors remain the analogy to 2013 in gold and the broad head and shoulders pattern in the HUI Index. They both suggest much lower prices ahead.
It seems that our profits from short positions are going to become truly epic in the coming months.
After the sell-off (that takes gold to about $1,350-$1,500), I expect the precious metals to rally significantly. The final part of the decline might take as little as 1-5 weeks, so it's important to stay alert to any changes.
As always, we'll keep you - our subscribers - informed.
To summarize:
Trading capital (supplementary part of the portfolio; our opinion): Full speculative short positions (300% of the full position) in junior mining stocks are justified from the risk to reward point of view with the following binding exit profit-take price levels:
Mining stocks (price levels for the GDXJ ETF): binding profit-take exit price: $34.63; stop-loss: none (the volatility is too big to justify a stop-loss order in case of this particular trade)
Alternatively, if one seeks leverage, we’re providing the binding profit-take levels for the JDST (2x leveraged) and GDXD (3x leveraged – which is not suggested for most traders/investors due to the significant leverage). The binding profit-take level for the JDST: $14.98; stop-loss for the JDST: none (the volatility is too big to justify a SL order in case of this particular trade); binding profit-take level for the GDXD: $25.48; stop-loss for the GDXD: none (the volatility is too big to justify a SL order in case of this particular trade).
For-your-information targets (our opinion; we continue to think that mining stocks are the preferred way of taking advantage of the upcoming price move, but if for whatever reason one wants / has to use silver or gold for this trade, we are providing the details anyway.):
Silver futures downside profit-take exit price: $19.12
SLV profit-take exit price: $17.72
ZSL profit-take exit price: $38.28
Gold futures downside profit-take exit price: $1,683
HGD.TO – alternative (Canadian) inverse 2x leveraged gold stocks ETF – the upside profit-take exit price: $11.79
HZD.TO – alternative (Canadian) inverse 2x leveraged silver ETF – the upside profit-take exit price: $29.48
Long-term capital (core part of the portfolio; our opinion): No positions (in other words: cash
Insurance capital (core part of the portfolio; our opinion): Full position
Whether you already subscribed or not, we encourage you to find out how to make the most of our alerts and read our replies to the most common alert-and-gold-trading-related-questions.
Please note that we describe the situation for the day that the alert is posted in the trading section. In other words, if we are writing about a speculative position, it means that it is up-to-date on the day it was posted. We are also featuring the initial target prices to decide whether keeping a position on a given day is in tune with your approach (some moves are too small for medium-term traders, and some might appear too big for day-traders).
Additionally, you might want to read why our stop-loss orders are usually relatively far from the current price.
Please note that a full position doesn't mean using all of the capital for a given trade. You will find details on our thoughts on gold portfolio structuring in the Key Insights section on our website.
As a reminder - "initial target price" means exactly that - an "initial" one. It's not a price level at which we suggest closing positions. If this becomes the case (like it did in the previous trade), we will refer to these levels as levels of exit orders (exactly as we've done previously). Stop-loss levels, however, are naturally not "initial", but something that, in our opinion, might be entered as an order.
Since it is impossible to synchronize target prices and stop-loss levels for all the ETFs and ETNs with the main markets that we provide these levels for (gold, silver and mining stocks - the GDX ETF), the stop-loss levels and target prices for other ETNs and ETF (among other: UGL, GLL, AGQ, ZSL, NUGT, DUST, JNUG, JDST) are provided as supplementary, and not as "final". This means that if a stop-loss or a target level is reached for any of the "additional instruments" (GLL for instance), but not for the "main instrument" (gold in this case), we will view positions in both gold and GLL as still open and the stop-loss for GLL would have to be moved lower. On the other hand, if gold moves to a stop-loss level but GLL doesn't, then we will view both positions (in gold and GLL) as closed. In other words, since it's not possible to be 100% certain that each related instrument moves to a given level when the underlying instrument does, we can't provide levels that would be binding. The levels that we do provide are our best estimate of the levels that will correspond to the levels in the underlying assets, but it will be the underlying assets that one will need to focus on regarding the signs pointing to closing a given position or keeping it open. We might adjust the levels in the "additional instruments" without adjusting the levels in the "main instruments", which will simply mean that we have improved our estimation of these levels, not that we changed our outlook on the markets. We are already working on a tool that would update these levels daily for the most popular ETFs, ETNs and individual mining stocks.
Our preferred ways to invest in and to trade gold along with the reasoning can be found in the how to buy gold section. Furthermore, our preferred ETFs and ETNs can be found in our Gold & Silver ETF Ranking.
As a reminder, Gold & Silver Trading Alerts are posted before or on each trading day (we usually post them before the opening bell, but we don't promise doing that each day). If there's anything urgent, we will send you an additional small alert before posting the main one.
Thank you.
Przemyslaw Radomski, CFA
Founder, Editor-in-chief

