

Briefly: in our opinion, full (250% of the regular size of the position) speculative short positions in gold, silver and mining stocks are justified from the risk/reward perspective at the moment of publishing this Alert.
They say that the partially informed investors are just as effective as partially trained surgeons – they will only hurt themselves and those around them. You don’t want to have just some information – you want and need to have a clear overview of the situation on the corresponding markets even if you’re focused on making transactions on just one or few of them. Of course, one can do both: buy and sell without the above, but they would be robbing themselves from the opportunity to get more information that would push the odds of growing their capital in the long run significantly higher. And if it’s known (obvious?) that this is how things work in case of the trades that take longer than just a couple of hours, then it’s becoming unethical for one to ignore the signs coming from the other markets. Following the above rule, we will start today’s Gold & Silver Trading Alert with a non-precious-metals chart, but the one that will likely receive the greatest impact in the following days and weeks. Naturally, other factors need to be considered as well, but not much changed with regard to them, for instance in case of gold’s link with the general stock market and thus our previous comments on them remain up-to-date.
The USDX Double Bottom
We previously wrote the following about the above chart:
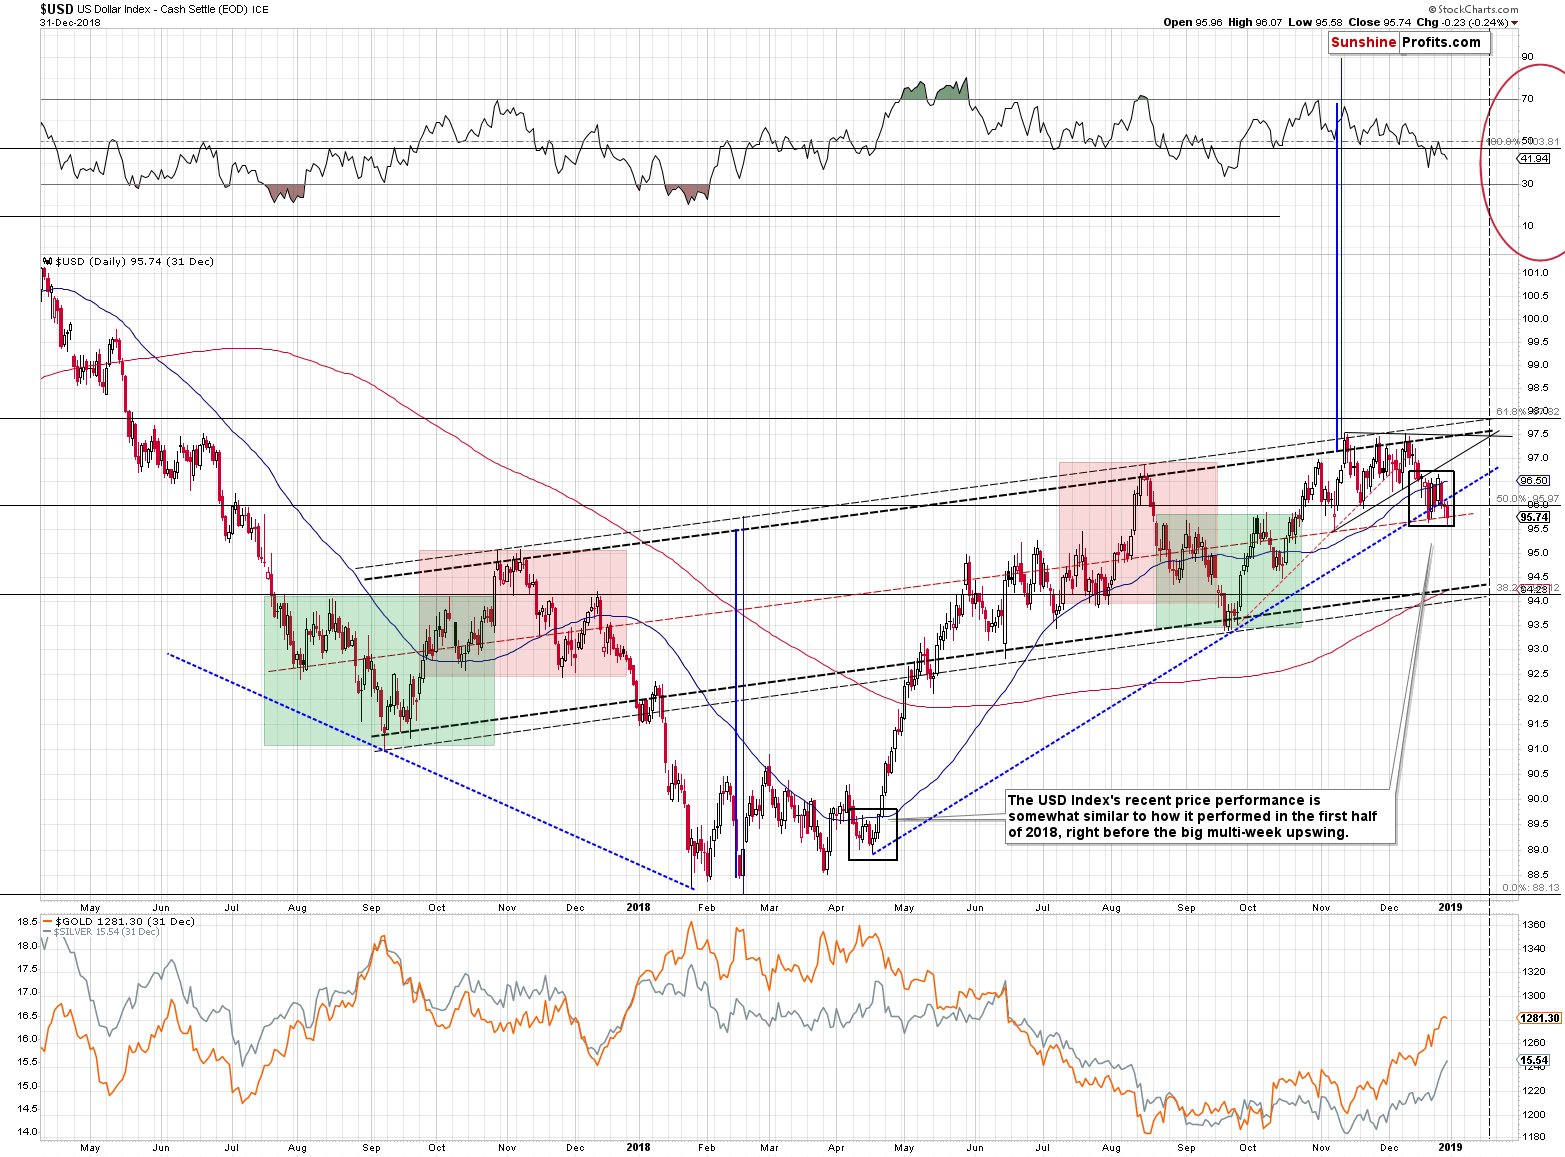
The USD Index seems to have formed a very short-term double bottom mostly below the 50-day moving average. That’s exactly what happened in April, right before the biggest upswing. The last few months of USD’s performance are similar in shape to the bottom that formed in the first half of this year and that ended in April.
There are even more similarities. Back in April we saw a new intraday high in gold, and we saw silver’s clear outperformance. We saw exactly the same thing yesterday. The history tends to repeat itself to a considerable degree and it’s likely to do so once again. In case of the USD Index, it means higher prices while in case of the precious metals, it heralds a substantial decline.
The above remains up-to-date. We are seeing another move lower in today’s pre-market trading, which appears similar to what we saw in mid-April. The final short-term bottom was slightly below the most recent bottom and this might be what we are seeing today. At the moment of writing these words today’s low is just 0.116 above the previous December low. The dollar’s bottom may already be in, and if not, it seems to be at hand.
While the gold – stock market link suggests that a big decline is just around the corner, the PM market may be looking at the USD for more immediate-term guidance. And it seems that the PMs’ decline is about to get a powerful USD-based kickstart.
The USDX’s intraday low on the last day of 2018 was 0.10 below the previous December bottom. In April, the difference between the intraday lows was 0.13. The current difference is smaller until you consider today’s pre-market low that was 0.25 lower (the USDX already reversed this decline). When taking today’s pre-market action into account, it becomes obvious that the current situation is now extremely similar to what happened in April, as we saw both: a new bottom and – based on the USD’s performance so far today – we saw a reversal from the second bottom. Plus, the shape of the USDX’s movement in the previous weeks. Plus gold’s and – in particular – silver’s reaction to these moves – silver outperformed in a clear manner just like in April.
The April bottom marked the start of a new huge upswing in the USDX and a huge downswing in the PMs. Lower prices in the USD Index were never seen since the April bottom, and higher prices in gold or silver were never seen since the April top. Yes, the June high in silver was a bit lower in intraday terms.
Speaking of the relative performance, let’s take a look at what happened during the previous session.
Gold vs. Silver vs. Gold Stocks
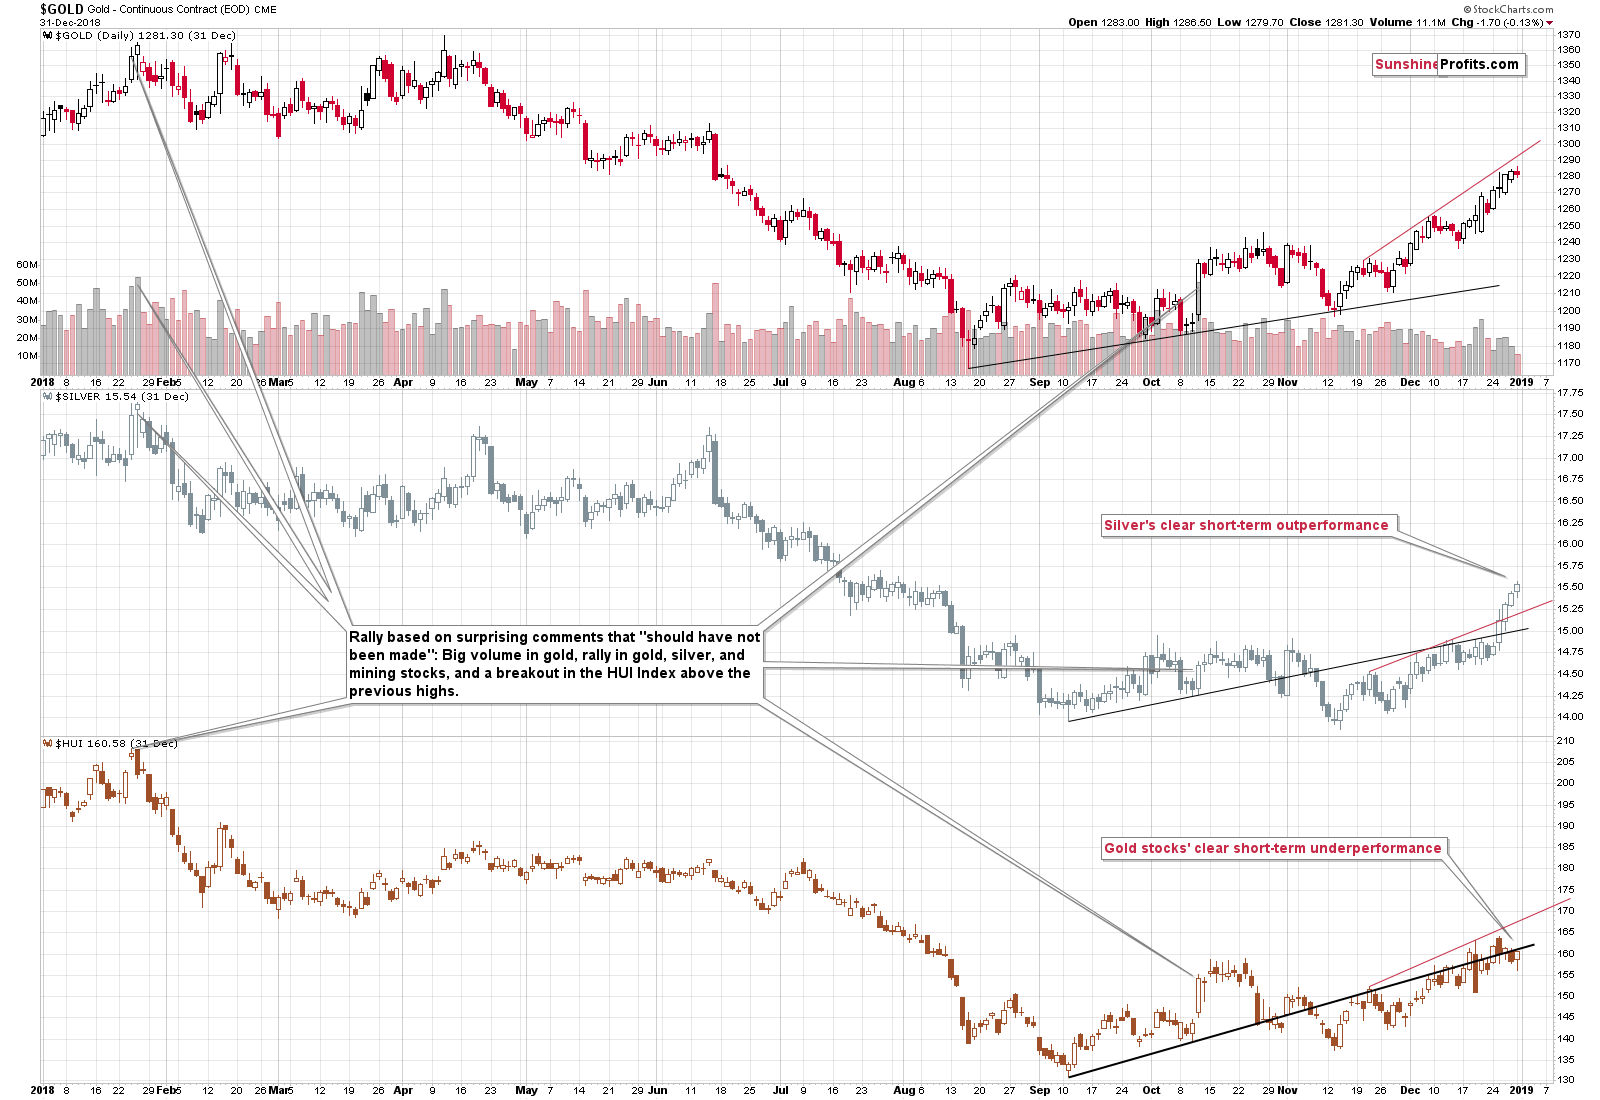
Silver outperformed once again, and while mining stocks moved higher too, their recent performance overall still shows severe underperformance of gold.
To make the above clearer we added short-term, red lines that are based on the previous highs. Silver is visibly above it, miners are visibly below it, and gold is below it, but relatively close to it. In other words, it’s visible that, on a short-term basis, silver outperforms, and miners underperform.
Interestingly, when taking a broader time frame into account and focusing on the rising black line, it’s clear that both: silver and mining stocks underperform gold. Miners’ underperform in both time frames and confirm the bearish picture. Silver’s performance, however, differs and it outperforms on a short-term basis, but underperforms on a more medium-term basis. Why and what does it mean?
Silver’s overall poor performance relative to gold represents the breakout and strength in the gold to silver ratio, which is bearish on its own as the medium-term moves in the ratio tend to be the opposite of the moves in the metals themselves. On a short-term basis, however, silver’s outperformance shows how excessive the PM investors’ sentiment gets, thus indicating tops. Consequently, even though at the first sight, silver’s performance in both perspectives may appear contradictory, they actually confirm each other’s bearish implications.
Why is the above bearish again?
Silver proved to outperform gold on a very short-term basis at the tops multiple times in the previous years, while mining stocks underperformance is one of the most stable technical signs that have been visible on the precious metals market. It simply works and history tends to repeat itself to a considerable extent. In other words, it’s a combination that in the vast majority of cases meant great shorting opportunities and thus its implications are very bearish.
CoT’s Popularity
Let’s move back to ignoring the things and this being unethical. We want to emphasize that it is the “ignoring part” that’s wrong. If one researches a given issue and determines that it’s informative value is severely overstated and thus chooses not to include it in the analysis on a regular basis, then this approach is justified.
For instance, that’s how things are with our approach to the CoT reports and their numbers. We wrote – in detail – about their usefulness for trading purposes (lack thereof), but we still get questions about these reports. One of the reasons is that their analysis seems like a hidden Holy Grail of precious metals investing and they fit the gold manipulation and silver manipulation theories so well. And we will almost certainly continue to get the questions about these reports, because many (most?) analysts don’t want to question the CoT reports’ usefulness as a trading signal and are just repeating what they read somewhere else. Some profit on doing so by selling gold and silver to those, who buy based on the manipulation theories, and so appear as more sophisticated than they are and thus attract more clients and some are just too lazy to check the facts before reporting them. We would like to believe that the latter is the case and that our colleagues are not misleading investors on purpose, but rather in good faith, not knowing that they are incorrect.
When reading about trading techniques, eventually one will stumble upon the issue of Fibonacci retracements that are ultimately based on the Phi number. Many analyses will tell you that the Phi number is ubiquitous in many patterns, for instance in the shell of nautilus. The latter is flagship example of the pattern as it’s very easy to imagine how the phi-based self-similarity works using this shell. And it’s all nice until you realize that this shell doesn’t grow in tune with the Phi number and that’s just a legend that investors started to spread, because it sounds so interesting. What about the concept that during one’s lifetime, one eats on average 6 spiders during their sleep? Or 6 spiders a year, or perhaps you heard this story with a different number. Many people heard about it. This “fun fact” is so interesting that people keep on sharing it with others even though it’s not even close to being true. The fact is that this rumor was created specifically for the purpose of measuring how fast the rumors spread.
If something is so interesting, but not based on the truth at all, then it shouldn’t be surprising to see that something that did work in the past but simply stopped working, is still viewed in light of its past glory. Even though many years have passed. That’s exactly the case with the CoT reports. It used to be a big and effective deal many years ago, but everything changed over a decade ago when the precious metals market rally ceased to be only a US phenomenon and investors from other countries jumped aboard. Of course, it was not forbidden for the latter to invest earlier, but before gold and silver broke above their previous highs in non-USD terms, it wasn’t particularly appealing. The situation is changing once again with the substantial growth of the futures market in the recent years.
We have already discussed the details several times previously, but since it’s the first Alert of this year, it may be useful to quote them here. The CoT questions are the most popular “boomerang questions” that we receive from time to time, so it will be useful to have it covered in one Alert that’s easy to recall – and the first Alert of 2019 definitely fits this description. Both sections below are from the July 25th, 2018 Gold & Silver Trading Alert.
Silver CoT – Really Important?
Before moving to mining stocks, we would like to reply to a few questions that we just received. Every now and then we are requested to comment on the CoT reports as they continue to be viewed as a very important tool in determining precious metals prices. Just as often, we explain that in our opinion, the usefulness of these reports is overestimated as there are many other indicators for PM prices that appear more useful in determining the precious metals’ direction, for instance the RSI.
A good indicator should have a trading range that’s rather stable and signals that are followed by similar action. The former is mostly missing, and the latter is not coherent.
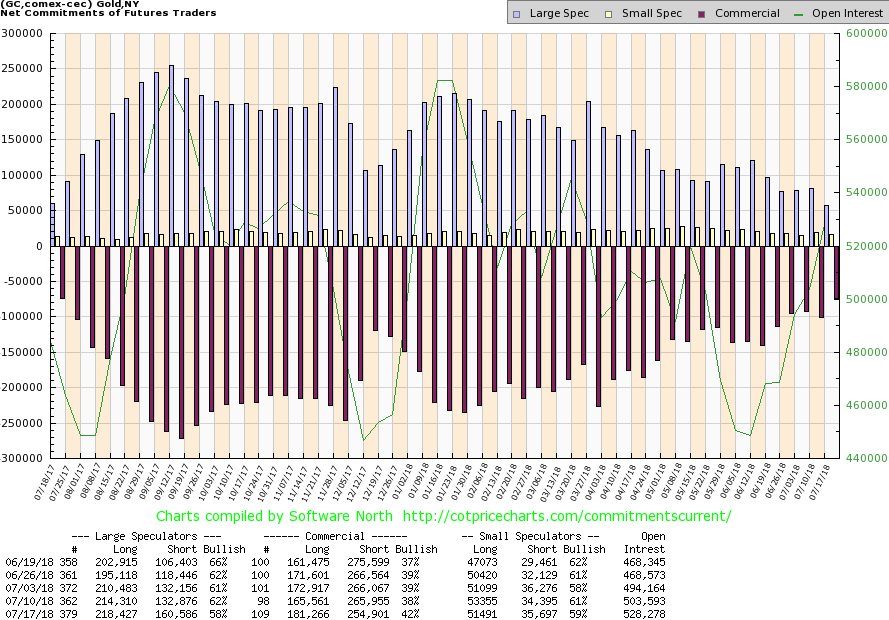
Let’s take the silver CoT as an example and let’s use Large Speculators as a proxy for the entire report’s data.
Let’s start with the big picture, so that we can determine the buy and sell zones.
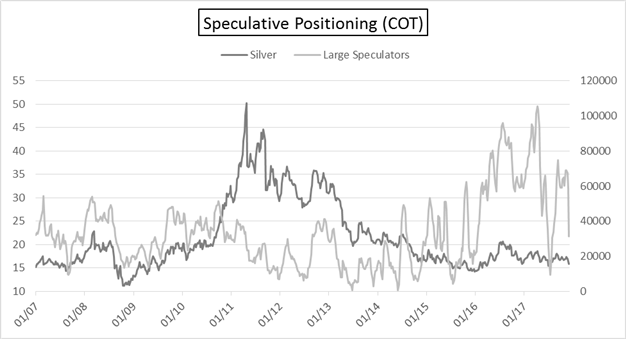
What was the buy zone? Based on the 2007 – 2012 data, one might think that it’s the level of 20,000 contracts as that was when silver’s price reversed. But no – this level didn’t’ stop silver in 2012 and in the following years. So maybe the interesting level was about 5,000 contracts as the 2012 bottoms suggested. Nope – the amount decreased below it in mid-2013 and so did the price of silver. The number finally reached about 0 in 2013. “That must have been the true bottom” – the CoT followers stated. Oops – 5 years later and silver is still well below the level that it reached in mid-2013. It was about $20, so the white metal is currently more than $2 below it.
Before continuing the above discussion of support levels for the number of large speculators’ positions… You know what else is interesting? The large speculators’ position in light of silver’s powerful rally in 2010 and 2011.
In general, if silver’s price goes up, the large speculators’ position goes up. If silver’s price goes down, the large speculators’ position goes down. When the large speculators’ position gets to/above a certain level it, becomes overbought and indicates a downswing and if it gets to/below a certain level, it becomes oversold and indicates an upswing.
Nice and simple, right? The problem is that there is no “certain level” during both up- and downswings. You already read about the difficulty regarding the overbought/support levels in the previous paragraph. The same goes for the overbought/resistance level. The 2016 and 2017 levels were well above the previous maximums and using the previous readings would have generated incorrect signals.
But that’s now that main point. The main point is that the entire link broke down during the biggest upswing of the past decade. The large speculators’ position rallied according to the general “rule” and… More or less in the middle of the upswing, it started to decline. The large speculators’ position became totally useless in predicting the final top for the rally. If that was the case during the key rally of the past decade, then should you really trust this tool when it comes to timing the details of the key decline of the decade? It seems that we are in the early stage of this kind of movement, so should one really bother with looking at the CoT numbers, which could be useful… to a point after which they could provide the opposite of useful signals? The way situation developed in 2010 and 2011 should make you really doubt the CoT numbers’ usefulness in the following months.
Naturally, the entire previous paragraph assumes that the current price regime is different from the previous months’ back-and-forth trading. If only we had seen something suggesting that this situation is different than everything else that we saw in the past 10 years.
Oh wait, we did.
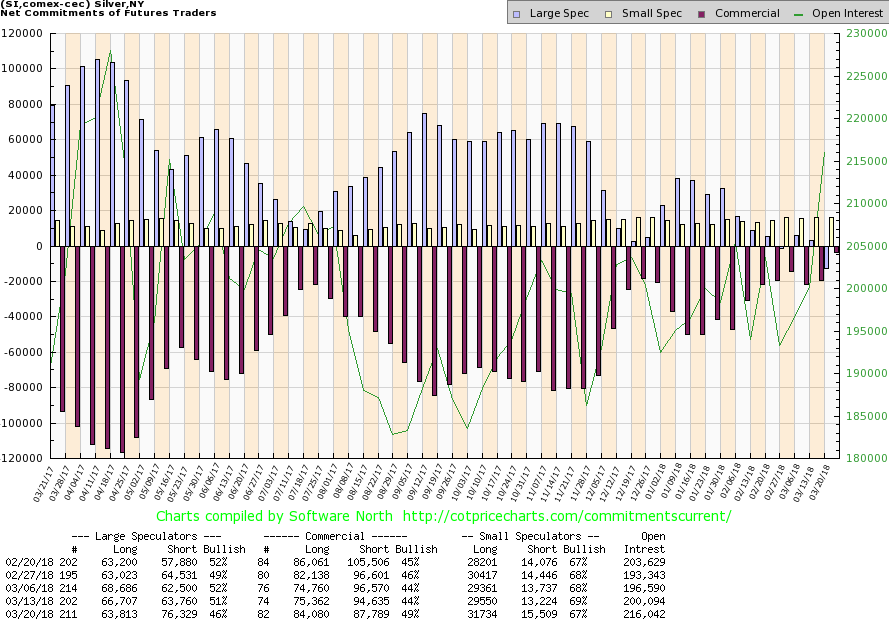
The large speculator’s position just moved below 0, which indicates a new data regime. In other words, we saw a breakdown in the number of positions of large speculators, which suggests that… Well, they will move to a new low – but nobody knows what this low would be. That’s the smaller problem, though.
The bigger problem is that if silver is starting its major – final – decline, then we might not be able to trust the CoT data at all, just like one shouldn’t have trusted it in 2010 and 2011.
Taking both factors into account makes any bullish implications of the above charts rather insignificant at this time.
By the way, did you notice how the analyses that discuss the CoT data are almost always focused on short or (in the best case) medium term? If you feature the big picture, you see how incoherent the implications are and why this tool should be used at best as something that confirms other types of analysis and not on a stand-alone basis.
To be honest, the above paragraph is not entirely correct – the CoT analyses are usually not focused on any charts at all. Long-term CoT charts (like the one that we featured for silver) would put the comments into perspective and it would be clear that they are not that meaningful.
The comments are about a given position in any part of the report that was reached, the differences between them (net position), or about the dynamics (commercials added crazy XYZ to their already huge position!) and they are often accompanied by comments on how big, small, or whatever the position is, or how remarkably fast or slow a given move in the levels of a given position is taking place. Whichever of the above is the case, it is said to be bullish. On one hand, the above may seem strange to those who are new to the precious metals market, and on the other hand, not blindly agreeing that CoT’s are bullish for gold and silver may appear outrageous to those who think that gold will move much higher in the next few years.
This way of thinking is indeed very specific, but is it still analysis? No. It’s an example of confirmation bias a.k.a. wishful thinking.
We actually do think that gold and silver will soar in the coming years, but that doesn’t mean that we’ll say that everything about these markets is bullish. Whenever something is bearish, neutral, or unclear, we’ll call it exactly that. There are tons of factors that currently support lower precious metals prices in the next few months, and we will not just ignore them – we will take advantage of the upcoming slide, make money while precious metals decline (sometimes profiting on the corrective upswings like we did in early July) and then get back in the precious metals market at much lower prices and with much bigger capital.
Why are we discussing all this? Because the positions shown in the gold CoT report are similar to what we saw in July 2017 and December 2017.
Gold’s CoT Signal
Gold bottomed and rallied in July and December 2017, so the above chart seems bullish for the next few weeks. Naturally, a rally could follow, but it’s not likely to. Both mentioned cases are taken from the time when gold was trading sideways and the odds are that this stage is over. Consequently, the CoT values are not a tool that should be currently applied.
When we wrote about the RSI several days ago we emphasized its usefulness during big rallies and during sideways trading and its uselessness in the case of medium-term declines. If you read that analysis, you probably already know what we’re going to say. If you didn’t read it – we encourage you to do so.
We compared expecting the RSI to be useful during big declines to chopping a tree using a fork. Using CoT reports during big declines may be compared to chopping a tree using a spoon. It’s not the same as the RSI, but it’s in the same ballpark and it’s just as pointless to be using it when trying to take advantage of the big downswings. This goes for both taking advantage of the downswings by betting on lower PM prices and for simply waiting for great buying opportunities.
Both mentioned cases – July 2017 and December 2017 were buying opportunities that were indicated by the RSI indicator. Last week we discussed it in detail how these signals work during upswings and during sideways trading and how they don’t work during declines. It’s the same with the CoT readings. We already quoted a sizable part of our previous analysis above, so we don’t want to put another big quote below, but combining the analysis that we did quote (about silver CoT) and our last week’s discussion of the RSI’s implications during big downswings makes it clear that the current “signal” from gold’s CoT is of very little meaning.
CoTs are very similar to the RSI in terms of usefulness (the RSI being more useful in our view) – especially during sideways trading patterns, but they will likely not be of much help during big declines. And we have one right now.
You can hate it, you can scream “gold manipulation!”, and you can ignore it. But all this won’t change that the CoT report is most likely not going to help you during big moves. It may even give you false signals leading to substantial losses and/or missed opportunities.
Finally, since the above discussion may trigger emotional responses, we think a few things should be emphasized.
Sir Isaac Newton said: Plato is my friend, Aristotle is my friend, but my greatest friend is truth. Paraphrasing the above, we can say: gold is our friend, silver is our friend, but our greatest friend is truth.
We think that both metals will move much higher in the coming years. In particular, we are not perma-bears - we were bullish (in terms of long-term investments) on precious metals for years – until April 2013.
We work for investors, not for gold/silver producers, or gold/silver sellers and our loyalty stays with the former. Therefore, we will not promote gold ownership (except as insurance) when we think that it’s going to move substantially lower and we are doing this for gold and silver investors (so that they can invest at better prices or profit from the decline), not against them. We are the precious metals investors’ true friend – the one that will tell you the harsh truth when things are bad if it’s likely to benefit you, instead of telling you sweet lies that may be pleasant to hear.
Summary
Summing up, this prolonged correction within the big downtrend has been very tiring, but based on the long-term factors being patient was very well worth it, and based on the short-term signs it seems that the waiting is over or about to be over. The outlook for the precious metals market remains very bearish for the following weeks and months and short position remains justified from the risk to reward point of view, even if we see a few extra days of back and forth trading or even a small brief upswing. There is a very high probability of a huge downswing that makes the short position justified, not the outlook for the next few days. It's confirmed by multiple factors, i.a. silver’s extreme outperformance and miners’ underperformance, gold’s performance link with the general stock market, gold getting Cramerized, and the bullish outlook for the USD Index.
As always, we’ll keep you – our subscribers – informed.
To summarize:
Trading capital (supplementary part of the portfolio; our opinion): Full short positions (250% of the full position) in gold, silver and mining stocks are justified from the risk/reward perspective with the following stop-loss orders and exit profit-take price levels:
- Gold: profit-take exit price: $1,062; stop-loss: $1,303; initial target price for the DGLD ETN: $82.96; stop-loss for the DGLD ETN $45.87
- Silver: profit-take exit price: $12.32; stop-loss: $15.73; initial target price for the DSLV ETN: $47.67; stop-loss for the DSLV ETN $27.48
- Mining stocks (price levels for the GDX ETF): profit-take exit price: $13.12; stop-loss: $21.82; initial target price for the DUST ETF: $80.97; stop-loss for the DUST ETF $21.97
Note: the above is a specific preparation for a possible sudden price drop, it does not reflect the most likely outcome. You will find a more detailed explanation in our August 1 Alert. In case one wants to bet on junior mining stocks’ prices (we do not suggest doing so – we think senior mining stocks are more predictable in the case of short-term trades – if one wants to do it anyway, we provide the details), here are the stop-loss details and target prices:
- GDXJ ETF: profit-take exit price: $17.52; stop-loss: $31.23
- JDST ETF: initial target price: $154.97 stop-loss: $51.78
Long-term capital (core part of the portfolio; our opinion): No positions (in other words: cash)
Insurance capital (core part of the portfolio; our opinion): Full position
Important Details for New Subscribers
Whether you already subscribed or not, we encourage you to find out how to make the most of our alerts and read our replies to the most common alert-and-gold-trading-related-questions.
Please note that the in the trading section we describe the situation for the day that the alert is posted. In other words, it we are writing about a speculative position, it means that it is up-to-date on the day it was posted. We are also featuring the initial target prices, so that you can decide whether keeping a position on a given day is something that is in tune with your approach (some moves are too small for medium-term traders and some might appear too big for day-traders).
Plus, you might want to read why our stop-loss orders are usually relatively far from the current price.
Please note that a full position doesn’t mean using all of the capital for a given trade. You will find details on our thoughts on gold portfolio structuring in the Key Insights section on our website.
As a reminder – “initial target price” means exactly that – an “initial” one, it’s not a price level at which we suggest closing positions. If this becomes the case (like it did in the previous trade) we will refer to these levels as levels of exit orders (exactly as we’ve done previously). Stop-loss levels, however, are naturally not “initial”, but something that, in our opinion, might be entered as an order.
Since it is impossible to synchronize target prices and stop-loss levels for all the ETFs and ETNs with the main markets that we provide these levels for (gold, silver and mining stocks – the GDX ETF), the stop-loss levels and target prices for other ETNs and ETF (among other: UGLD, DGLD, USLV, DSLV, NUGT, DUST, JNUG, JDST) are provided as supplementary, and not as “final”. This means that if a stop-loss or a target level is reached for any of the “additional instruments” (DGLD for instance), but not for the “main instrument” (gold in this case), we will view positions in both gold and DGLD as still open and the stop-loss for DGLD would have to be moved lower. On the other hand, if gold moves to a stop-loss level but DGLD doesn’t, then we will view both positions (in gold and DGLD) as closed. In other words, since it’s not possible to be 100% certain that each related instrument moves to a given level when the underlying instrument does, we can’t provide levels that would be binding. The levels that we do provide are our best estimate of the levels that will correspond to the levels in the underlying assets, but it will be the underlying assets that one will need to focus on regarding the signs pointing to closing a given position or keeping it open. We might adjust the levels in the “additional instruments” without adjusting the levels in the “main instruments”, which will simply mean that we have improved our estimation of these levels, not that we changed our outlook on the markets. We are already working on a tool that would update these levels on a daily basis for the most popular ETFs, ETNs and individual mining stocks.
Our preferred ways to invest in and to trade gold along with the reasoning can be found in the how to buy gold section. Additionally, our preferred ETFs and ETNs can be found in our Gold & Silver ETF Ranking.
As a reminder, Gold & Silver Trading Alerts are posted before or on each trading day (we usually post them before the opening bell, but we don't promise doing that each day). If there's anything urgent, we will send you an additional small alert before posting the main one.
=====
Thank you.
Sincerely,
Przemyslaw Radomski, CFA
Editor-in-chief, Gold & Silver Fund Manager
Gold & Silver Trading Alerts
Forex Trading Alerts
Oil Investment Updates
Oil Trading Alerts

