

Briefly: in our opinion, full (250% of the regular size of the position) speculative short positions in gold, silver and mining stocks are justified from the risk/reward perspective at the moment of publishing this Alert. We are moving the stop-loss order for silver $0.10 higher.
Gold and silver ended last week at new highs. But mining stocks didn’t just rally less. The GDX ETF declined by almost 2%. It also formed a weekly reversal for the third week in a row. Since miners are the only part of the PM sector that’s not rallying, gold and silver investors can relax assuming that these metals will continue to rally nonetheless, right? Very wrong.
Let’s start today’s analysis with the most important development that took place on Friday – mining stocks extreme underperformance.
Miners’ Underperformance
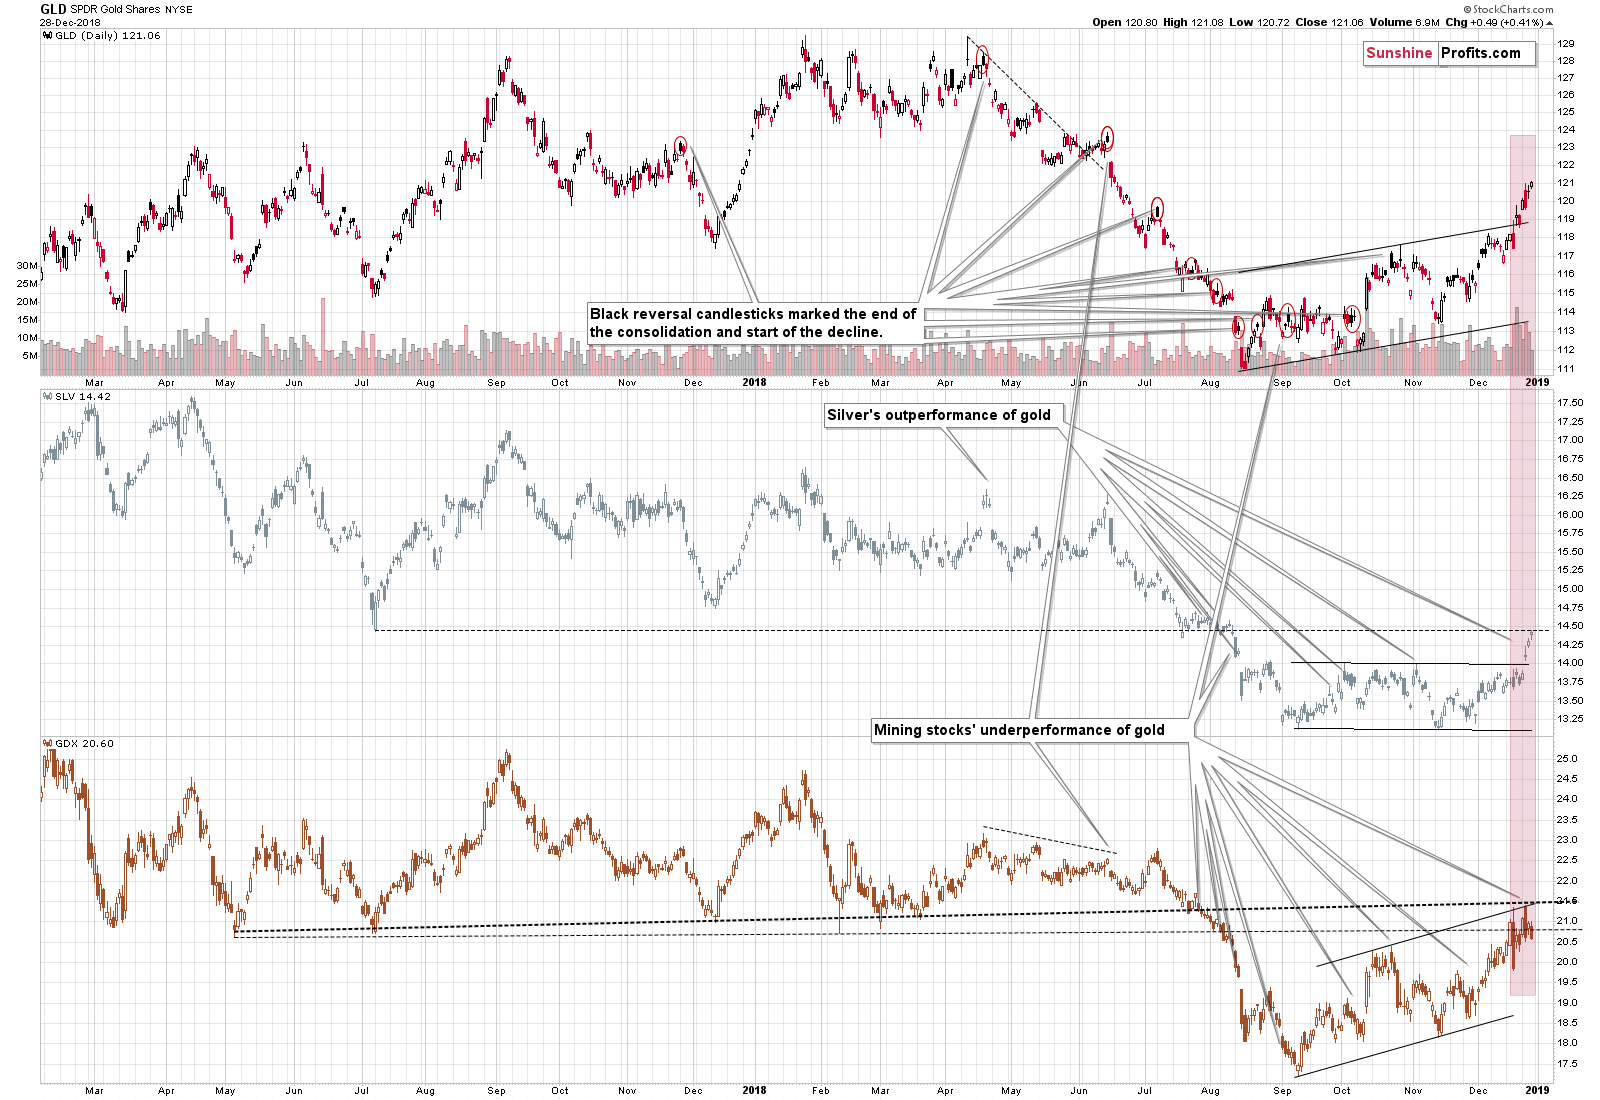
It is usually the case that miners either rally less than gold or decline more than gold and it’s debatable whether one part of the PM sector really underperformed the other. But not on Friday. On Friday, we saw a move higher in gold and silver and we saw a clearly visible move lower in the mining stocks. The latter took place in the GDX ETF, HUI Index, XAU Index, and even in the SIL ETF (to a smaller extent, but still). Since the major proxies for the sector showed the same thing, it seems that it was a true move and it really represented investors’ views.
The mining stocks underperformance is very clear, but to make it even clearer we marked the recent past, when the GDX ETF moved lower, but GLD and SLV moved higher. Gold and silver were making new highs, but – overall, and despite small attempts – mining stocks were not.
This is a very bearish sign for the following weeks, especially that silver reached its major resistance – the July 2017 bottom. It’s not visible on the above chart (GLD underperformed gold in a more visible way due to the ETF fees), but gold moved to its May bottom, which was the last pause before the decline. Since now gold and silver reached their previous bottoms and verified them as resistance, and since mining stocks had already done so previously, it seems that the medium-term decline can now continue.
Let’s take a look at miners’ performance from the more long-term point of view.
The Weekly Reversals
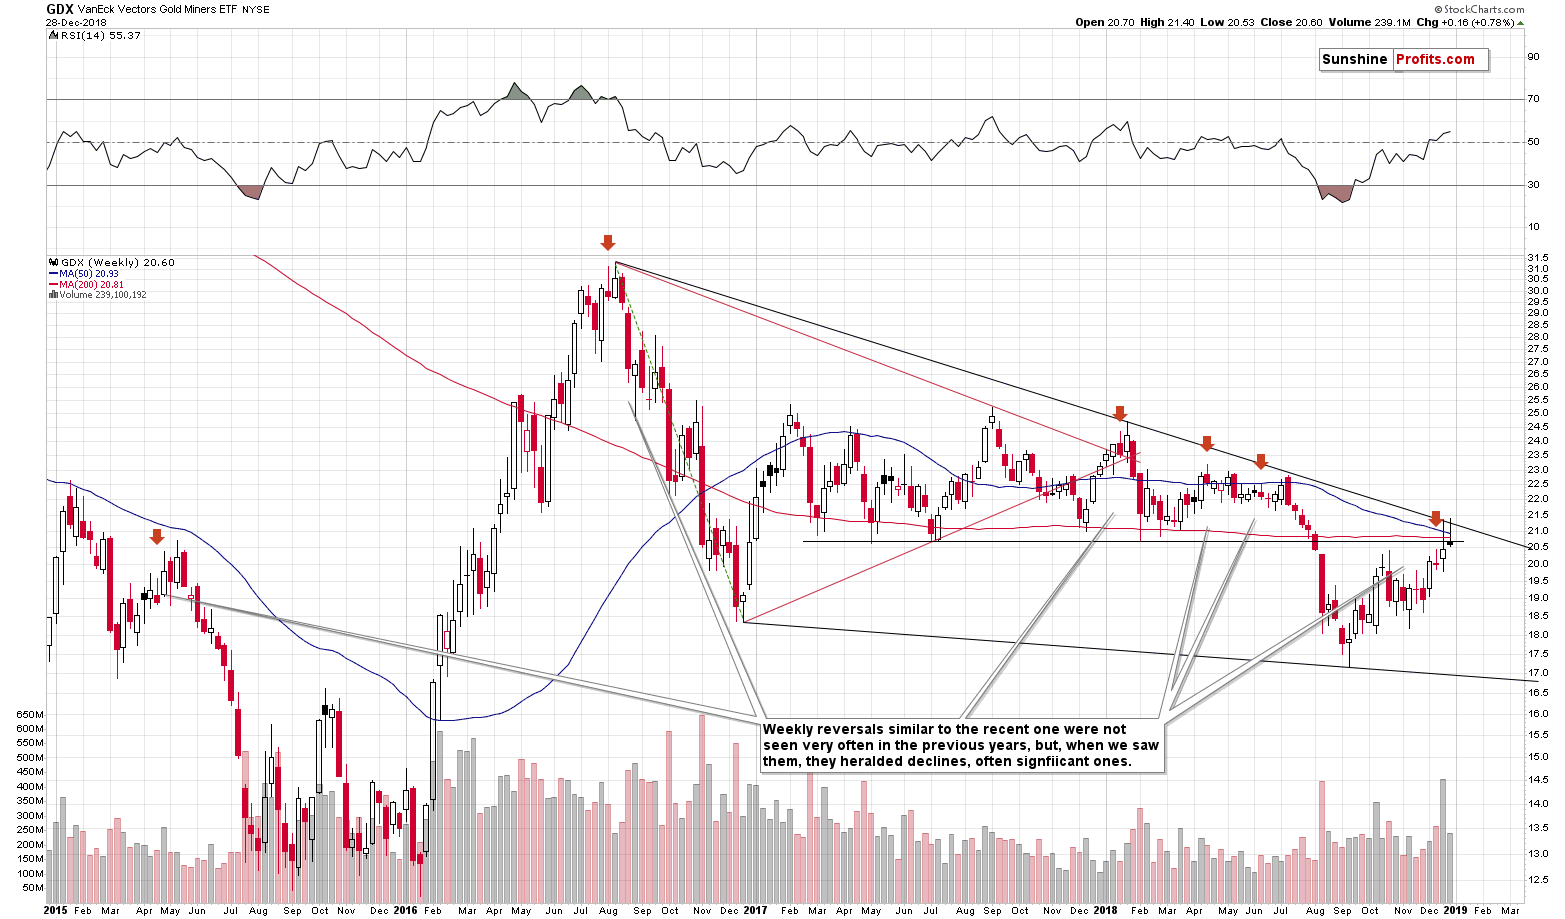
The miners moved to two critical resistance levels. One is provided by the previous (2017 and 2018) lows and the second is the declining resistance line that’s based on the 2016 and 2018 highs. They were both reached: the former in terms of the closing prices and the latter in intraday terms. This – by itself – suggests a reversal, but we also have three weekly confirmations in the form of weekly reversals. In each of the last 3 weeks, miners tried to move higher and each time they were pushed back lower.
On the above chart we marked the situations, in which gold miners reversed in a way that’s similar to what happened in mid-December. All 5 cases were good shorting opportunities, but they were not necessarily the perfect ones. In most cases miners moved a bit higher and declined only after this small move higher. The important thing is that the following decline was many times bigger than the preceding upswing.
What happened after the above-mentioned mid-December reversal? Miners moved a bit higher, repeating the reversal two more times. Did they move higher just like they did in similar cases? Check. Did they move higher by forming two weekly reversals – in the most bearish imaginable way? Double check. Does the miners’ clear underperformance prove that the current situation is not like it was in 2016? Triple check. The implications are very bearish.
In the previous Alerts, we wrote quite a lot about the link between stocks and gold (it’s currently strongly negative and since stocks appear to be bottoming, gold is likely topping) and since the former seems to have just bottomed (that’s what we’ve been expecting to see based i.a. on the extreme oversold situation in the DIA-based RSI indicator), it appears to be a good idea to provide a quick update on it. Let’s start by quoting our previous thoughts on that matter.
Gold – Stocks Link
(…) sometimes gold moves in tune with stocks and sometimes they move in the opposite directions. Let’s consider two ways, in which we can describe this link: direction and strength.
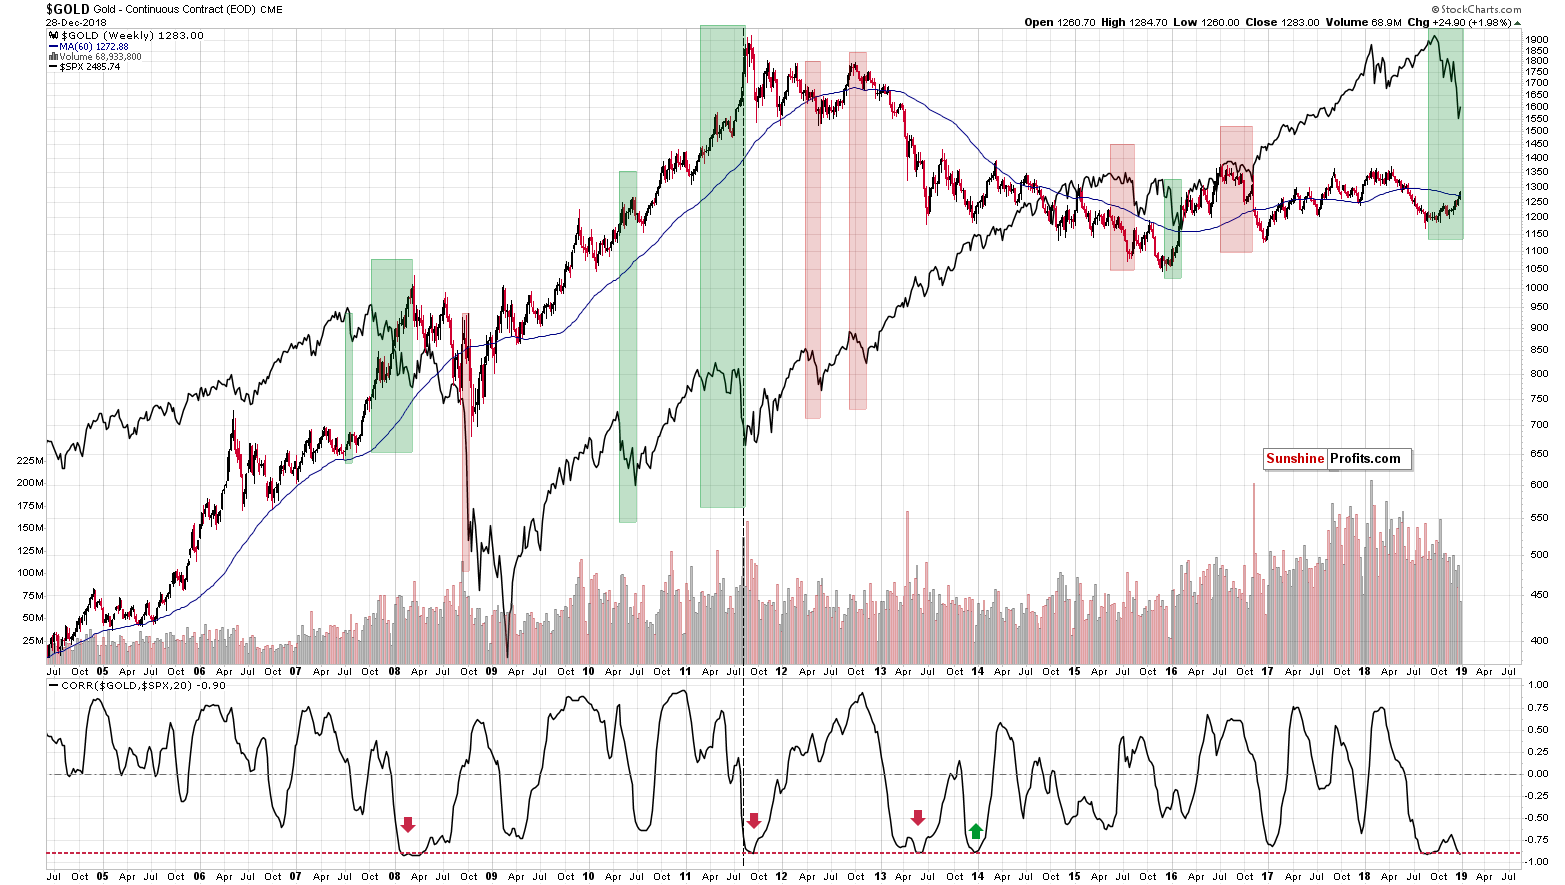
The directions changes, as we discussed previously, and the above chart shows how gold reacted to stocks’ sizable declines. The green rectangles are cases when gold rallied along with lower stocks, and the red rectangles are cases when gold declined along with lowers stocks.
There are only three previous cases when the stocks dropped significantly in terms of both: price and time. That was in 2008, 2011, and in late 2015 – early 2016. The first two cases were followed by gold’s biggest and sharpest declines and the last case was followed by a sizable counter-trend rally in gold. With only three similar cases, the link seems somewhat bearish, but close to being neutral. However, this changes when we consider that the strength factor and all the reasons due to which the current situation is not like 2016 that we discussed in the last few Alerts.
The red, dashed line on the bottom of the above chart emphasizes the situations that are similar to the current one in terms of strength of the link. When the correlation becomes so strongly negative that it reaches the red line, something major usually happens.
We saw that four times in the previous years: in 2008, 2011, in 2013 (before the decline), and in late-2013 – early-2014 (at the bottom). The first three cases were followed by major declines and only the last case was followed by (counter-trend, but still) a rally. The 3 out of 4 efficiency has bearish implications on its own, but the truly important and remarkable thing becomes visible when we combine both aspects.
When did we see gold rallying along with declining stocks, when the link between them was as strongly negative as it is now? In only two cases: in 2008 and in 2011. These were the most important tops in gold in the past 20 years or so. Even though gold didn’t move much higher in the past weeks, the situation – with regard to stocks – seems just as extreme as it was in both of them. The implications are beyond-words bearish for the following months and weeks.
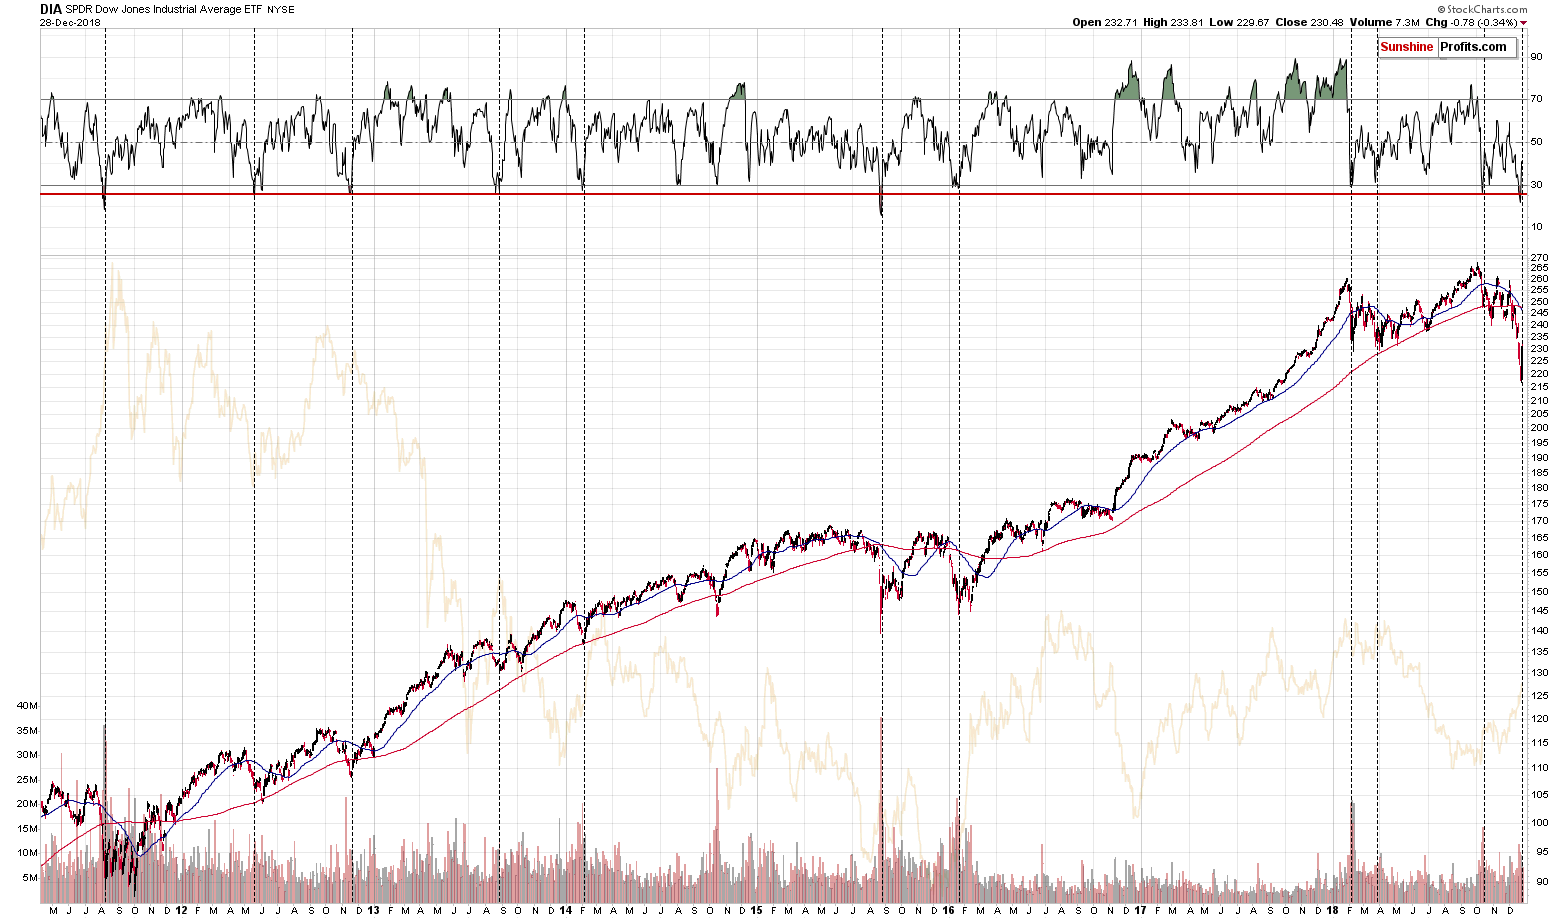
In general, the bottom in stocks corresponded to the top in gold, but not in 100% precise manner. DIA bottomed on August 9th, 2011, the RSI based on it moved above 40 (like what we see today) on August 15th, 2011 and gold topped (the initial top) on August 23rd. The exact day count is not important because the size of the preceding rally in gold and the stage of the bull market in it were very different from what we have now, and thus it’s normal that it took longer for the rally to burn itself out in 2011 than it’s likely to take right now. The relative approach should be much more useful. If it took about a week after the stock bottom in 2011 for the RSI to move above 40 and then another week for gold to top, then if it took just one day between the bottom in the DIA and the RSI above 40, then perhaps it will take just another day for gold to reach its top. This would imply a topping action today.
The above prediction is not the point of this analysis, though. The point is that the exact bottom in stocks doesn’t have to correspond to the exact top in gold, and thus that just because gold didn’t drop immediately after stocks’ bottom does not invalidate the above negative link and its critical – and bearish – implications.
The stocks declined a bit on Friday, but the move appeared to be more of a pause then another wave lower, and precious metals’ reaction was rather mixed – metals moved higher, but miners moved lower. This is rather normal in both ways: stocks don’t have to rally on each day after the bottom, and PMs’ lack of immediate decline is not surprising given what we wrote in the previous paragraphs. The implications remain bearish as the lack of immediate action doesn’t invalidate them.
There’s also one additional important factor that needs to be considered – the USD Index.
USD’s Bottoming Pattern
In short, our previous comments remain up-to-date:
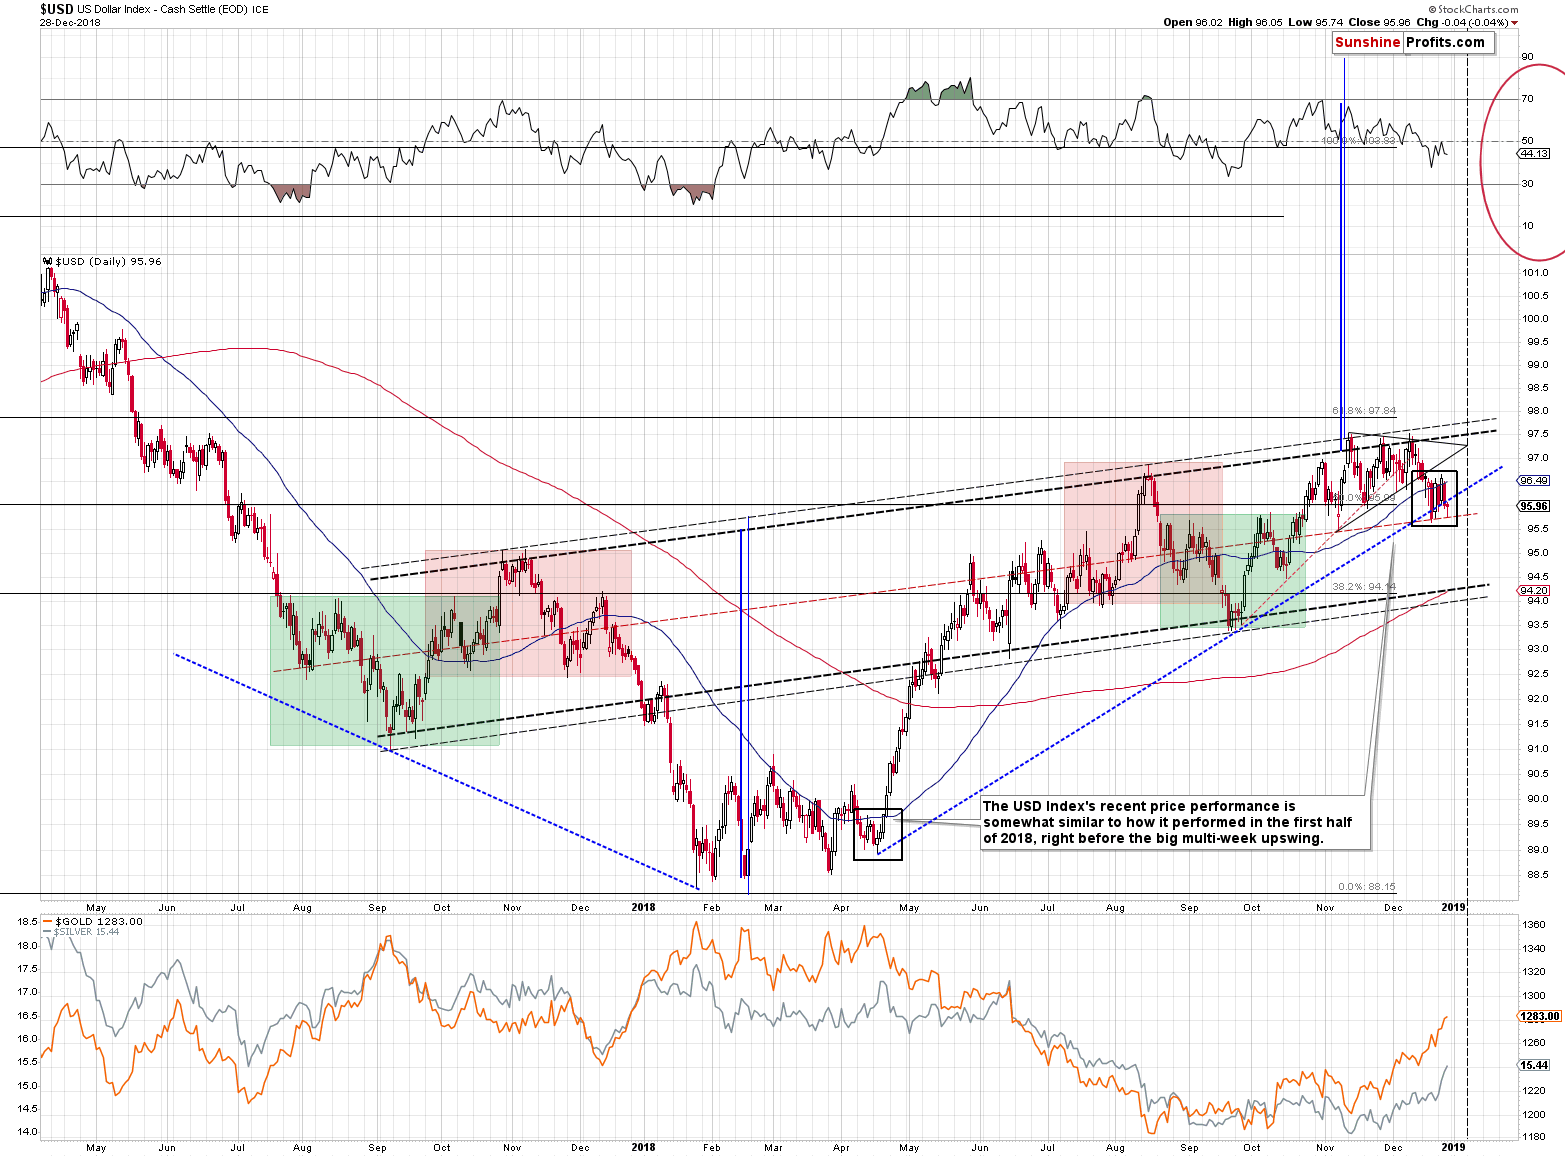
The USD Index seems to have formed a very short-term double bottom mostly below the 50-day moving average. That’s exactly what happened in April, right before the biggest upswing. The last few months of USD’s performance are similar in shape to the bottom that formed in the first half of this year and that ended in April.
There are even more similarities. Back in April we saw a new intraday high in gold, and we saw silver’s clear outperformance. We saw exactly the same thing yesterday. The history tends to repeat itself to a considerable degree and it’s likely to do so once again. In case of the USD Index, it means higher prices while in case of the precious metals, it heralds a substantial decline.
The above remains up-to-date. We are seeing another move lower in today’s pre-market trading, which appears similar to what we saw in mid-April. The final short-term bottom was slightly below the most recent bottom and this might be what we are seeing today. At the moment of writing these words today’s low is just 0.116 above the previous December low. The dollar’s bottom may already be in, and if not, it seems to be at hand.
While the gold – stock market link suggests that a big decline is just around the corner, the PM market may be looking at the USD for more immediate-term guidance. And it seems that the PMs’ decline is about to get a powerful USD-based kickstart.
The USDX’s intraday low on Friday was just 0.02 above the previous December bottom, and it took form of a daily reversal. The situation is now even more similar to what happened in mid-April right before the USD rallied.
Before summarizing we would like to discuss the situation in the gold to silver ratio and in gold’s price in terms of the euro.
Gold to Silver Ratio
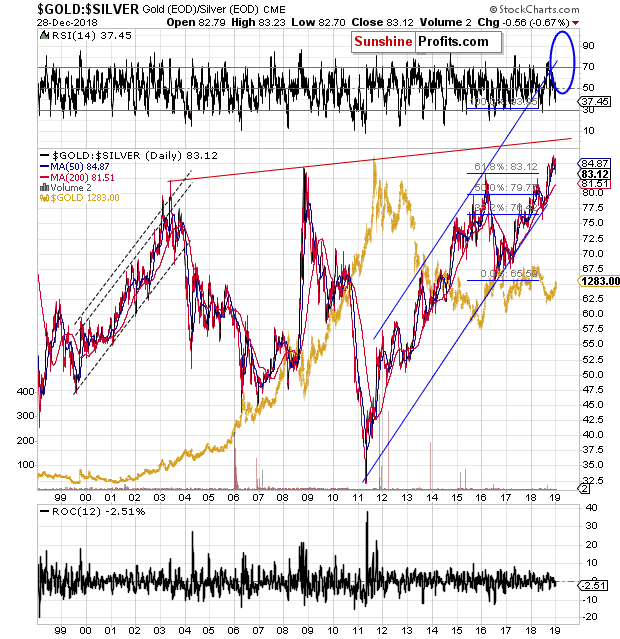
Due to silver’s quick outperformance, the gold to silver ratio moved lower, but it’s important to note that it just came back to its 2016 bottom, which seems to be a verification of the breakout. The trend still remains up and the very short-term action doesn’t change it.
The Upcoming Change in Gold’s Performance
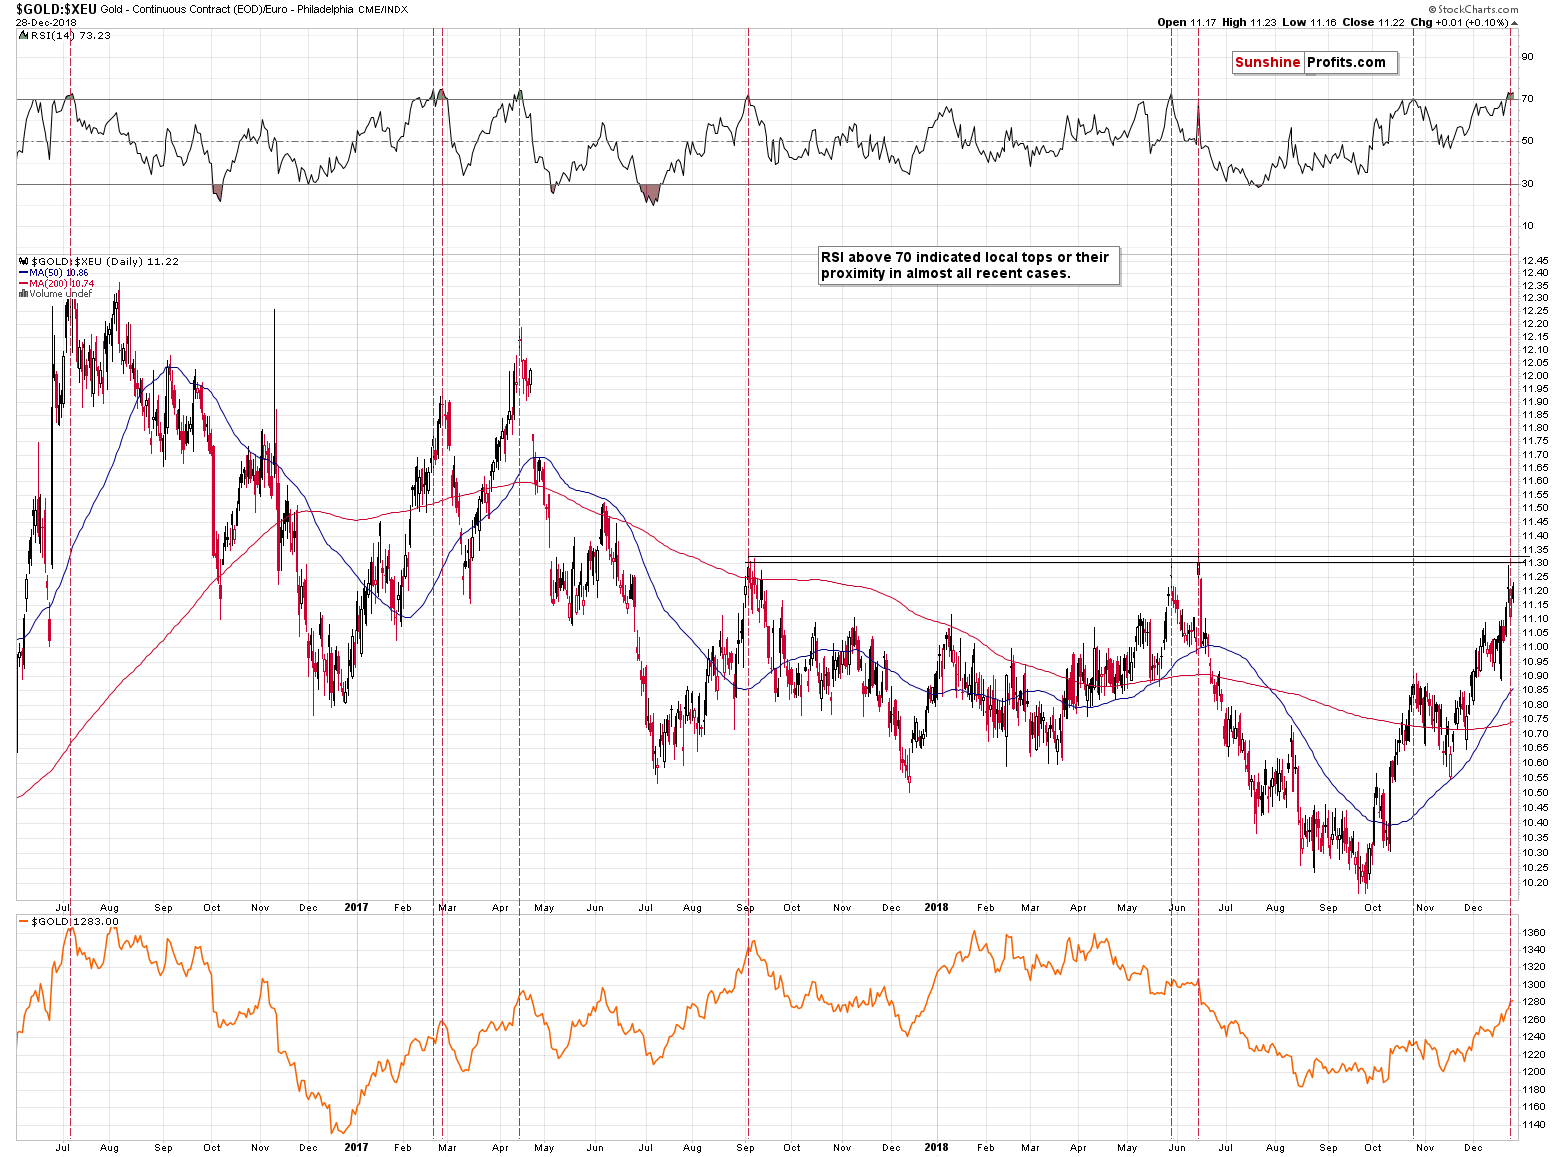
As far as gold’s performance in terms of the euro is concerned, we saw a rally that’s quite sizable and simply too sharp to be sustainable. The price moved very close to its 2018 and mid-2017 tops and then reversed. The RSI Indicator is above 70 and in almost all previously cases in the past few years, this meant an excellent shorting opportunity.
This is important not only on its own. It’s important also because it means that gold is likely to magnify USD’s bearish signals. In the recent weeks, gold moved more than the USD declined. But now this is likely to reverse. Gold is likely to move lower more than the USD Index moves higher. This, plus the fact that the USD Index is very likely to rally, create a powerful bearish set-up for the yellow metal.
Summary
Summing up, this prolonged correction within the big downtrend has been very tiring, but based on the long-term factors being patient was very well worth it, and based on the short-term signs it seems that the waiting is over or about to be over. The outlook for the precious metals market remains very bearish for the following weeks and months and short position remains justified from the risk to reward point of view, even if we see a few extra days of back and forth trading or even a small brief upswing. There is a very high probability of a huge downswing that makes the short position justified, not the outlook for the next few days. It's confirmed by multiple factors, i.a. gold’s reversal, silver’s extreme outperformance and miners’ underperformance, gold’s performance link with the general stock market, gold getting Cramerized, and the bullish outlook for the USD Index.
We are moving the stop-loss level for silver 10 cents higher just in case it continues to outperform right before taking a dive.
On an administrative note, there will be no trading tomorrow and thus there will be no Alerts. The next issue is going to be posted normally on Wednesday.
As always, we’ll keep you – our subscribers – informed.
On behalf of all Sunshine Profits’ employees and myself, I would like to wish you all the best in the New Year.
To summarize:
Trading capital (supplementary part of the portfolio; our opinion): Full short positions (250% of the full position) in gold, silver and mining stocks are justified from the risk/reward perspective with the following stop-loss orders and exit profit-take price levels:
- Gold: profit-take exit price: $1,062; stop-loss: $1,303; initial target price for the DGLD ETN: $82.96; stop-loss for the DGLD ETN $45.87
- Silver: profit-take exit price: $12.32; stop-loss: $15.73; initial target price for the DSLV ETN: $47.67; stop-loss for the DSLV ETN $27.48
- Mining stocks (price levels for the GDX ETF): profit-take exit price: $13.12; stop-loss: $21.82; initial target price for the DUST ETF: $80.97; stop-loss for the DUST ETF $21.97
Note: the above is a specific preparation for a possible sudden price drop, it does not reflect the most likely outcome. You will find a more detailed explanation in our August 1 Alert. In case one wants to bet on junior mining stocks’ prices (we do not suggest doing so – we think senior mining stocks are more predictable in the case of short-term trades – if one wants to do it anyway, we provide the details), here are the stop-loss details and target prices:
- GDXJ ETF: profit-take exit price: $17.52; stop-loss: $31.23
- JDST ETF: initial target price: $154.97 stop-loss: $51.78
Long-term capital (core part of the portfolio; our opinion): No positions (in other words: cash)
Insurance capital (core part of the portfolio; our opinion): Full position
Important Details for New Subscribers
Whether you already subscribed or not, we encourage you to find out how to make the most of our alerts and read our replies to the most common alert-and-gold-trading-related-questions.
Please note that the in the trading section we describe the situation for the day that the alert is posted. In other words, it we are writing about a speculative position, it means that it is up-to-date on the day it was posted. We are also featuring the initial target prices, so that you can decide whether keeping a position on a given day is something that is in tune with your approach (some moves are too small for medium-term traders and some might appear too big for day-traders).
Plus, you might want to read why our stop-loss orders are usually relatively far from the current price.
Please note that a full position doesn’t mean using all of the capital for a given trade. You will find details on our thoughts on gold portfolio structuring in the Key Insights section on our website.
As a reminder – “initial target price” means exactly that – an “initial” one, it’s not a price level at which we suggest closing positions. If this becomes the case (like it did in the previous trade) we will refer to these levels as levels of exit orders (exactly as we’ve done previously). Stop-loss levels, however, are naturally not “initial”, but something that, in our opinion, might be entered as an order.
Since it is impossible to synchronize target prices and stop-loss levels for all the ETFs and ETNs with the main markets that we provide these levels for (gold, silver and mining stocks – the GDX ETF), the stop-loss levels and target prices for other ETNs and ETF (among other: UGLD, DGLD, USLV, DSLV, NUGT, DUST, JNUG, JDST) are provided as supplementary, and not as “final”. This means that if a stop-loss or a target level is reached for any of the “additional instruments” (DGLD for instance), but not for the “main instrument” (gold in this case), we will view positions in both gold and DGLD as still open and the stop-loss for DGLD would have to be moved lower. On the other hand, if gold moves to a stop-loss level but DGLD doesn’t, then we will view both positions (in gold and DGLD) as closed. In other words, since it’s not possible to be 100% certain that each related instrument moves to a given level when the underlying instrument does, we can’t provide levels that would be binding. The levels that we do provide are our best estimate of the levels that will correspond to the levels in the underlying assets, but it will be the underlying assets that one will need to focus on regarding the signs pointing to closing a given position or keeping it open. We might adjust the levels in the “additional instruments” without adjusting the levels in the “main instruments”, which will simply mean that we have improved our estimation of these levels, not that we changed our outlook on the markets. We are already working on a tool that would update these levels on a daily basis for the most popular ETFs, ETNs and individual mining stocks.
Our preferred ways to invest in and to trade gold along with the reasoning can be found in the how to buy gold section. Additionally, our preferred ETFs and ETNs can be found in our Gold & Silver ETF Ranking.
As a reminder, Gold & Silver Trading Alerts are posted before or on each trading day (we usually post them before the opening bell, but we don't promise doing that each day). If there's anything urgent, we will send you an additional small alert before posting the main one.
=====
Thank you.
Sincerely,
Przemyslaw Radomski, CFA
Editor-in-chief, Gold & Silver Fund Manager
Gold & Silver Trading Alerts
Forex Trading Alerts
Oil Investment Updates
Oil Trading Alerts

