

Briefly: in our opinion, full (300% of the regular position size) speculative short positions in mining stocks are justified from the risk/reward point of view at the moment of publishing this Alert.
Just when everyone and their brother thought that silver was going straight to the moon… it plunged. And that’s not the end of the decline.
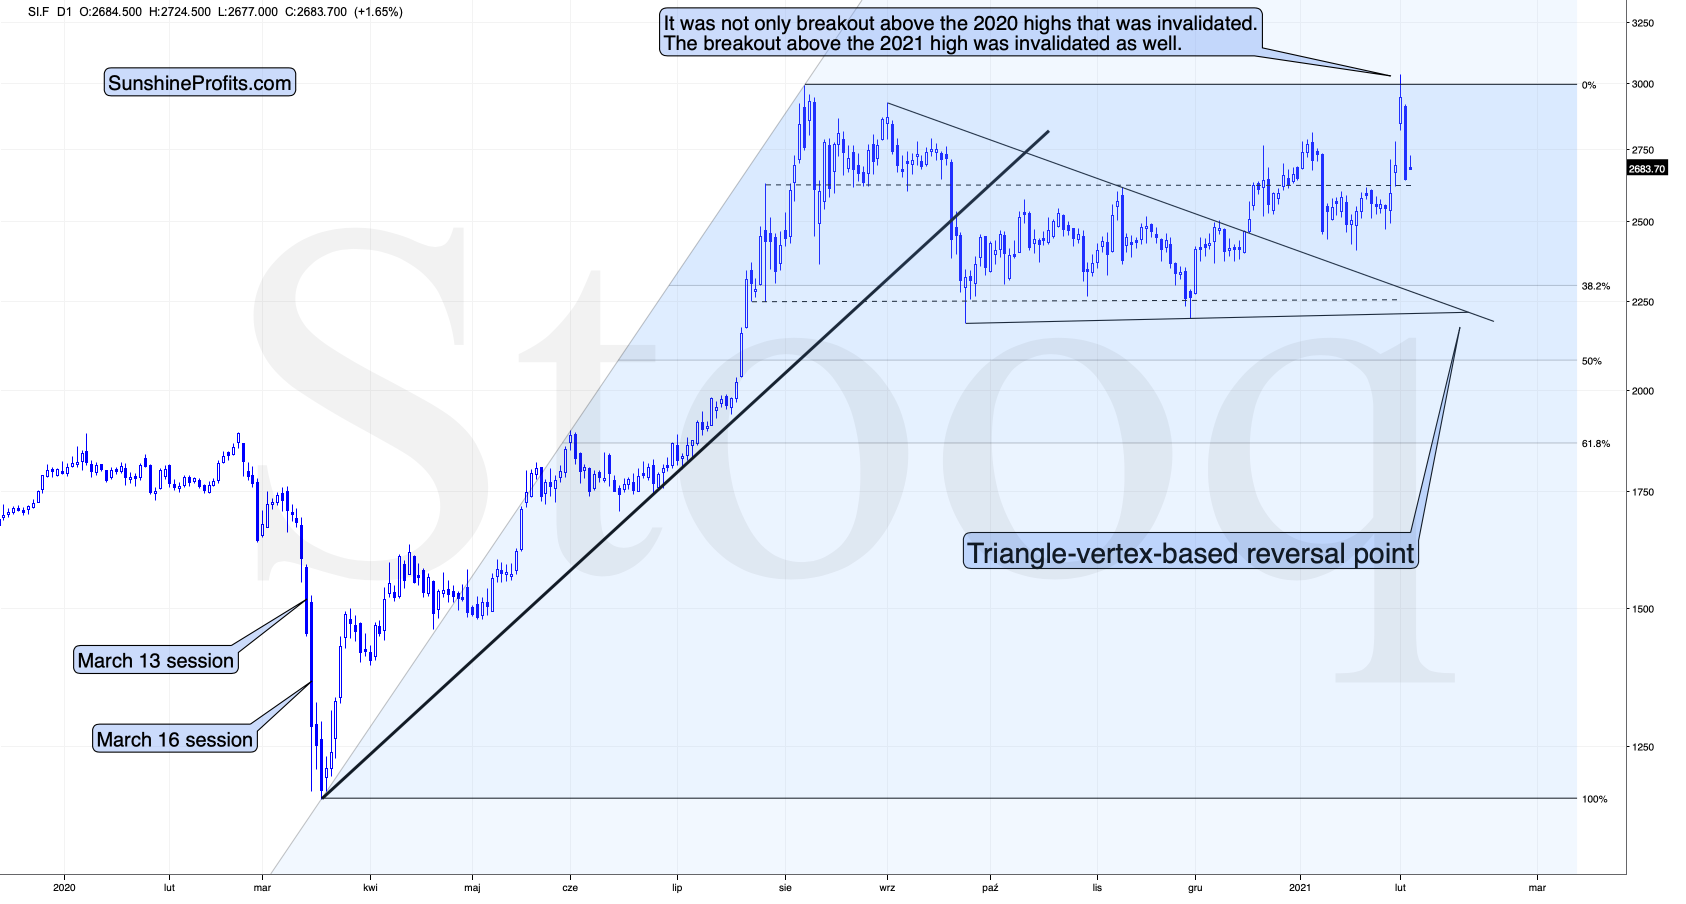
Figure 1 – COMEX Silver Futures
I previously emphasized that silver’s volatile upswing is likely just temporary, and I discussed the Kondratiev cycle which implies much higher gold prices but not necessarily right away, because the value of cash (USD) would be likely to soar as well. The latter would likely trigger a temporary slide in gold – and silver.
Well, was silver’s rally just temporary?
This seems to have been the case. The white metal declined back below not only the 2020 highs, but also back below this year’s early high. Please remember that invalidations of breakouts have immediately bearish implications and we just saw more than one in case of silver.
So far today (Feb. 3), silver is quiet, but let’s keep in mind that back in September, it took only a few sessions for the white precious metal to move from approximately the current price levels to about $22.
Will silver slide as much shortly? This is quite likely, although the downswing doesn’t have to be as quick as it was in September.
Terms like the silver shortage, the size of the silver market and silver manipulation became incredibly popular in the last couple of days, which - together with huge SLV volume, and this ETF’s inflows - confirms the dramatic increase in interest in this particular market. This is exactly what happens close to market tops: silver steals the spotlight while mining stocks are weak. I’ve seen this countless times, and in most cases, it was accompanied by multiple voices of people “feeling” that the silver market is about to explode. For example, please consider what happened in early September 2020 on both (above and below) charts. Silver jumped and almost reached its August 2020 high, while the GDX was unable to rally even to (let alone above) its mid-August high.
Don’t get me wrong, I think that silver will soar in the following years and I’m not shorting silver (nor am I suggesting this) right now and in fact I haven’t been on the short side of the silver market for months. In fact, I expect silver to outperform gold in the final part of the next massive upswing, but… I don’t think this massive upswing has started yet.
Gold had it’s nice post-Covid panic run-up, but it didn’t manage to hold its breakout above the 2011 highs, despite multiple dovish pledges from the Fed, the open-ended QE, and ridiculously low interest rates. Plus, while gold moved above its 2011 highs, gold stocks have barely corrected half of their decline from their 2011 highs. Compare that to when the true bull market started about two decades ago – gold miners were soaring and multiplying gold’s gains in the medium run.
Let’s take a look at mining stocks, using the GDX ETF as a proxy for them.
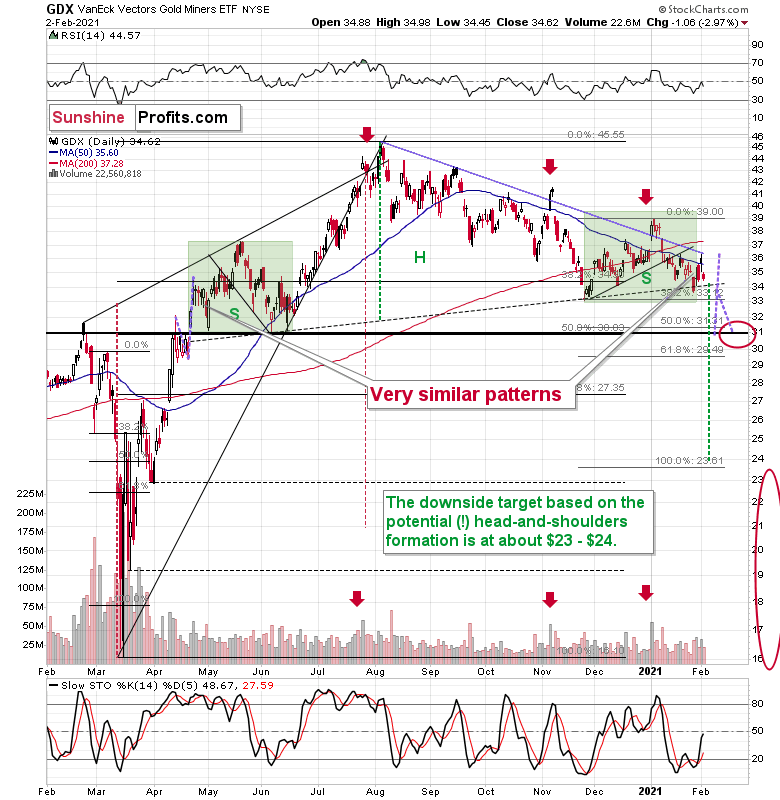
Figure 2 – VanEck Vectors Gold Miners ETF (GDX)
Are miners weak right now? Of course, they are weak. It was not only silver that got attention recently, but also silver stocks. The GDX ETF is mostly based on gold stocks, but still, silver miners’ performance still affects it. And… GDX is still trading relatively close to the yearly lows. Silver moved a bit above its 2020 highs – did miners do that as well? Absolutely not, they were only able to trigger a tiny move higher.
And based on yesterday’s decline, most of the recent run-up was already erased.
Interestingly, the most recent move higher only made the similarity of this shoulder portion of the bearish head-and-shoulders pattern to the left shoulder (figure 2 - both marked with green) bigger. This means that when the GDX breaks below the neck level of the pattern in a decisive way, the implications are likely to be extremely bearish for the next several weeks or months.
Due to the uncanny similarity between the two green rectangles, I decided to check what happens if this mirror-similarity continues. I used purple, dashed lines for that. There were two important short-term price swings in April 2020 – one shows the size of the correction and one is a near-vertical move higher.
Copying these price moves (purple lines) to the current situation, we get a scenario in which GDX (mining stocks) moves to about $31 and then comes back up to about $34. This would be in perfect tune with what I wrote previously. After breaking below the head-and-shoulders pattern, gold miners would then be likely to verify this breakdown by moving back up to the neck level of the pattern. Then, we would likely see another powerful slide – perhaps to at least $24.
All in all, it seems that silver’s run-up was just a temporary phenomenon and the next big medium-term move in the precious metals and mining stocks is going to be to the downside.
Having said that, let’s take a look at gold.
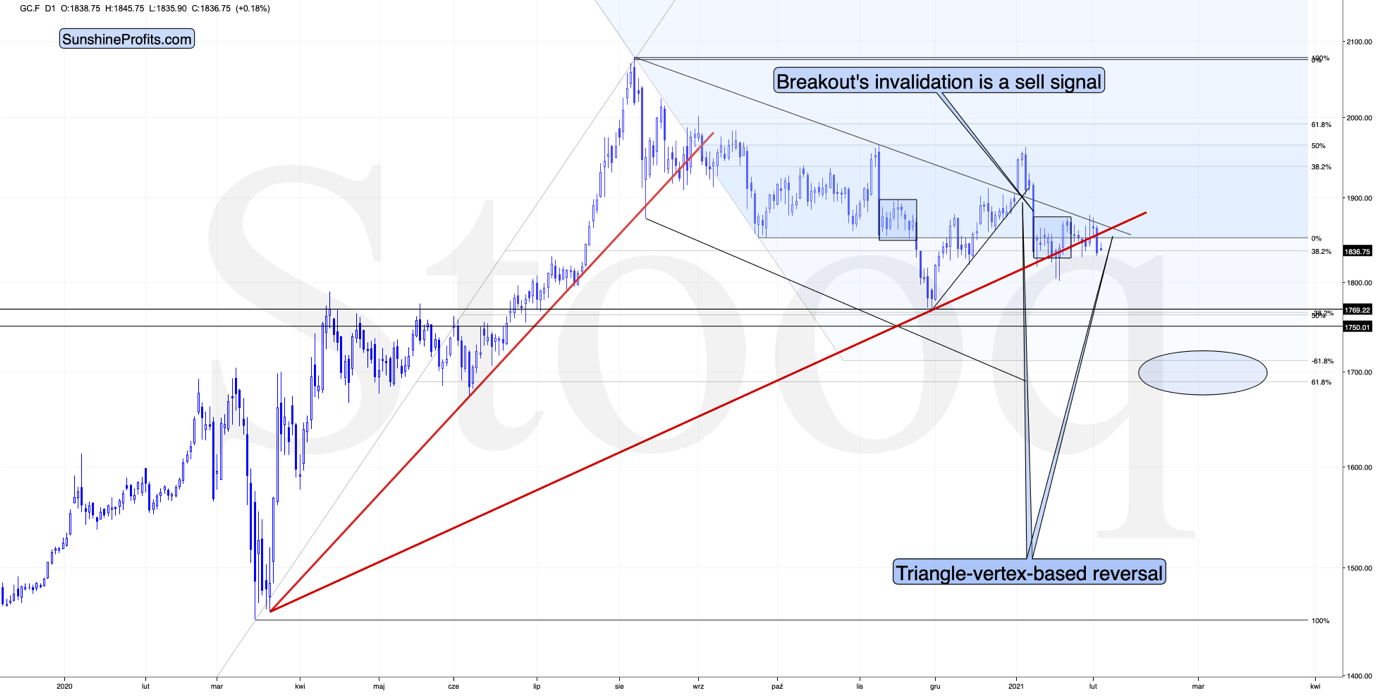
Figure 3 - COMEX Gold Futures (GC.F)
In my previous analysis, I wrote the following:
Despite yesterday’s higher close, gold is already back down in today’s pre-market trading. All that we saw recently was a back-and-forth movement that was a part of a consolidation which started after gold declined earlier this year in a volatile manner.
Please note that the thing that prevented gold from declining further right away, was the rising red support line based on the March 2020 and November 2020 lows. In all cases, when gold was about to break below this line, it ultimately moved slightly higher. Right now, gold is making another attempt to break below it. It seems quite likely that this attempt will be successful.
Gold just broke lower yesterday, and that was the first day this year when it closed visibly below the rising red support line. This breakdown is not yet confirmed, but the implications are already more bearish than they were previously.
Please recall how well the previous triangle-vertex-based reversal worked, pinpointing the top in early January. We now have yet another triangle-vertex-based reversal, just around the corner.
The implication is that if gold slides immediately, then it it’s likely to (temporarily) bottom in a few days. But – what seems more probable – if gold consolidates a bit right now and moves back up to the previously broken red support line, thus verifying it as resistance, then this triangle-vertex-based reversal is likely to mark a local top and the start of the next decline. This might be the start of the decline that takes to gold to $1,700 or so.
Also, let’s keep in mind how little it took for gold to decline below its support line.
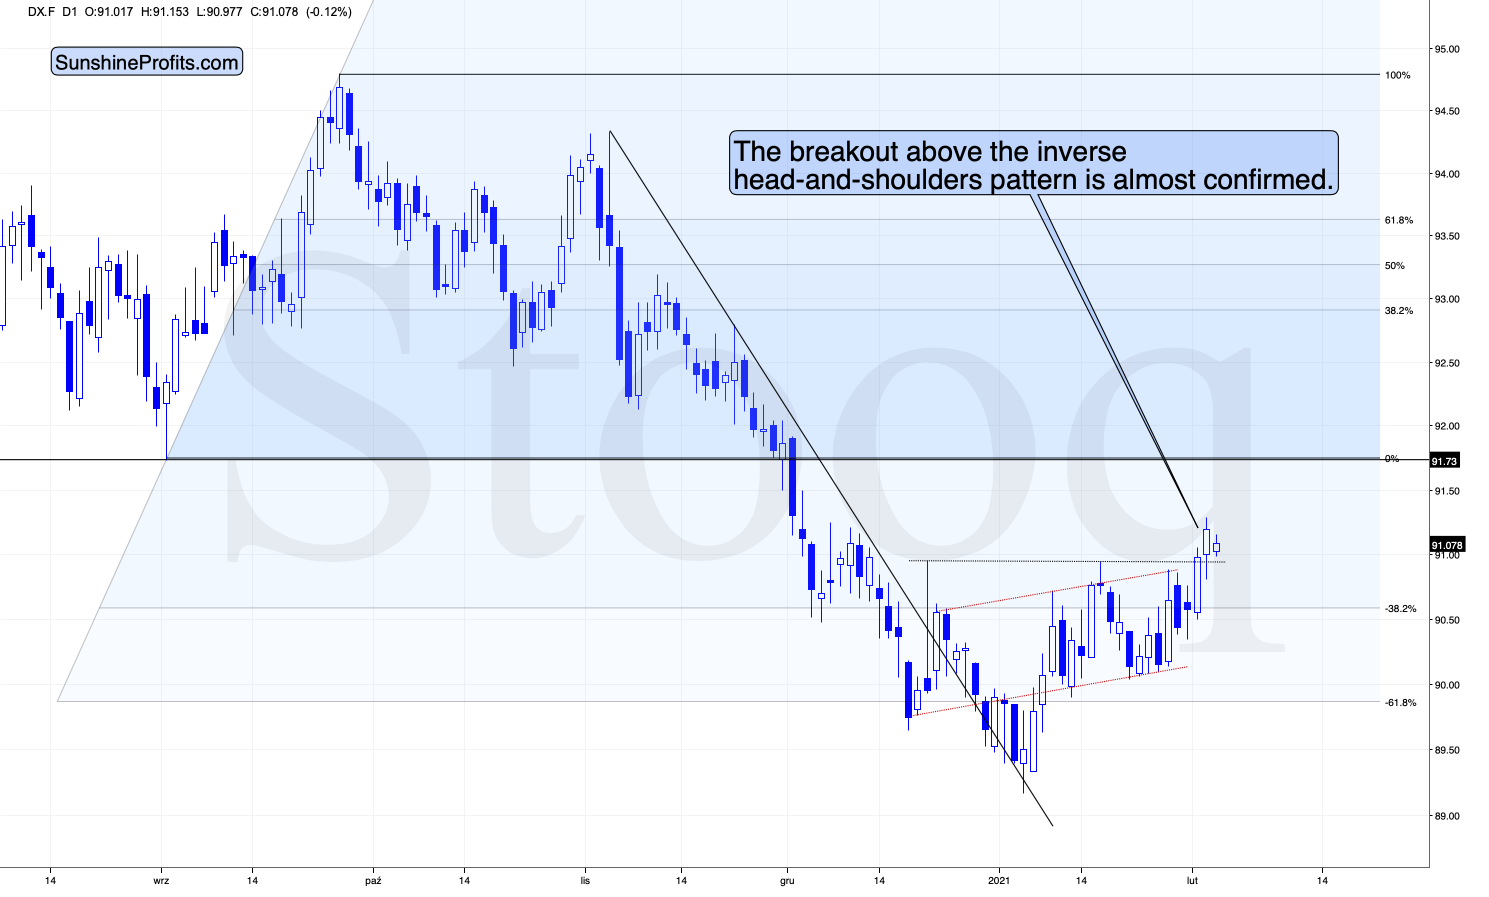
Figure 4 - USD Index
The USD Index moved just slightly higher yesterday (Feb. 2) and this should normally cause gold to decline just a little. But, it managed to slide below and important support line instead.
Since the move higher in the USD Index seems to be only beginning, the price of gold (and the rest of the precious metals sector) is likely to be negatively affected as well.
Yesterday’s move to a new yearly high is not that important as the move above the neck level of the inverse head-and-shoulders pattern. This move is not yet confirmed, but once it is confirmed, it’s likely to trigger another powerful upswing. For the move to be fully confirmed, we need just one additional daily close above the ~91 level.
Most importantly, however, the USD Index is also above the medium-term declining resistance line and the 50-day moving average.
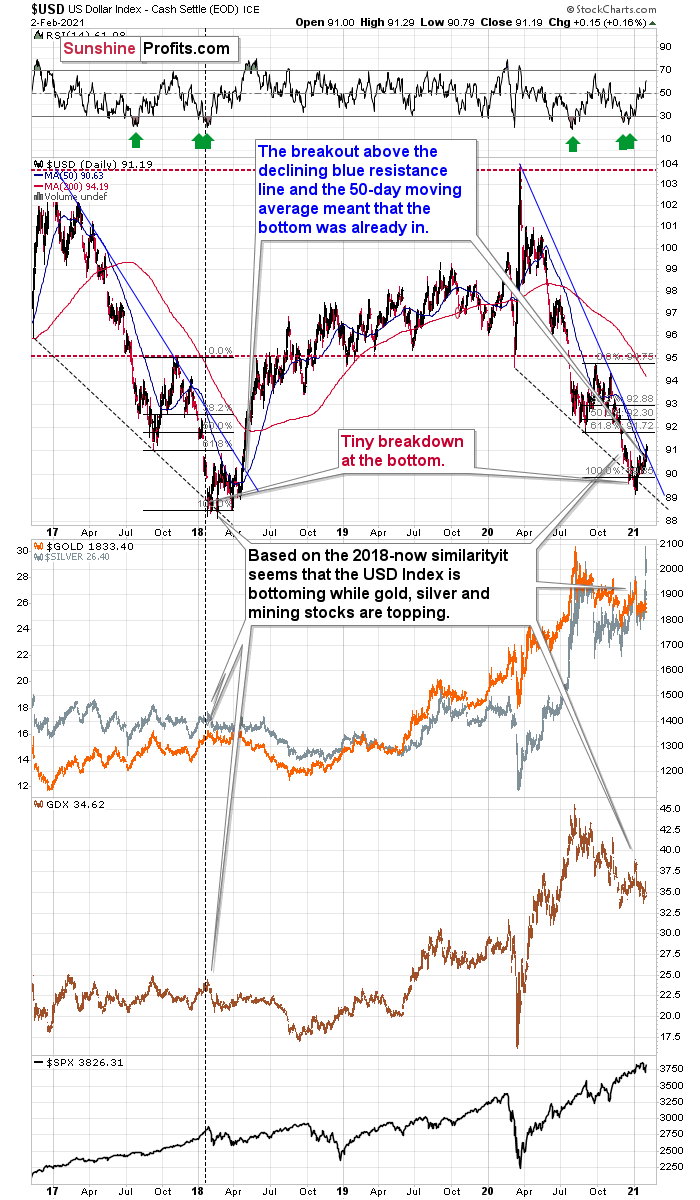
Figure 5 – USD Index’s medium-term chart
The USD Index closed at 91.19 yesterday, which was above both the declining resistance line and the 50-day MA (90.63).
When we saw this kind of strong double breakout back in 2018, it implied that a massive upswing was already underway. Naturally, the implications for the precious metals sector are bearish.
Having said that, let’s take a look at the markets from the fundamental point of view.
EUR-on to Something
For weeks, I’ve been warning that the fundamental disconnect between the U.S. and Eurozone economies could pressure the EUR/USD.
And on Jan. 29, I wrote:
The economic divergence between Europe and the U.S. continues to widen. On Jan. 28, the U.S. Bureau of Labor Statistics (BLS) revealed that U.S. GDP (advanced estimate) likely expanded by 4.0% in the fourth-quarter.
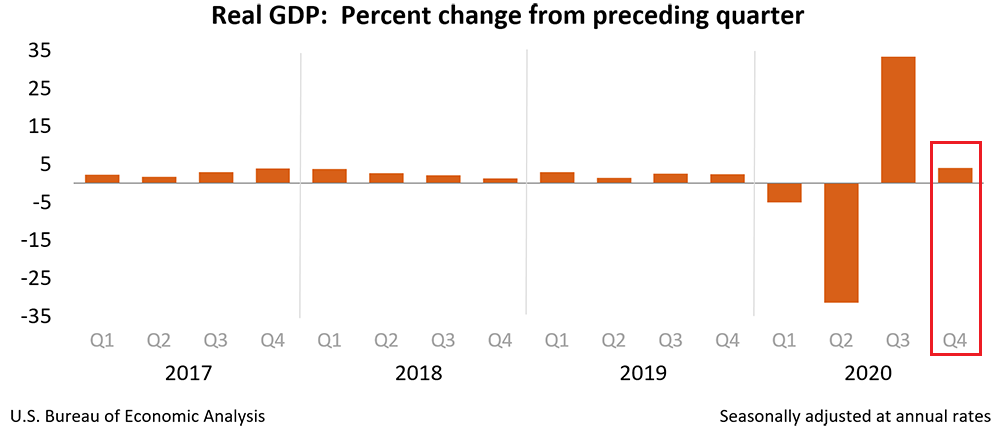
Figure 6
Making its counter move, Eurozone fourth-quarter GDP was released on Feb. 2, revealing that the European economy shrank by 0.7% (the red box below). Even more revealing, France and Italy – Europe’s second and third-largest economies – underperformed the bloc average, contracting by 1.3% and 2.0% respectively (the blue box below).
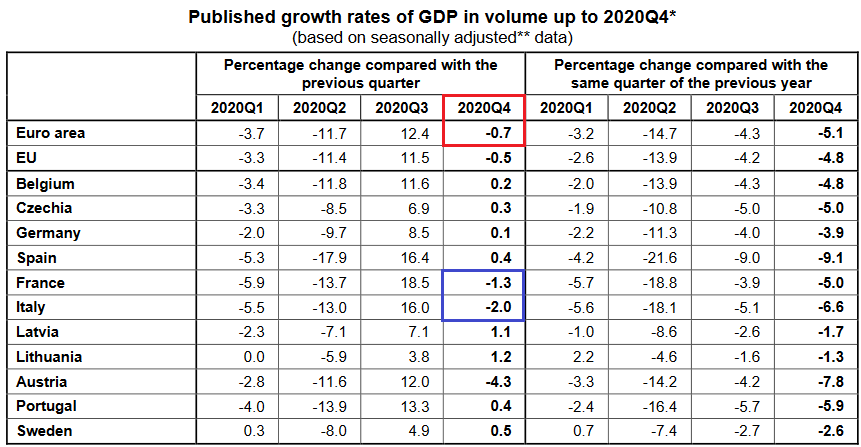
Figure 7 - Source: Eurostat
In addition, German retail sales (released on Feb. 1) declined by 9.6% in December – well below the 2.6% contraction expected by economists. And why is this relevant? Because the month-over-month decline was the largest since 1956 and speaks volumes coming from Europe’s largest economy.
Please see below:
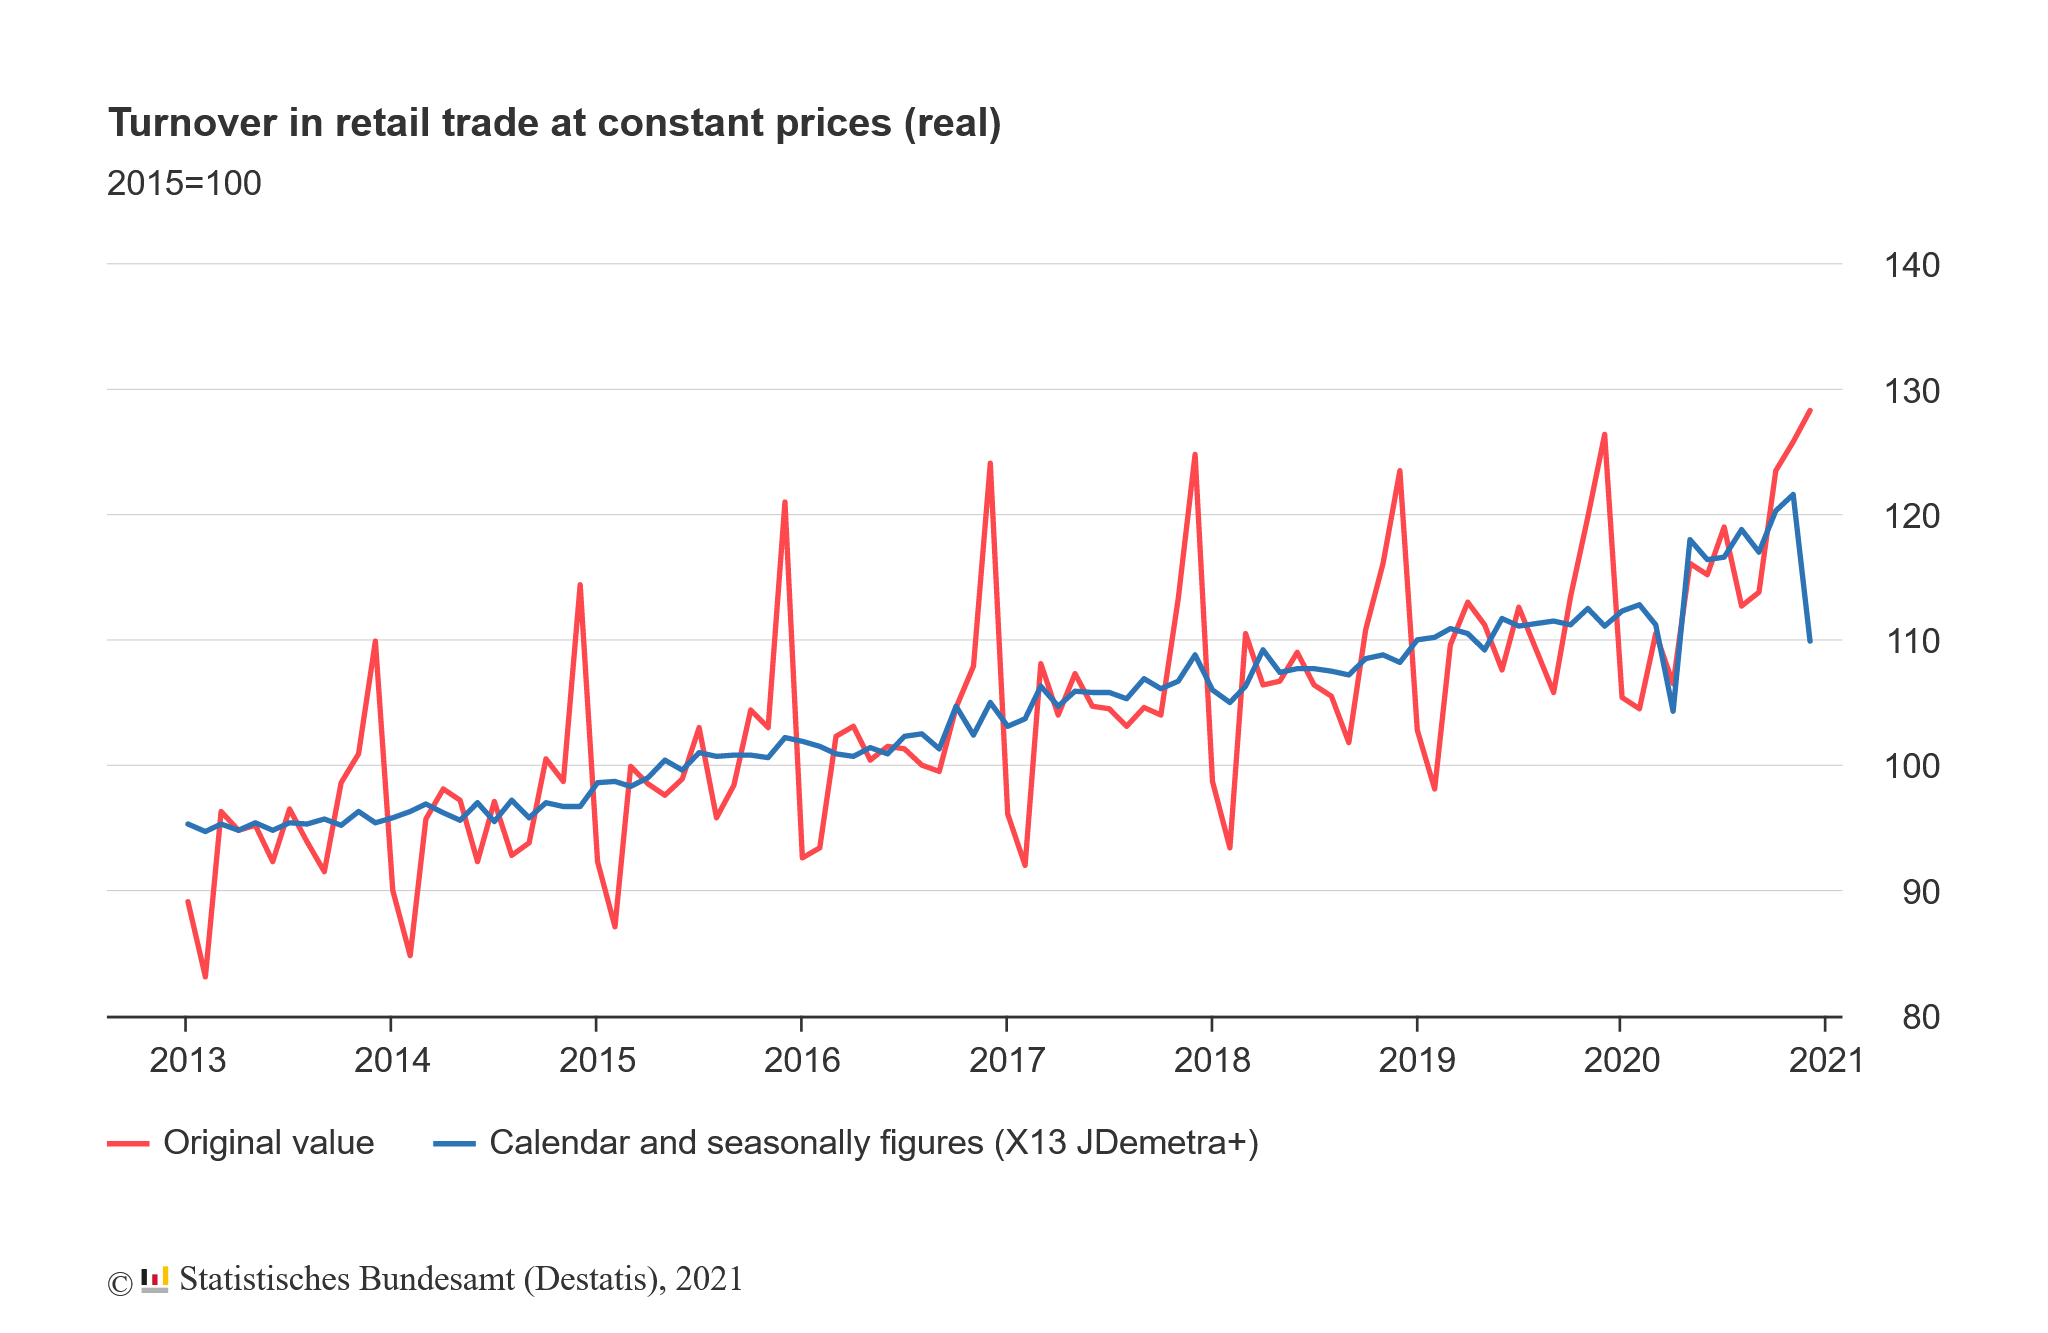
Figure 8
If that wasn’t enough, Spain’s (Europe’s fourth-largest economy) Q4 GDP inched up by only 0.40% (the red box below). And not only did the figure come in well below the Spanish government’s December estimate (of an increase of 2.40%), the country’s exports declined by 1.4%, while business investment plunged by 6.2% (the blue boxes below).
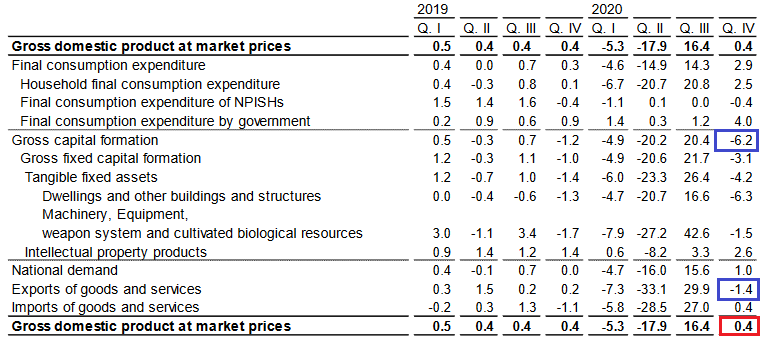
Figure 9 - Source: Instituto Nacional de Estadística (Spain’s National Statistics Institute)
Moreover, as the fiscal situation worsens across Europe’s four-largest economies, the European Central Bank (ECB) has no choice but to pick up the slack. As of Feb. 2, the ECB’s balance sheet now totals more than 70% of Eurozone GDP (up from 69%). More importantly though, the figure is more than double the U.S. Federal Reserve’s (FED) 34.5% (down from 35%).
Please see below:
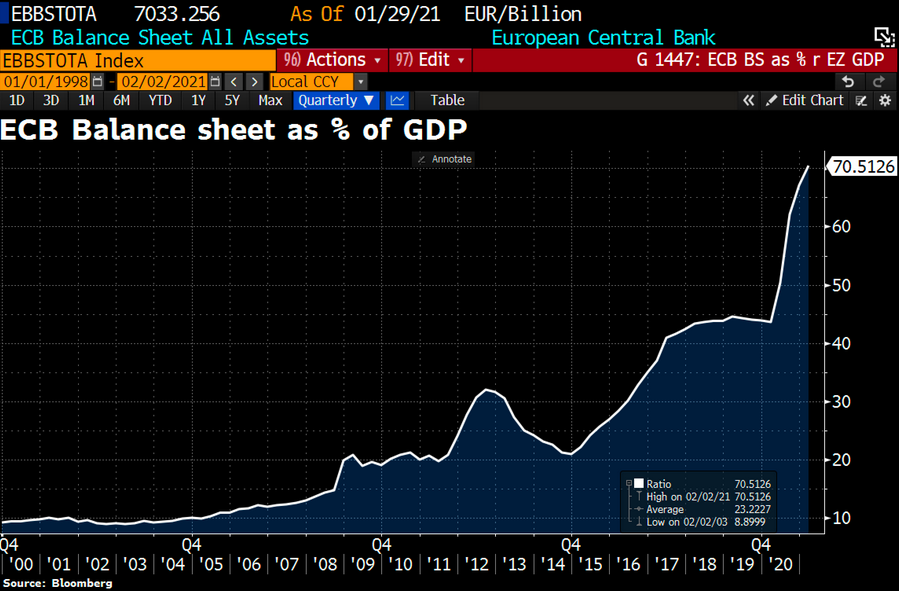
Figure 10
Thus, while the ECB’s money printer works overtime relative to the FED’s, the dominoes are lining up for a material fall:
- The ECB’s relative outprinting causes the FED/ECB ratio to decline
- A declining FED/ECB ratio causes the EUR/USD to decline
- A declining EUR/USD causes the precious metals to decline
To explain, please see below:
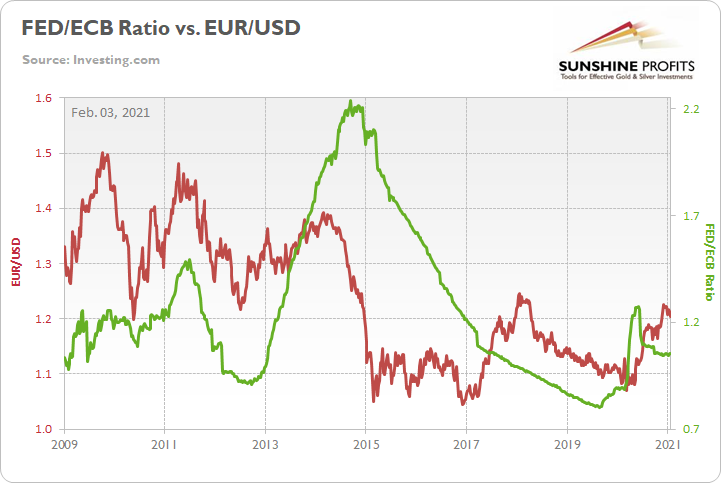
Figure 11
The red line above depicts the movement of the EUR/USD, while the green line above depicts the FED/ECB ratio. As you can see, when the green line rises (the FED is outprinting the ECB), the EUR/USD also tends to rise. Conversely, when the green line falls (the ECB is outprinting the FED), the EUR/USD tends to fall.
As it stands today, the FED/ECB ratio has declined by 0.26% week-over-week and is down by nearly 18% since June. And if you analyze the right side of the chart, you can see that the EUR/USD is starting to notice. As the FED/ECB ratio tracks lower, the EUR/USD is starting to roll over. And if history is any indication, the EUR/USD has plenty of catching up to do.
Also signaling a profound EUR/USD decline, I warned on Jan. 27 that the EUR/GBP could be the canary in the coal mine.
On Monday (Jan. 25), I wrote that Janet Yellen’s pledge to “act big” on the next coronavirus relief package ushered the EUR/GBP back above critical support.
However, on Tuesday (Jan. 26), the key level broke again.
Please see below:
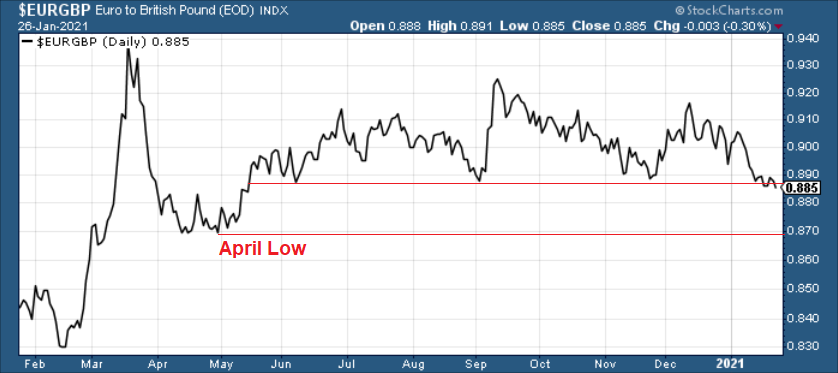
Figure 12
More importantly though, a break in the EUR/GBP could be an early warning sign of a forthcoming break in the EUR/USD.
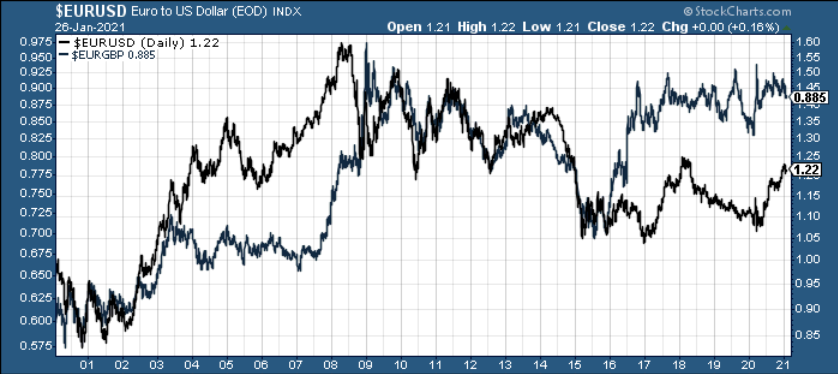
Figure 13
If you analyze the chart above, ~20 years of history shows that the EUR/GBP and the EUR/USD tend to follow in each other’s footsteps. As a result, if the EUR/GBP retests its April low (the next support level), the EUR/USD is likely to tag along for the ride (which implies a move back to ~1.08).
As it stands today, the wheels are already in motion. On Feb. 2, the EUR/GBP made another fresh low and the initial support level is all but gone.
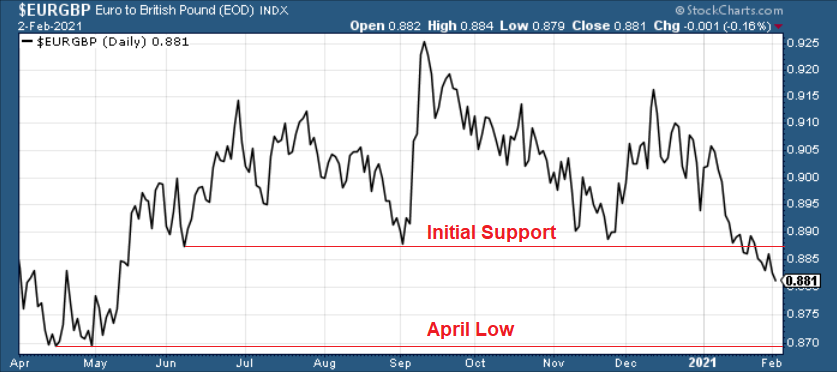
Figure 14
Furthermore, notice how the EUR/USD is tracking the EUR/GBP lower? Despite being a fair distance from the ~1.08 level, the euro’s weakness relative to sterling is a sign that the Eurozone calamity is finally starting to weigh on its currency.
If you analyze the chart below, you can see that the EUR/USD has already broken below its December and January support.
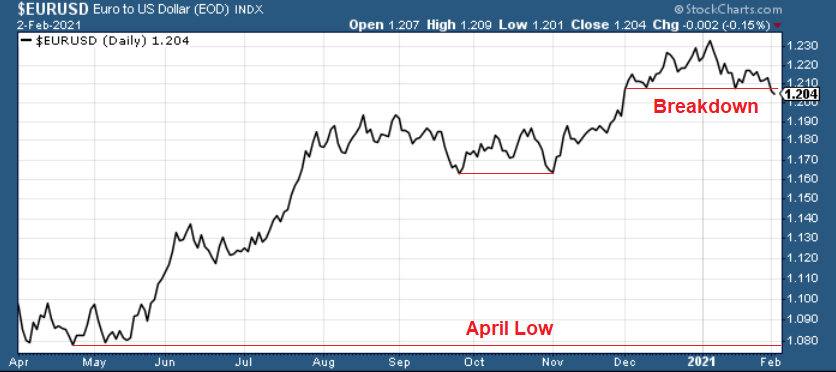
Figure 15
More importantly though, we could be approaching a point of no return.
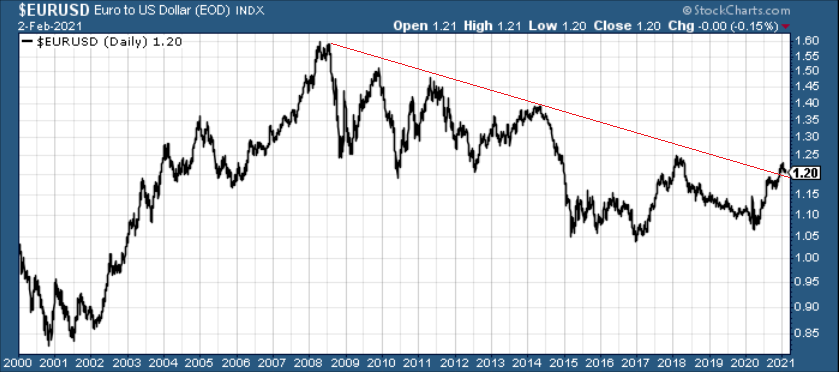
Figure 16
Barely breaking out of a roughly 12-year downtrend, the EUR/USD has yet to invalidate the declining long-term resistance line. As a result, and with the EUR/USD already rolling over, a break below the 1.16/1.17 level puts ~1.08 well within the range of the 2015/2016 lows.
And how could this affect the PMs?
Well, notice how they like to tag along for the EUR/USD’s ride?
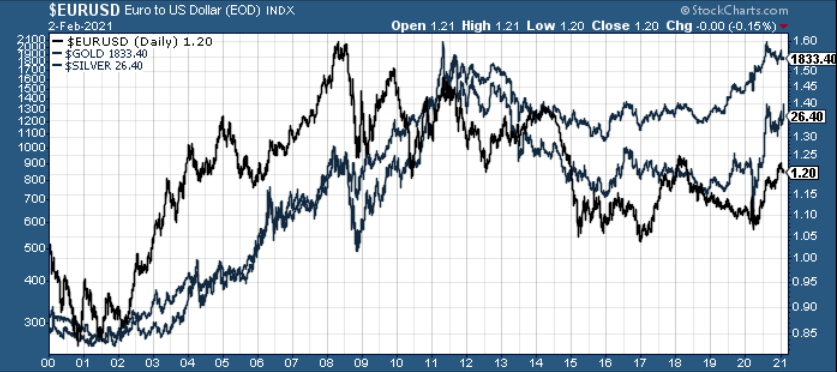
Figure 17
Despite silver’s short squeeze providing a short-term reprieve, it’s no surprise that the EUR/USD’s weakness has been met with angst by the PMs.
Please see below:
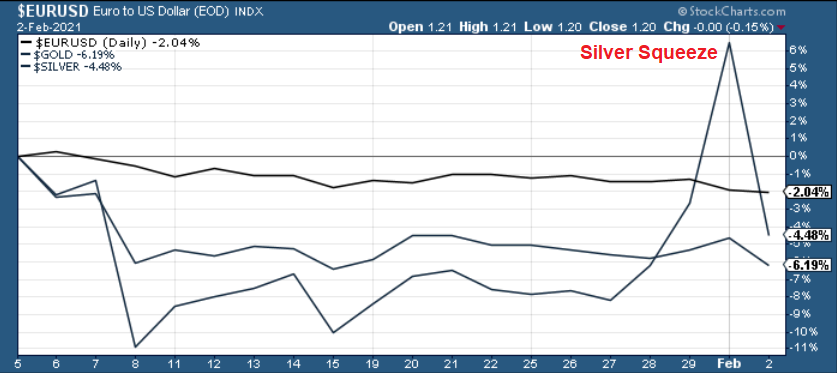
Figure 18
As a result, the floundering euro is ushering the PMs down a one-way street. And while they may veer off to view the scenery from time to time, they all remain on a path to lower prices. Thus, yesterday’s sell-off highlights the superficiality of Monday’s (Feb. 1) surge. But while finding a true bottom requires time and patience, once it occurs, the PMs long-term uptrend will resume once again.
Letters to the Editor
Q: PR - As always, thank you for your insight, knowledge and analysis. Based on your Feb 1 analysis regarding the Kondratiev cycle, is it possible that we actually entered the “Winter” cycle in 2008 and that the Fed using massive amounts of QE, interest cuts and liquidity changed the narrative regarding the confidence, credit and interest rates elements of the cycle --- effectively simulating an Autumn cycle while actually being in the Winter cycle?
The timing lines up using an 18-22 year cycle well with 2008 much better than the current time frame.
It’s as though the “day of reckoning” that should have occurred with deleveraging, etc., associated with a Winter cycle got pushed forward with far greater potential ramifications and consequences.
Curious to see if that is a plausible theory.
A: Thanks, I’m very happy to see that you’re enjoying the results of our work. Well, the Kondratiev cycle is not set in stone as far as its interpretation is concerned, so what you write could indeed be the reality that we’re seeing.
However, I’d say that the interest rates and liquidity/credit would be one of the things that are less debatable with regard to the part of the cycle. Plus, a small rally in stocks and a small deviation from the cycle could be normal, but the rally between 2008 and now is so substantial that I find it difficult to think that we might have been in the Winter cycle since 2008.
One should also keep in mind that this cycle might not be aligned throughout the world, and what I wrote encompassed the so-called “Western” economies, and mainly the U.S.
Q: Dear Mr. Radomski
Thank you for providing such an incredibly detailed analysis.
Regarding the current market environment, I have a couple of questions for you.
1. Could you please provide your projection (short-medium term) on platinum? It seems that platinum lagged behind the other two metals and has been undervalued. Also, it appears that it’s trying to break its resistance ($1,200) and explode higher. Do you believe it is time to buy, or will it experience the same downward pressure from a rallying USD? I’d love to know your opinion on that as well as your price target.
2. If one wants to get exposure to various miners, one can buy different ETFs (e.g., GDX, Ring, GOAU, etc.) or mining stocks. I noticed that one would have done better if one purchased the majors (GOLD, NEM, AEM, KL) than those ETFs (better Sharp Ratio and CAGR). See attachment. What would be a better approach for a buy and hold strategy (not trading)? Stick to one or two miners’ ETF (GDX GDXJ) or invest in a small basket (equally weighted) of 4 major players.
3. Further to point 2, if one wishes to have silver miners exposure, one can choose between SIL (majors) and SILJ (miners). Would it be your preference for a long position? (I noticed SILJ has a higher Sharp ratio).
Thanks for taking the time to review the questions mentioned above.
I look forward to hearing from you,
A: Thanks, it’s great to hear that you’re enjoying our analyses.
As for platinum, I’d say that it’s more or less like silver, but without the popularity. Due to its industrial applications, it’s likely to be heavily affected if (or most likely when) stocks decline in a major way. Since I expect both: popular PMs and stocks to decline if not shortly, then soon anyway, I think that a similar fate awaits platinum.
As far as mining stock selection is concerned, I’d go with our StockPicker tools and focus on the top 5 stocks that they suggest (unless some of them provide leverage to the underlying metal smaller than 1), and then rebalance these holdings (naturally, after the final bottom).
We prepared quite lengthy and detailed reports on these tools’ usefulness (one general and one about rebalancing), but these tools never got the publicity they (in my opinion) deserve. The reports were written years ago, so the prices provided in them might seem off, but the logic behind the algorithms remains up-to-date.
With regard to timing, I’d likely first focus on the individual senior miners (they perform well in the initial part of a long-term rally) and then as the rally matures, I’d switch into either: junior mining stocks ETF (like GDXJ / SILJ) or I’d move into individual junior mining stocks (keeping diversification in mind and investing in many of them) – juniors tend to perform well in the final part of a given upswing.
I think the above paragraph also replies to your third question – SILJ looks quite good, but I’d focus on it in the second part of the upswing. Please note that GDX rallied the most between the March 2020 low and the mid-April top, while SILJ was well before the half of its rally in mid-April 2020.
Overview of the Upcoming Part of the Decline
- I expect the initial bottom to form with gold falling to roughly $1,700, and I expect the GDX ETF to decline to about $31 - $32 at that time. I then plan to exit the short positions in the miners and I will consider long positions in the miners at that time – in order to benefit from the likely rebound.
I expect the above-mentioned decline to take another 1 – 6 weeks to materialize and I expect the rebound to take place during 1-3 weeks.
- After the rebound (perhaps to $33 - $34 in the GDX), I plan to get back in with the short position in the mining stocks.
- Then, after miners slide once again in a meaningful and volatile way, but silver doesn’t (and it just declines moderately), I plan to switch from short positions in miners to short positions in silver (this could take another 1-4 weeks to materialize). I plan to exit those positions when gold shows substantial strength relative to the USD Index, while the latter is still rallying. This might take place with gold close to $1,500 and the entire decline (from above $1,700 to about $1,500) would be likely to take place within 1-5 weeks and I would expect silver to fall hardest in the final part of the move. This moment (when gold performs very strongly against the rallying USD and miners are strong relative to gold – after gold has already declined substantially) is likely to be the best entry point for long-term investments in my view. This might happen with gold close to $1,500, but it’s too early to say with certainty at this time.
Consequently, the entire decline could take between 3 and 14 weeks, while the initial part of the decline (to $1,700 in gold) is likely to take between 1 and 6 weeks.
The above is based on the information available today and it might change in the following days/weeks.
Summary
To summarize, it might be the case that the next big short-term downswing has just begun as miners broke below the neck level of their almost-yearly head-and-shoulders formation and Thursday’s (Jan. 28) and Friday’s (Jan. 29) invalidation has “accidental” written all over it. The outlook for the precious metals sector remains bearish, especially when it seems that we are entering the “winter” part of the Kondratiev cycle. Silver’s strength seems bullish at first sight, but taking a closer look at this move, and comparing it with previous cases (when silver got so much attention) and with miners’ weakness, provides us with bearish implications for the medium term.
As always, we'll keep you - our subscribers - informed.
To summarize:
Trading capital (supplementary part of the portfolio; our opinion): Full speculative short positions (300% of the full position) in mining stocks is justified from the risk to reward point of view with the following binding exit profit-take price levels:
Senior mining stocks (price levels for the GDX ETF): binding profit-take exit price: $32.02; stop-loss: none (the volatility is too big to justify a SL order in case of this particular trade); binding profit-take level for the DUST ETF: $28.73; stop-loss for the DUST ETF: none (the volatility is too big to justify a SL order in case of this particular trade)
Junior mining stocks (price levels for the GDXJ ETF): binding profit-take exit price: $42.72; stop-loss: none (the volatility is too big to justify a SL order in case of this particular trade); binding profit-take level for the JDST ETF: $21.22; stop-loss for the JDST ETF: none (the volatility is too big to justify a SL order in case of this particular trade)
For-your-information targets (our opinion; we continue to think that mining stocks are the preferred way of taking advantage of the upcoming price move, but if for whatever reason one wants / has to use silver or gold for this trade, we are providing the details anyway. In our view, silver has greater potential than gold does):
Silver futures downside profit-take exit price: unclear at this time - initially, it might be a good idea to exit, when gold moves to $1,703.
Gold futures downside profit-take exit price: $1,703
Long-term capital (core part of the portfolio; our opinion): No positions (in other words: cash
Insurance capital (core part of the portfolio; our opinion): Full position
Whether you already subscribed or not, we encourage you to find out how to make the most of our alerts and read our replies to the most common alert-and-gold-trading-related-questions.
Please note that we describe the situation for the day that the alert is posted in the trading section. In other words, if we are writing about a speculative position, it means that it is up-to-date on the day it was posted. We are also featuring the initial target prices to decide whether keeping a position on a given day is in tune with your approach (some moves are too small for medium-term traders, and some might appear too big for day-traders).
Additionally, you might want to read why our stop-loss orders are usually relatively far from the current price.
Please note that a full position doesn't mean using all of the capital for a given trade. You will find details on our thoughts on gold portfolio structuring in the Key Insights section on our website.
As a reminder - "initial target price" means exactly that - an "initial" one. It's not a price level at which we suggest closing positions. If this becomes the case (like it did in the previous trade), we will refer to these levels as levels of exit orders (exactly as we've done previously). Stop-loss levels, however, are naturally not "initial", but something that, in our opinion, might be entered as an order.
Since it is impossible to synchronize target prices and stop-loss levels for all the ETFs and ETNs with the main markets that we provide these levels for (gold, silver and mining stocks - the GDX ETF), the stop-loss levels and target prices for other ETNs and ETF (among other: UGL, GLL, AGQ, ZSL, NUGT, DUST, JNUG, JDST) are provided as supplementary, and not as "final". This means that if a stop-loss or a target level is reached for any of the "additional instruments" (GLL for instance), but not for the "main instrument" (gold in this case), we will view positions in both gold and GLL as still open and the stop-loss for GLL would have to be moved lower. On the other hand, if gold moves to a stop-loss level but GLL doesn't, then we will view both positions (in gold and GLL) as closed. In other words, since it's not possible to be 100% certain that each related instrument moves to a given level when the underlying instrument does, we can't provide levels that would be binding. The levels that we do provide are our best estimate of the levels that will correspond to the levels in the underlying assets, but it will be the underlying assets that one will need to focus on regarding the signs pointing to closing a given position or keeping it open. We might adjust the levels in the "additional instruments" without adjusting the levels in the "main instruments", which will simply mean that we have improved our estimation of these levels, not that we changed our outlook on the markets. We are already working on a tool that would update these levels daily for the most popular ETFs, ETNs and individual mining stocks.
Our preferred ways to invest in and to trade gold along with the reasoning can be found in the how to buy gold section. Furthermore, our preferred ETFs and ETNs can be found in our Gold & Silver ETF Ranking.
As a reminder, Gold & Silver Trading Alerts are posted before or on each trading day (we usually post them before the opening bell, but we don't promise doing that each day). If there's anything urgent, we will send you an additional small alert before posting the main one.
Thank you.
Przemyslaw Radomski, CFA
Founder, Editor-in-chief

