

Briefly: in our opinion, full (300% of the regular position size) speculative short positions in mining stocks are justified from the risk/reward point of view at the moment of publishing this Alert.
Once again, yesterday’s (Jan. 26) session was relatively uneventful on the technical front, but this doesn’t mean that the outlook is any more bullish.
Conversely, it remains bearish because of multiple developments that happened before the current pause. For instance, the invalidation of gold’s breakout above its 2011 high. Even though it had help from a sliding USD Index, the yellow metal still failed to hold above this critical support level.
It seems that the only thing that made gold rally in the recent past was the U.S. inauguration-based uncertainty. As it fades away, gold is losing its gleam. In fact, the previous relative weakness seems to have already returned.
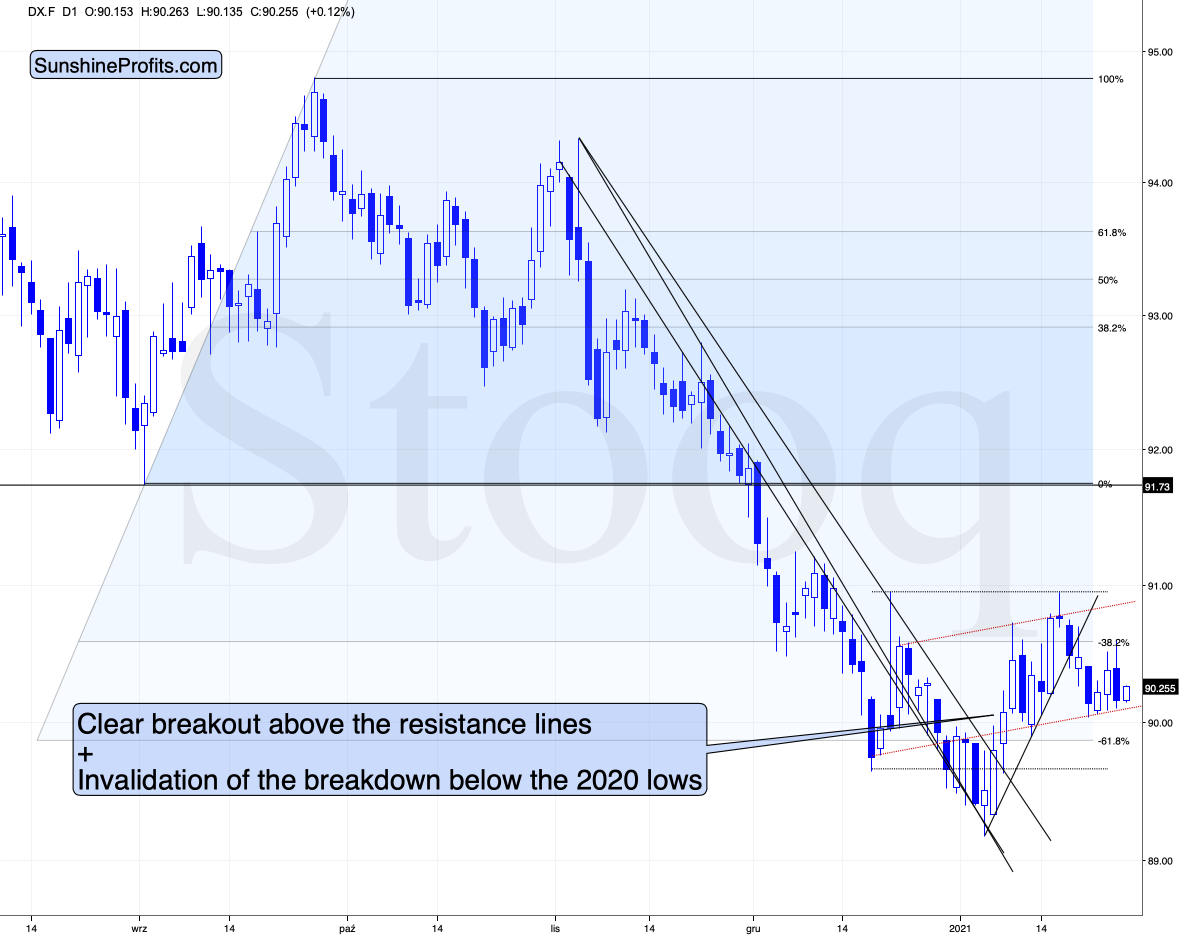
Figure 1 – USD Index futures (DX.F)
Taking the previous two days into account (precisely: yesterday and today’s pre-market trading), we see that the USD Index declined. In such a situation, gold should have rallied or at least paused, but what did it do?
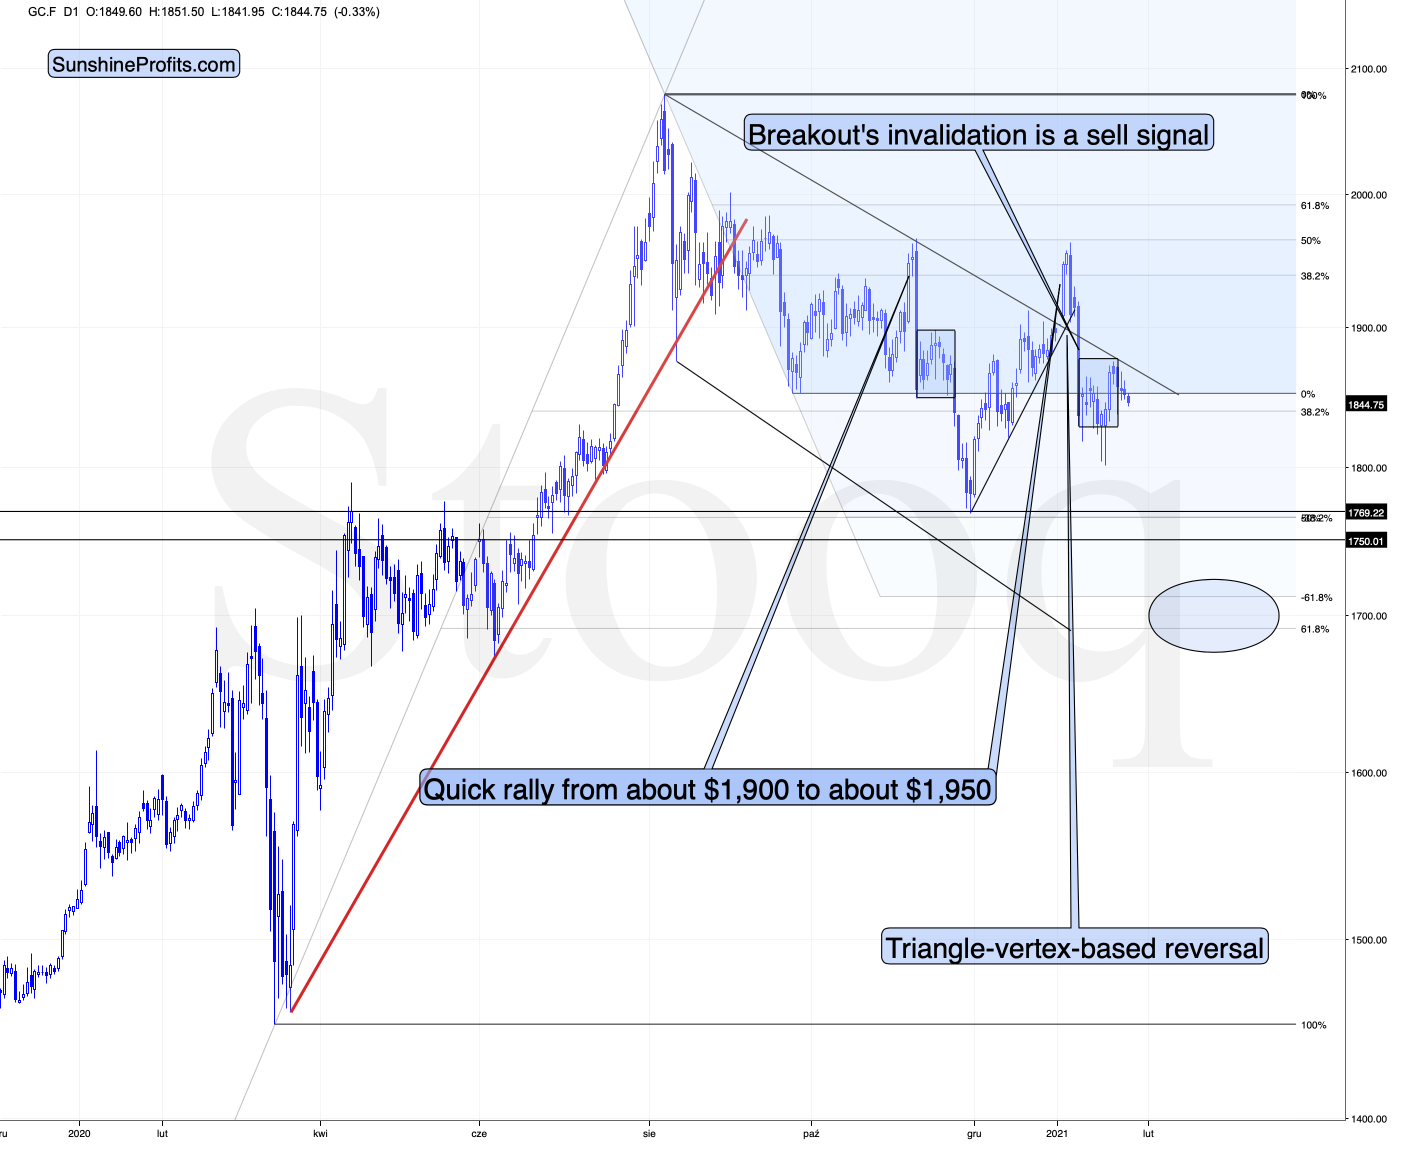
Figure 2 - COMEX Gold Futures (GC.F)
Gold declined. This means that gold’s weakness relative to the USDX is back and that my previous comments on the above chart remain up-to-date:
Looking at the above chart, I marked the November consolidation with a blue rectangle, and I copied it to the current situation, based on the end of the huge daily downswing. Gold moved briefly below it in recent days, after which it rallied back up, and right now it’s very close to the upper right corner of the rectangle.
This means that the current situation remains very similar to what we saw back in November, right before another slide started – and this second slide was bigger than the first one. Consequently, there’s a good reason for gold to reverse any day (or hour) now.
Let’s get back to the USD Index for a minute.
I think that the USD Index is likely to rally in the following weeks, but as far as the next several days are concerned, the situation is relatively unclear.
The USD Index finds itself after the breakout above the declining medium-term resistance line, but it’s also after a breakdown below the rising short-term support line. Consequently, it’s very short-term outlook is relatively unclear. In all cases, I don’t see it moving visibly below the previous 2021 low.
And since the situation is unclear with regard to the short-term in case of the USDX, it would be natural for gold to hesitate. Since it’s already declining, it seems that even if the USDX tested its previous 2021 low, gold would not rally far.
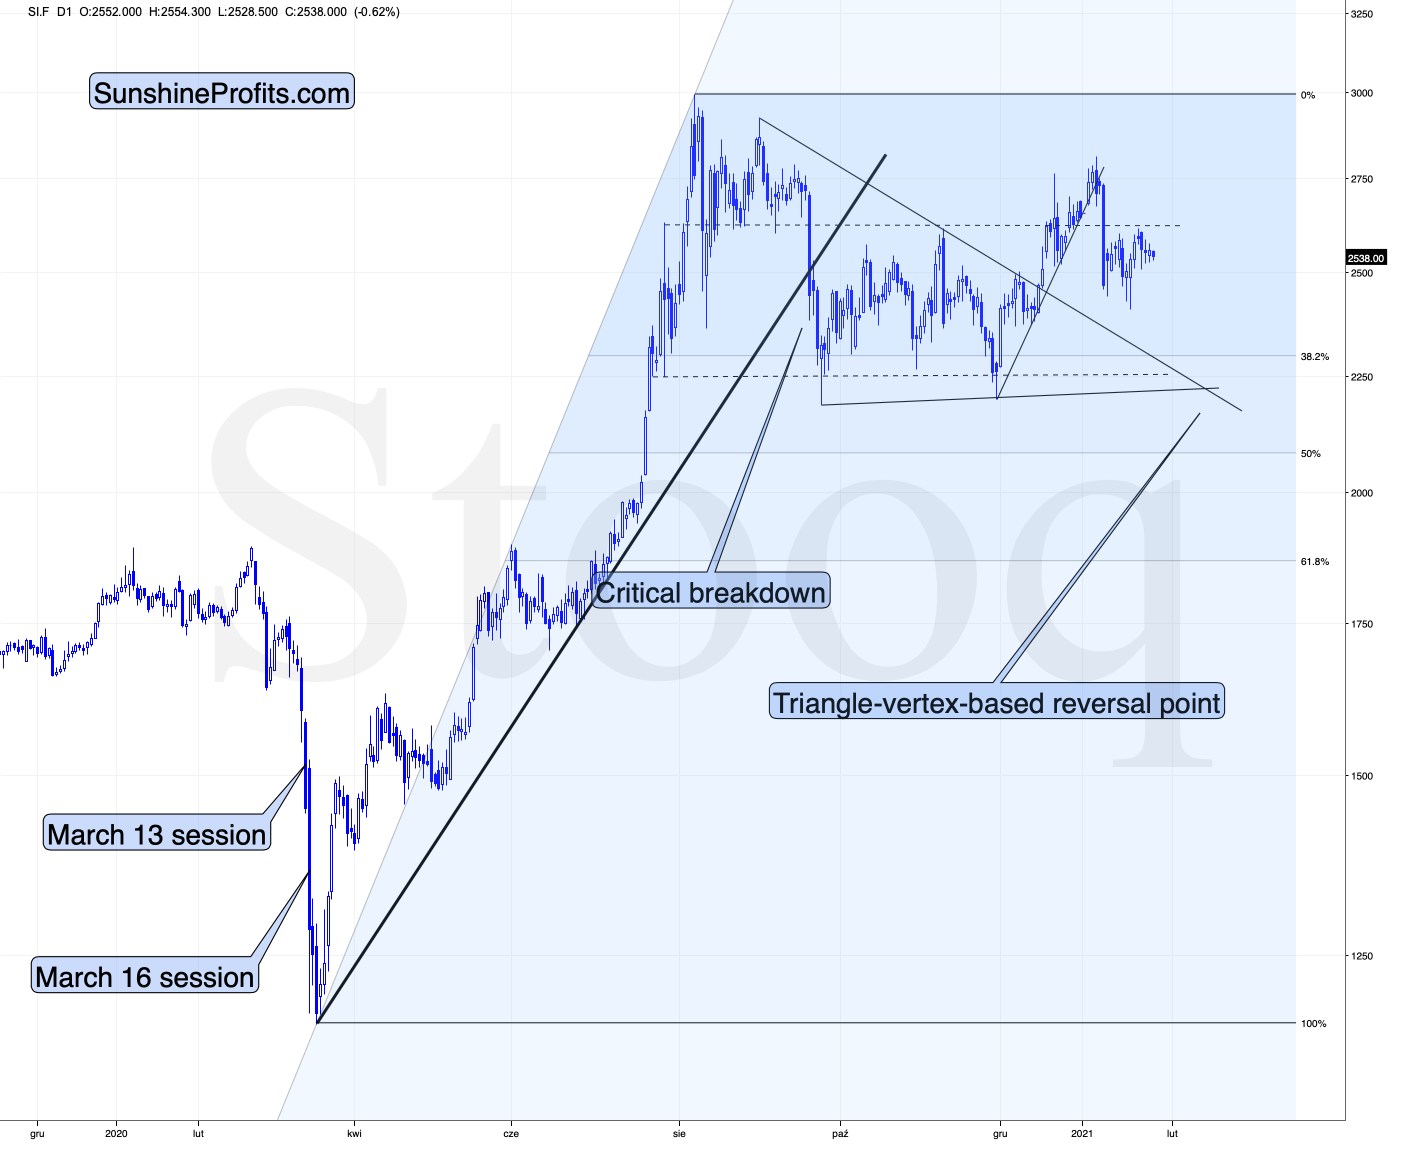
Figure 3 - COMEX Silver Futures (SI.F)
Similarly to gold, silver is not doing much. The white metal is moving back and forth after the big January slide and it seems to be preparing for another move lower.
Let’s keep in mind that silver has a triangle-vertex-based reversal in late February – close to Feb. 23. Based on what we’ve seen so far, it seems quite likely that it will be a major bottom (not likely the final one for this slide, though).
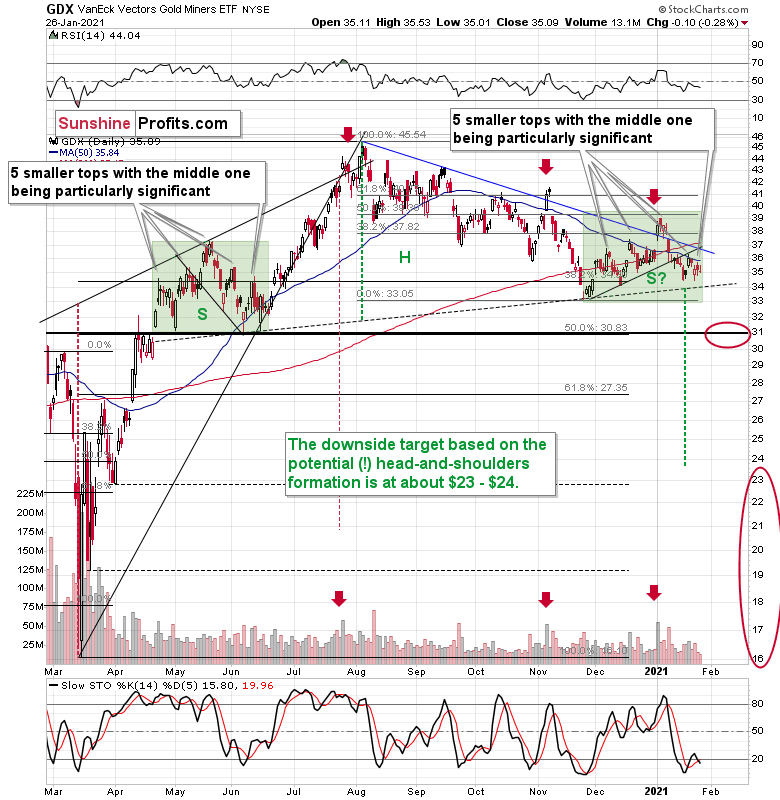
Figure 4 - VanEck Vectors Gold Miners ETF (GDX)
Miners didn’t do much yesterday either, so my previous comments on them remain up-to-date. To explain the pattern, I wrote on Jan. 11:
If you analyze the chart above, the area on the left (marked S) represents the first shoulder, while the area in the middle (H) represents the head and the area on the right (second S) represents the potential second shoulder.
Right now, $33.7-$34 is the do-or-die area. If the GDX breaks below this (where the right shoulder forms) it could trigger a decline back to the $24 to $23 range (measured by the spread between the head and the neckline; marked with green).
And after analyzing Thursday’s (Jan. 21) price action, I wrote the following (on Jan. 22):
As far as the miners are concerned, mining stocks didn’t correct half of their 2021 decline. They didn’t invalidate the breakdown below the rising support line, either. In fact, the GDX ETF closed yesterday’s session below the 50-day moving average. Technically, nothing changed.
Regarding the GDX ETF’s current consolidation pattern (November to present), it mirrors what we saw between April and June of last year (the shaded green rectangles above).
I added:
Both shoulders of the head-and-shoulder formation can be identical, but they don’t have to be, so it’s not that the current consolidation has to end at the right border of the current rectangle. However, the fact that the price is already close to this right border tells us that it would be very normal for the consolidation to end any day now – most likely before the end of January.
If we see a rally to $37, or even $38, it won’t change much – the outlook will remain intact anyway, and the right shoulder of the potential head-and-shoulders formation will remain similar to the left shoulder.
But with many paths to get there, is hitting $37 or $38 a prerequisite to the eventual decline? Absolutely not. The GDX ETF could reverse right away and catch many market participants flat-footed.
Remember, it’s important to keep last week’s rally in context. Despite the Yellen-driven bounce, the GDX ETF is still down considerably from its January highs.
Having said that, let’s take a look at the market from a more fundamental angle.
The Widening Economic Divergence
For weeks, I’ve been highlighting the economic malaise confronting the Eurozone. And like a fork in the road, the U.S. and Europe continue to head in opposite directions. More importantly though, the fundamental fate of the two regions, and the subsequent performance of the EUR/USD, will go a long way in determining the precious metals’ destiny.
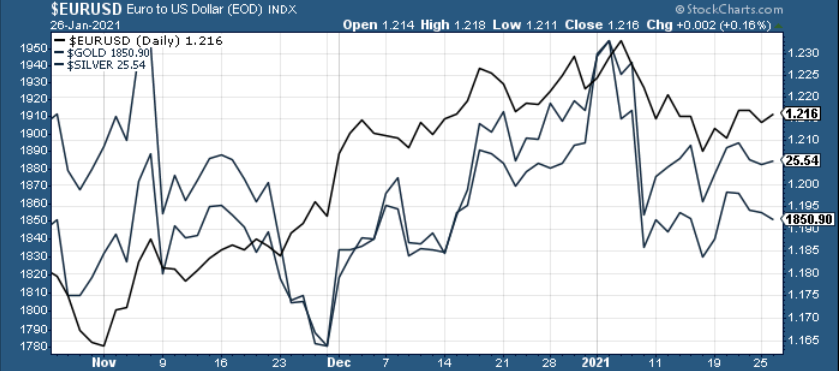
Figure 5
If you analyze the chart above, you can see that gold and silver tend to track the performance of the EUR/USD. And while gold bucked the trend on Tuesday (Jan. 26), silver still remains a loyal follower. Thus, as the European economy sinks further into quicksand, its relative underperformance is likely to pressure the EUR/USD and usher the PMs lower.
On Friday (Jan. 22), the IHS Markit Eurozone Composite PMI fell to 47.5 in January (down from 49.1 in December), with services falling to 45.0 (from 46.4) and manufacturing falling to 54.7 (from 55.2).
Please see below:
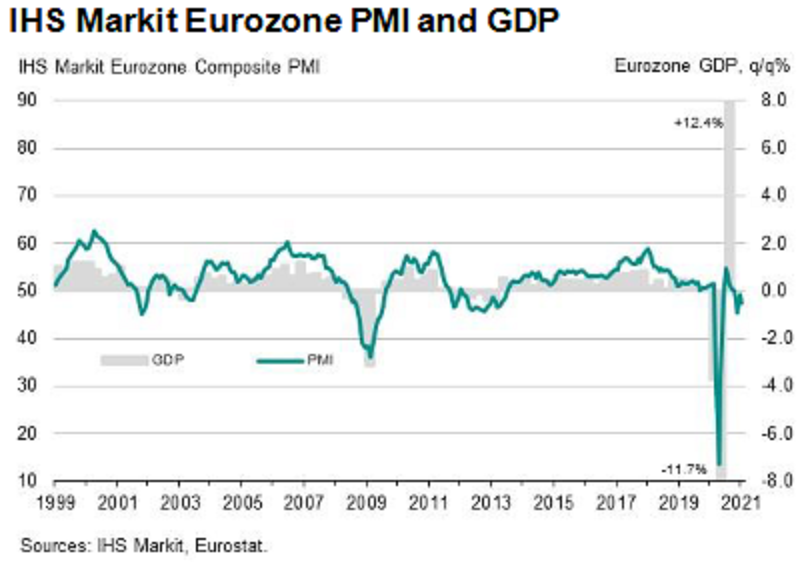
Figure 6
To explain, PMI (Purchasing Managers’ Index) data is compiled through a monthly survey of executives at more than 400 companies. A PMI above 50 indicates business conditions are expanding, while a PMI below 50 indicates that business conditions are contracting (the scale on the left side of the chart).
In contrast to the Eurozone, the U.S. Composite PMI rose to 58 in January (up from 55.3 in December), with services rising to 57.5 (up from 54.8) and manufacturing rising to 59.1 (up from 57.1).
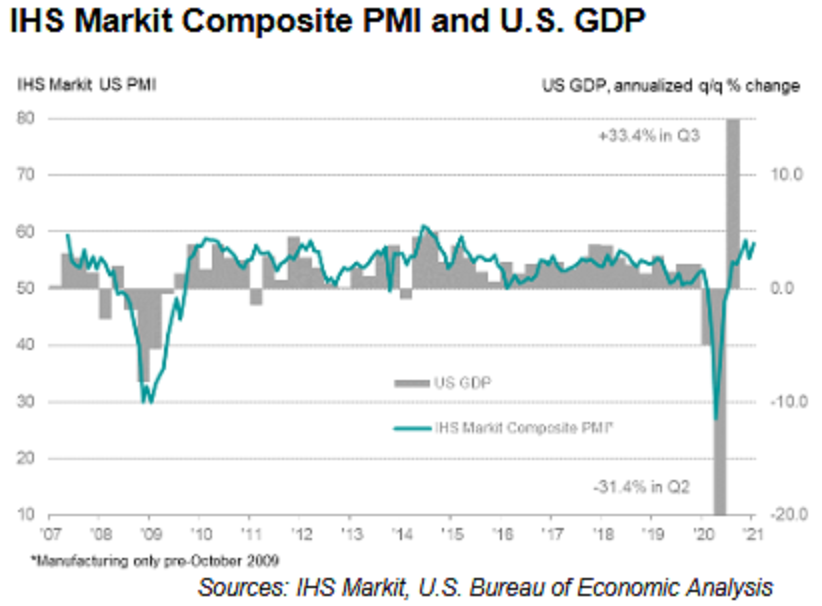
Figure 7
In addition, after European Central Bank (ECB) President Christine Lagarde revealed (on Jan. 21) that the Eurozone economy likely shrank in the fourth-quarter (all but sealing a double-dip recession), Germany (the Eurozone’s largest economy) cut its 2021 GDP growth forecast from 4.4% to 3.0%.
And not looking any better, the International Monetary Fund’s (IMF) World Economic Outlook Report – which covers IMF economists' analysis over the short and medium-term – has the U.S. economy expanding by 5.1% in 2021 versus only 4.2% for the Eurozone. More importantly though, the Eurozone economy is expected to contract by 7.2% in 2020 versus 3.4% for the U.S. As a result, Europe has to dig itself out of a much larger hole.
Please see below:
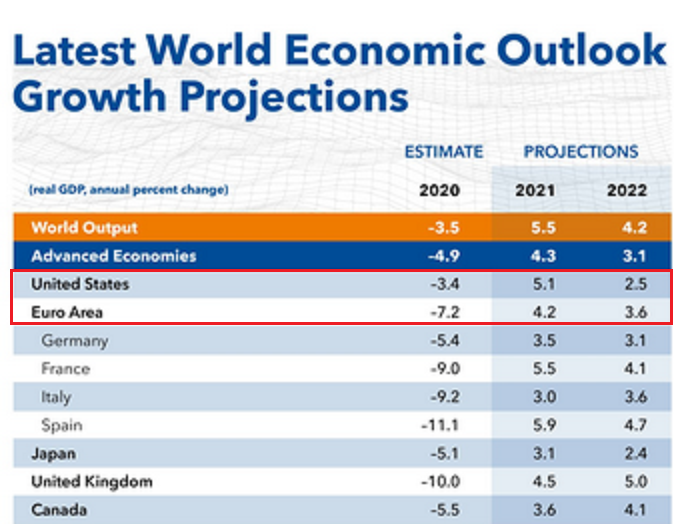
Figure 8
Also noteworthy, the IMF downgraded its GDP growth forecast for Canada. And because the USD/CAD accounts for more than 9% of the movement in the USD Index (though still well below the nearly 58% derived from the EUR/USD) it’s an important variable to monitor.
Continuing the theme of Eurozone underperformance, U.S. consumer confidence (released on Jan. 26) rose from 87.1 in December (revised) to 89.3 in January (the red box below).
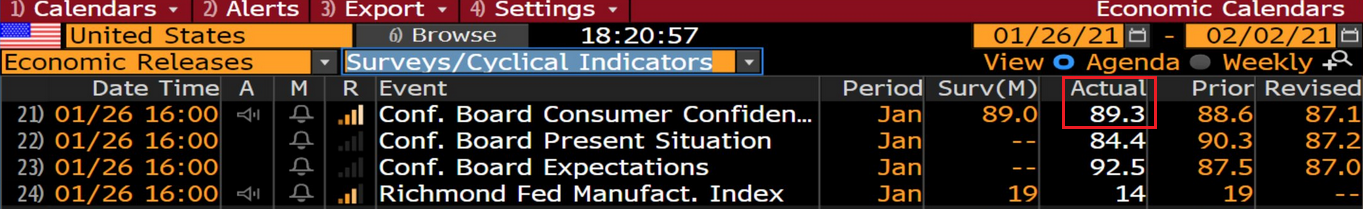
Figure 9 - Source: Bloomberg/ Daniel Lacalle
In contrast, Eurozone consumer confidence (released on Jan. 21) retreated in January. And while both regions’ readings are still well below pre-pandemic levels, currencies trade on a relative basis. As a result, the relative underperformance of the Eurozone is bearish for the EUR/USD.
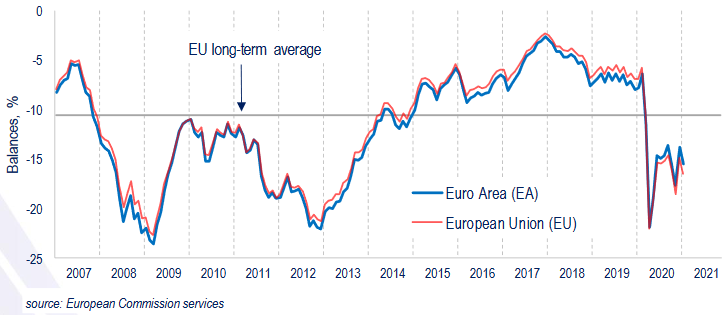
Figure 10
If that wasn’t enough, the ECB essentially admitted it wants a weaker euro. On Tuesday (Jan. 26), reports surfaced that the ECB will investigate the causes of the euro’s appreciation relative to the greenback. Translation? The central bank is studying ways to devalue the currency.
Adding more fuel to the fire, the yield differential between the U.S. and Europe foretells a higher USD Index. Dating back to 2003, after the U.S. 10-Year Treasury yield troughed and began rising, the USD Index (except for 2008-2009) always followed suit.
Please see below:
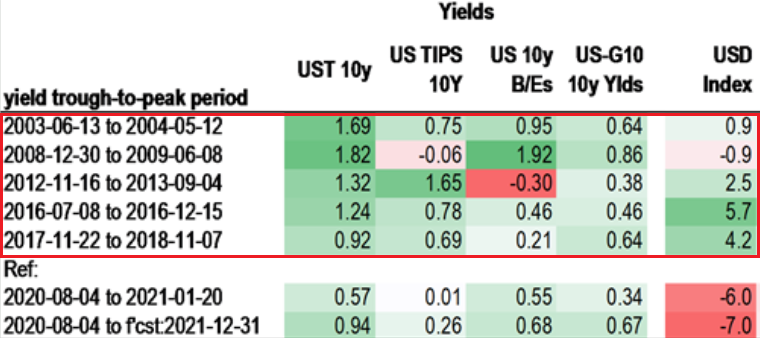
Figure 11 - Source: Daniel Lacalle
In contrast, if you analyze the area at the bottom, you can see that the U.S. 10-Year Treasury yield has bounced by 57 basis points from its August low. But moving in the opposite direction, the USD Index is lower now than it was it August.
Furthermore, notice the large divergence that’s occurred since the beginning of December?
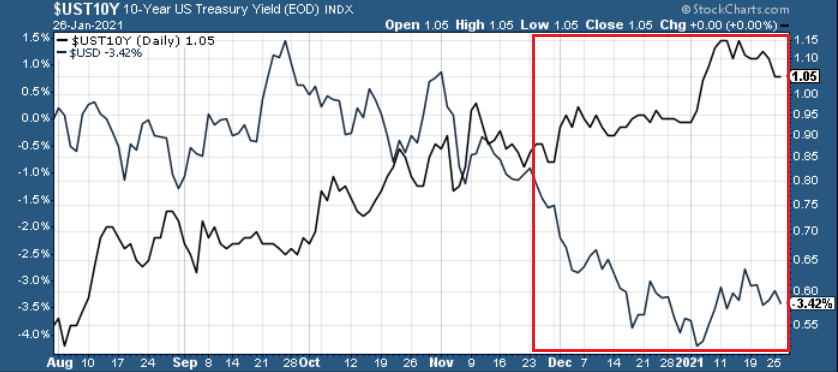
Figure 12
The abnormal behavior above highlights the power of sentiment. Because U.S. investors ‘want’ a lower USD Index, they’re willing to overlook technicals, fundamentals, historical precedent and essentially, reality. However, if the dynamic reverses, the USD Index is ripe for a resurgence.
Circling back to the euro, the currency is already starting to crack. On Monday (Jan. 25), I wrote that Janet Yellen’s pledge to “act big” on the next coronavirus relief package ushered the EUR/GBP back above critical support.
However, on Tuesday (Jan. 26), the key level broke again.
Please see below:
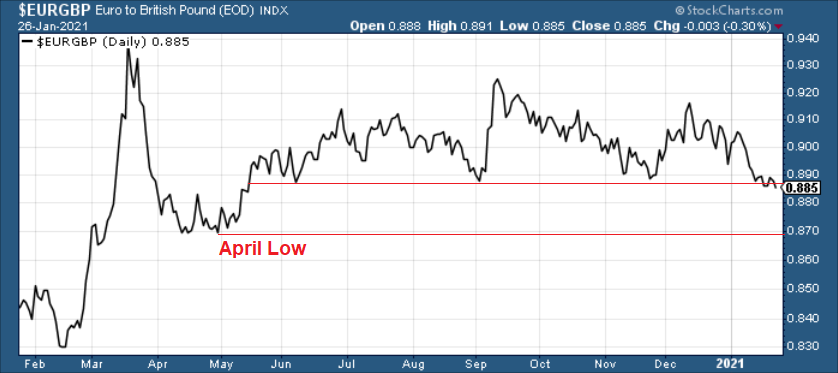
Figure 13
More importantly though, a break in the EUR/GBP could be an early warning sign of a forthcoming break in the EUR/USD.
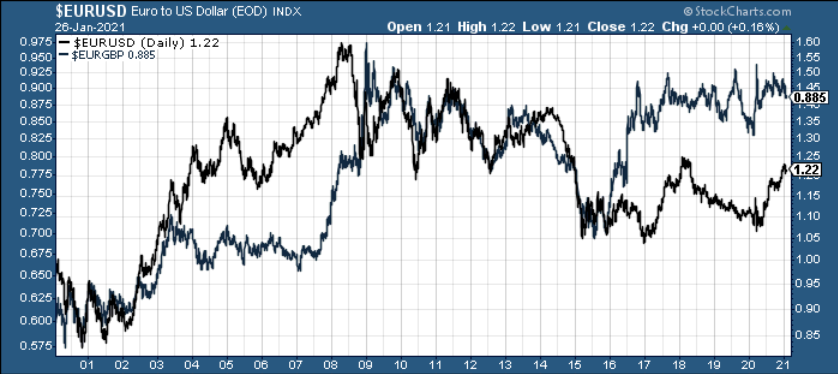
Figure 14
If you analyze the chart above, ~20 years of history shows that the EUR/GBP and the EUR/USD tend to follow in each other’s footsteps. As a result, if the EUR/GBP retests its April low (the next support level), the EUR/USD is likely to tag along for the ride (which implies a move back to ~1.08).
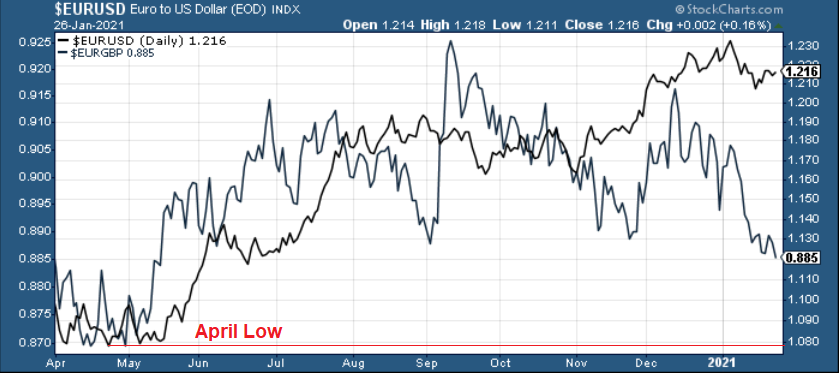
Figure 15
And like a falling string of dominoes, if the EUR/USD retests ~1.08, the PMs should come under significant pressure.
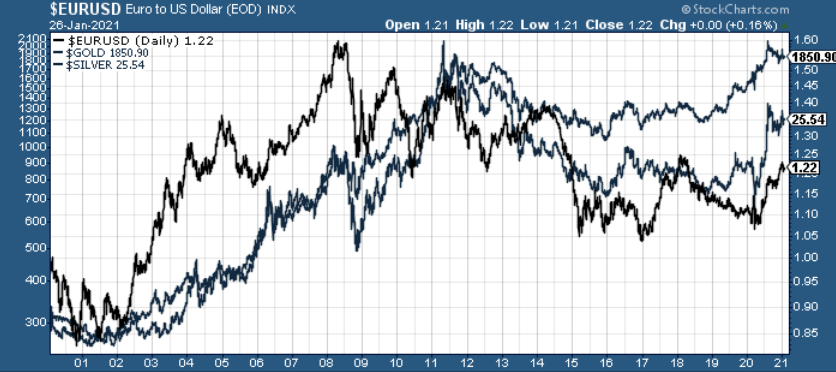
Figure 16
If you analyze the chart above, you can see that over the last ~20 years, gold and silver tend to live and die with the EUR/USD. Naturally, there are also other factors, but the point is that the performance of this currency pair shouldn’t be ignored. As a result, a euro collapse (or at least a significant decline in it) could deliver plenty of fireworks. Conversely, once order is restored and weak Eurozone fundamentals are accurately priced into the EUR/USD, the precious metals will present us with an attractive buying opportunity.
Overview of the Upcoming Part of the Decline
- I expect the initial bottom to form with gold falling to roughly $1,700, and I expect the GDX ETF to decline to about $31 - $32 at that time. I then plan to exit the short positions in the miners and I will consider long positions in the miners at that time – in order to benefit from the likely rebound.
I expect the above-mentioned decline to take another 1 – 6 weeks to materialize and I expect the rebound to take place during 1-3 weeks.
- After the rebound (perhaps to $33 - $34 in the GDX), I plan to get back in with the short position in the mining stocks.
- Then, after miners slide once again in a meaningful and volatile way, but silver doesn’t (and it just declines moderately), I plan to switch from short positions in miners to short positions in silver (this could take another 1-4 weeks to materialize). I plan to exit those positions when gold shows substantial strength relative to the USD Index, while the latter is still rallying. This might take place with gold close to $1,500 and the entire decline (from above $1,700 to about $1,500) would be likely to take place within 1-5 weeks and I would expect silver to fall hardest in the final part of the move. This moment (when gold performs very strongly against the rallying USD and miners are strong relative to gold – after gold has already declined substantially) is likely to be the best entry point for long-term investments in my view. This might happen with gold close to $1,500, but it’s too early to say with certainty at this time.
Consequently, the entire decline could take between 3 and 14 weeks, while the initial part of the decline (to $1,700 in gold) is likely to take between 1 and 6 weeks.
The above is based on the information available today and it might change in the following days/weeks.
Summary
To summarize, while a continuation of the counter-trend upswing may last for the next few days, the outlook for gold and the rest of the precious metals market remains bearish for at least the next few weeks.
After topping at its triangle-vertex-based reversal, gold moved sharply lower and it just invalidated the breakout above its declining resistance line, while breaking below the rising support line. All this happened as the USD Index rallied visibly above its declining resistance lines and invalidated the breakdown below the 2020 lows. This creates a strongly bearish combination for the precious metals market.
The USD Index and cryptocurrencies suggest that we’re seeing the repeat of early 2018, when the USD Index bottomed. Given the current correlations between PMs and the USD Index, the rally in the USDX is likely to have very bearish implications for the precious metals market.
Despite a recent decline, it seems that the USD Index is going to move higher in the following months and weeks, in turn causing gold to decline. At some point gold is likely to stop responding to dollar’s bearish indications, and based on the above analysis, it seems that this is already taking place.
Naturally, everyone's trading is their responsibility. But in our opinion, if there ever was a time to either enter a short position in the miners or increase its size if it was not already sizable, it's now. We made money on the March decline, and on the March rebound, with another massive slide already underway.
After the sell-off (that takes gold to about $1,500), we expect the precious metals to rally significantly. The final part of the decline might take as little as 1-5 weeks, so it's important to stay alert to any changes.
Most importantly, please stay healthy and safe. We made a lot of money on the March decline and the subsequent rebound (its initial part) price moves (and we'll likely earn much more in the following weeks and months), but you have to be healthy to enjoy the results.
As always, we'll keep you - our subscribers - informed.
To summarize:
Trading capital (supplementary part of the portfolio; our opinion): Full speculative short positions (300% of the full position) in mining stocks is justified from the risk to reward point of view with the following binding exit profit-take price levels:
Senior mining stocks (price levels for the GDX ETF): binding profit-take exit price: $32.02; stop-loss: none (the volatility is too big to justify a SL order in case of this particular trade); binding profit-take level for the DUST ETF: $28.73; stop-loss for the DUST ETF: none (the volatility is too big to justify a SL order in case of this particular trade)
Junior mining stocks (price levels for the GDXJ ETF): binding profit-take exit price: $42.72; stop-loss: none (the volatility is too big to justify a SL order in case of this particular trade); binding profit-take level for the JDST ETF: $21.22; stop-loss for the JDST ETF: none (the volatility is too big to justify a SL order in case of this particular trade)
For-your-information targets (our opinion; we continue to think that mining stocks are the preferred way of taking advantage of the upcoming price move, but if for whatever reason one wants / has to use silver or gold for this trade, we are providing the details anyway. In our view, silver has greater potential than gold does):
Silver futures downside profit-take exit price: unclear at this time - initially, it might be a good idea to exit, when gold moves to $1,703.
Gold futures downside profit-take exit price: $1,703
Long-term capital (core part of the portfolio; our opinion): No positions (in other words: cash
Insurance capital (core part of the portfolio; our opinion): Full position
Whether you already subscribed or not, we encourage you to find out how to make the most of our alerts and read our replies to the most common alert-and-gold-trading-related-questions.
Please note that we describe the situation for the day that the alert is posted in the trading section. In other words, if we are writing about a speculative position, it means that it is up-to-date on the day it was posted. We are also featuring the initial target prices to decide whether keeping a position on a given day is in tune with your approach (some moves are too small for medium-term traders, and some might appear too big for day-traders).
Additionally, you might want to read why our stop-loss orders are usually relatively far from the current price.
Please note that a full position doesn't mean using all of the capital for a given trade. You will find details on our thoughts on gold portfolio structuring in the Key Insights section on our website.
As a reminder - "initial target price" means exactly that - an "initial" one. It's not a price level at which we suggest closing positions. If this becomes the case (like it did in the previous trade), we will refer to these levels as levels of exit orders (exactly as we've done previously). Stop-loss levels, however, are naturally not "initial", but something that, in our opinion, might be entered as an order.
Since it is impossible to synchronize target prices and stop-loss levels for all the ETFs and ETNs with the main markets that we provide these levels for (gold, silver and mining stocks - the GDX ETF), the stop-loss levels and target prices for other ETNs and ETF (among other: UGL, GLL, AGQ, ZSL, NUGT, DUST, JNUG, JDST) are provided as supplementary, and not as "final". This means that if a stop-loss or a target level is reached for any of the "additional instruments" (GLL for instance), but not for the "main instrument" (gold in this case), we will view positions in both gold and GLL as still open and the stop-loss for GLL would have to be moved lower. On the other hand, if gold moves to a stop-loss level but GLL doesn't, then we will view both positions (in gold and GLL) as closed. In other words, since it's not possible to be 100% certain that each related instrument moves to a given level when the underlying instrument does, we can't provide levels that would be binding. The levels that we do provide are our best estimate of the levels that will correspond to the levels in the underlying assets, but it will be the underlying assets that one will need to focus on regarding the signs pointing to closing a given position or keeping it open. We might adjust the levels in the "additional instruments" without adjusting the levels in the "main instruments", which will simply mean that we have improved our estimation of these levels, not that we changed our outlook on the markets. We are already working on a tool that would update these levels daily for the most popular ETFs, ETNs and individual mining stocks.
Our preferred ways to invest in and to trade gold along with the reasoning can be found in the how to buy gold section. Furthermore, our preferred ETFs and ETNs can be found in our Gold & Silver ETF Ranking.
As a reminder, Gold & Silver Trading Alerts are posted before or on each trading day (we usually post them before the opening bell, but we don't promise doing that each day). If there's anything urgent, we will send you an additional small alert before posting the main one.
Thank you.
Przemyslaw Radomski, CFA
Founder, Editor-in-chief

