

Briefly: in our opinion, full (100% of the regular position size) speculative long positions in junior mining stocks are justified from the risk/reward point of view at the moment of publishing this Alert.
And that was a reversal, folks
Let’s start today’s analysis with what I wrote yesterday about the general stock market:
Would a 4-index point decline in the USD Index be likely to trigger a rally in gold and junior mining stocks? Yes. And as far as the latter are concerned, if the general stock market moves higher, the rally in them could be quite visible.
Interestingly, the stock market is right above the combination of short-term support levels.
What’s even more interesting is that we have a triangle-vertex-based reversal there today. To show that this technique is useful also in the case of the S&P 500 futures, I marked the previous similar triangle and the reversal that it triggered. Back then it was a local top, but since we’re seeing declines now, it’s much more likely that the reversal will actually be a short-term bottom.
It could be the case that markets rally based on today’s CPI statistics, or that they decline first, reverse, and then rally. Either way, today’s CPI numbers release corresponds quite well to the technical indication that we have about today (that we’re likely to see a reversal).
In short, that’s exactly what happened. I’ll discuss the CPI itself in the following part of the analysis, but for now, let’s focus on what happened on the technical front.
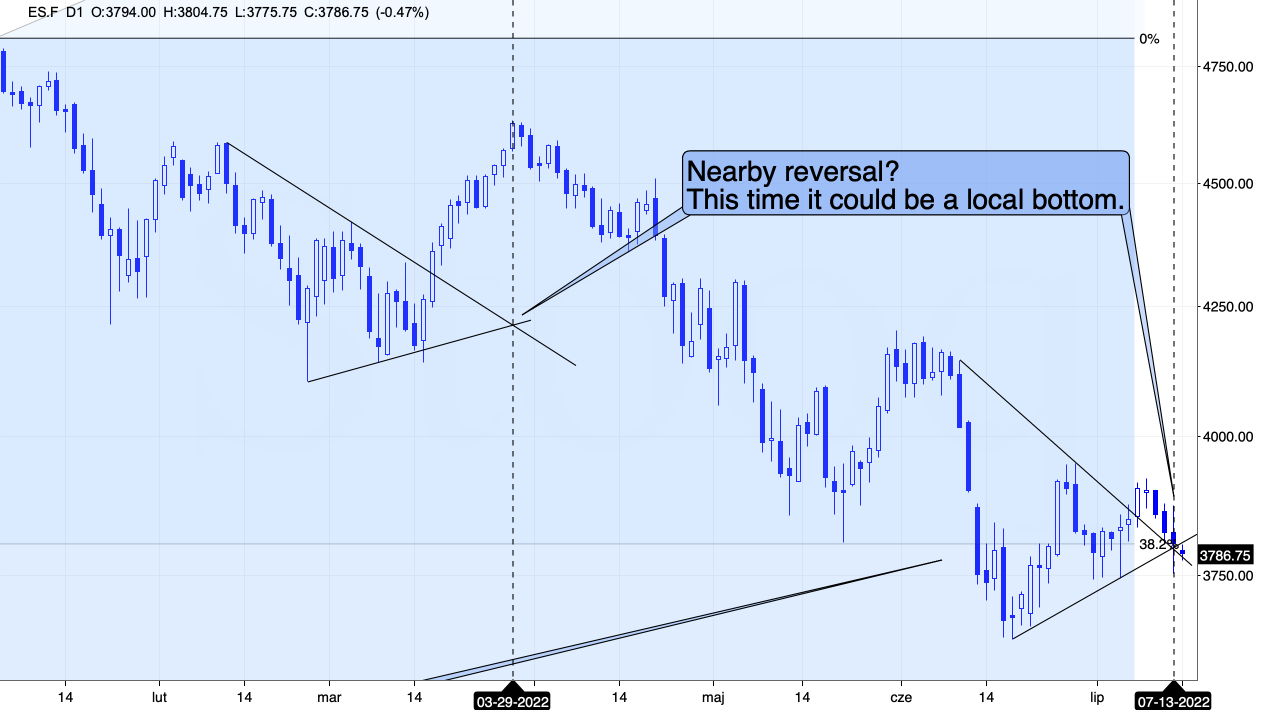
The S&P 500 futures declined substantially, moving very close to their previous July lows (at about 3,750) and then they moved back up. They still ended the day lower, but the reversal was quite profound.
Stock futures are down in today’s pre-market trading but not significantly so, and given the fact that yesterday’s reversal took place at the triangle-vertex-based reversal, today’s move lower is likely to turn into a short-term rally shortly. If it doesn’t happen today, it’s likely to happen soon.
We also see something similar in gold’s pre-market trading, and the implications are just as bullish. Gold futures are down by about $20, but they are well above yesterday’s intraday low of $1,704.50.
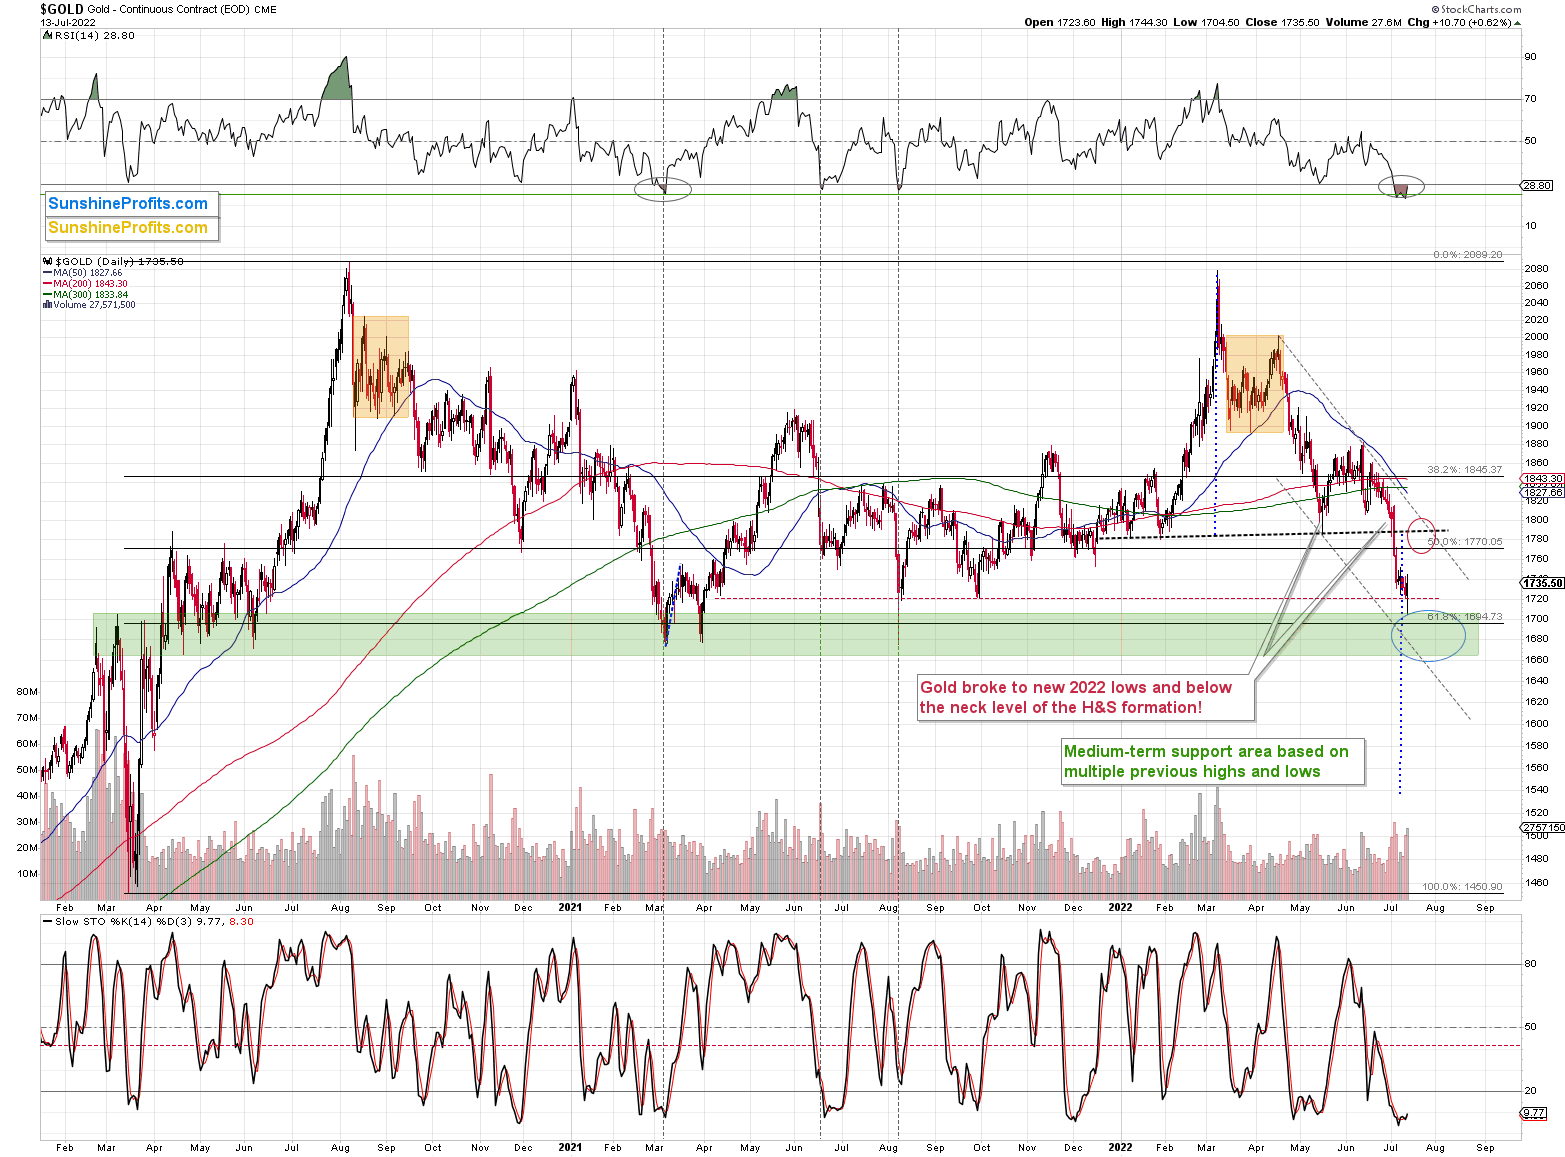
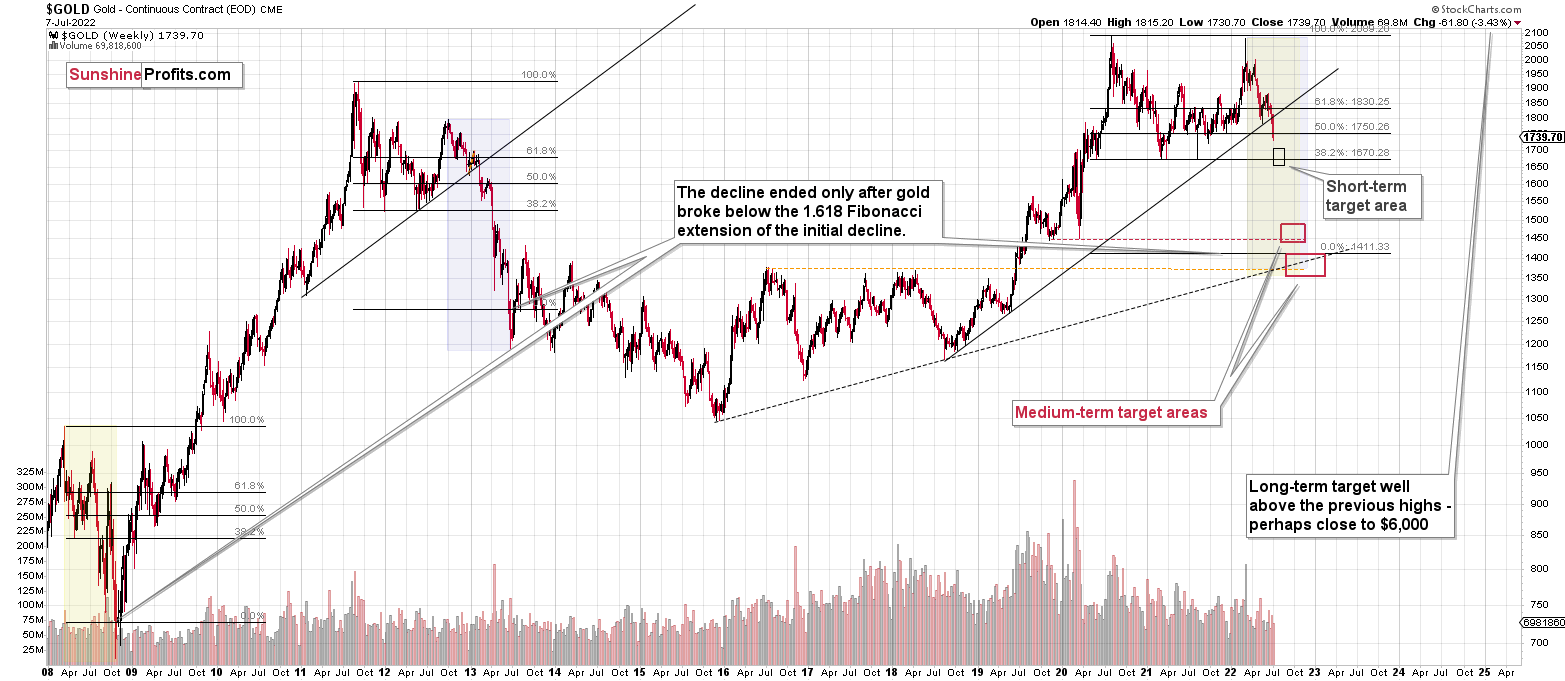
On the above gold chart, you can see that gold just touched the upper border of my original target area for this short-term decline, and then moved back up, closing above the red dashed line. This way, both targets were reached, and we saw a big-volume reversal that confirmed that the short-term trend has just most likely changed.
How high is gold likely to rally from here?
To about $1,770-1,800. That’s where we have several resistance levels, including the neck level of the previously broken head-and-shoulders pattern. The silver price is likely to rally too – in the near term, that is.
Additionally, please note the situation in the RSI in the upper part of the chart. What we saw recently is very similar to what we saw in March 2021, only this time the RSI indicated slightly more oversold conditions.
How high did gold rally back then? Well, it bottomed and kept on rallying for months, but it doesn’t mean that exactly the same thing is likely to happen now. You see, the further price moves from the “signal”, the less likely the price performance is likely to be repeated. So, while the initial several days are quite likely to be similar, the following few weeks might also be similar, but it’s a rather weak indication. The following months might develop completely differently.
Let’s focus on the short-term indications that are most likely to be meaningful.
After bottoming in March 2021, gold moved up rather quickly, and it stopped only after it moved close to the previous lows that provided resistance. That’s exactly what I expect to see this time too. Gold could move visibly higher in the near term, topping close to its resistance levels or between them.
What does the above imply for the gold miners?
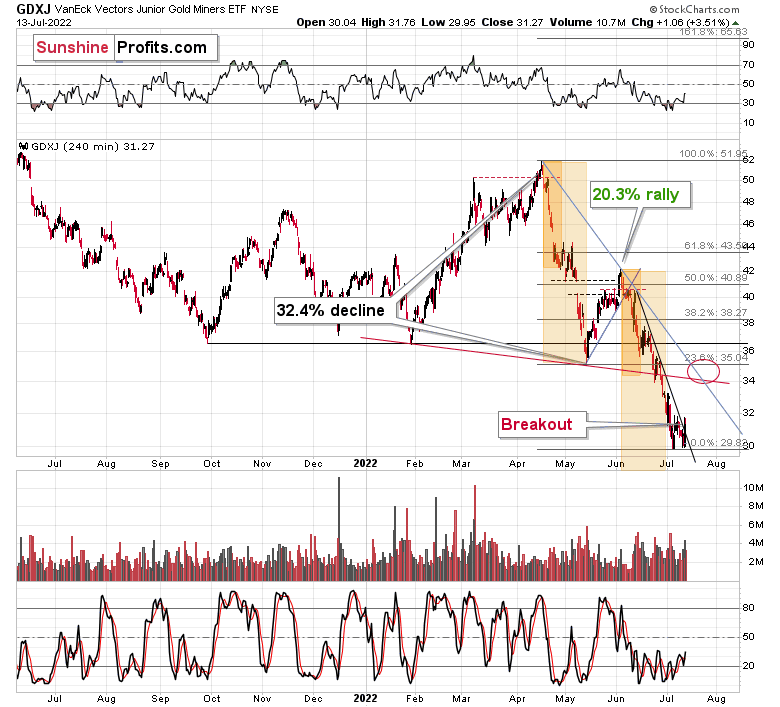
The above-mentioned target for gold is likely to correspond to a target of about $34-35 in the GDXJ ETF. That’s where we have two resistance lines (one of them being the neck level of the previously broken neck level of the head-and-shoulders formation) and the 23.6% Fibonacci retracement.
Please note that in yesterday’s trading, the GDXJ finally moved – and closed – above its declining, short-term resistance line. It’s even clearer as we zoom in.
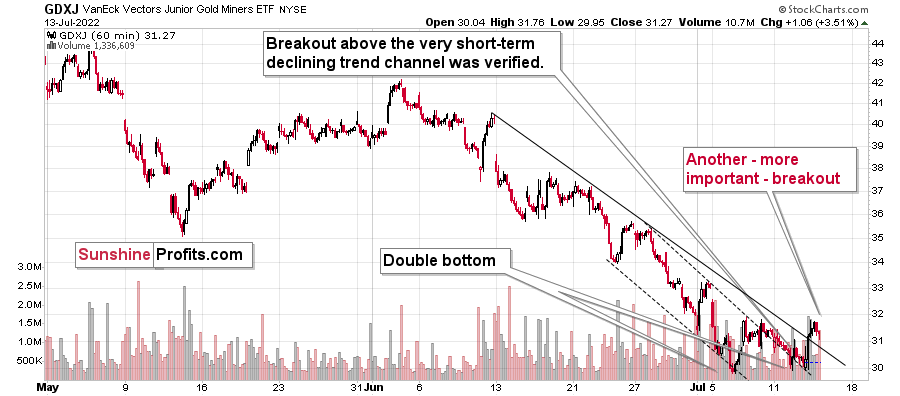
The solid resistance line was broken, and then the GDXJ corrected close to it. That’s similar to what we previously saw with regard to the upper border of the previous trading channel. As such, it’s nothing bearish – it’s a normal thing to see after a breakout.
Interestingly, while gold futures are down by about $20 in today’s pre-market trading, the GDXJ ETF is barely down in today’s London trading.
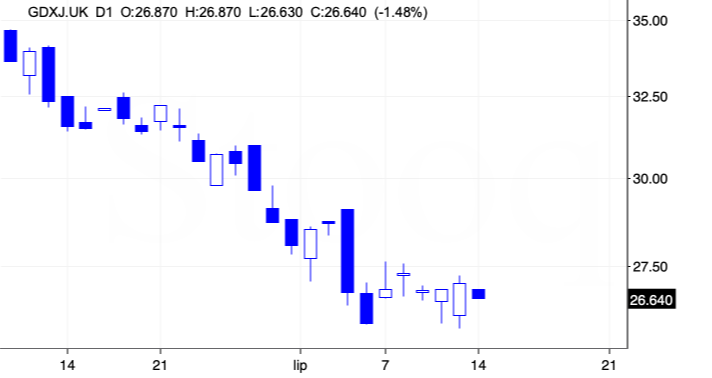
This is a show of strength, and yet another indication that the next short-term move is likely to be to the upside.
Consequently, we see more of the same: while the USDX moved slightly above the recent highs, gold didn’t (thus showing strength relative to the USDX), and junior miners were even stronger than gold. This is a bullish combination for the short term.
Having said that, let’s take a look at the markets from a more fundamental point of view.
Behind the Curve
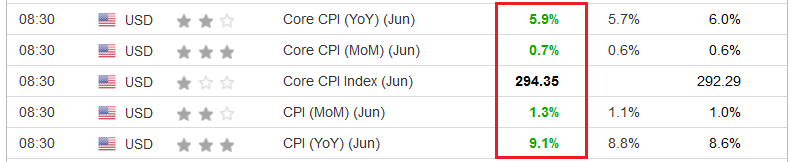
While I warned for many months that the Fed was behind the inflation curve, investors endured another dose of reality on Jul. 13. For example, with the Consumer Price Index (CPI) coming in hot, it was outperformance across the board. For context, the gray figures in the middle column were economists’ consensus estimates.
Please see below:
 Source: Investing.com
However, with investors front-running the print and selling on Monday and Tuesday, I noted prior to the release that a short squeeze could materialize. I wrote:
The CPI hits the wire this morning, and investors have been selling assets in anticipation of another scorching print. However, with market participants known to ‘sell the rumor and buy the news,’ the GDXJ ETF could be a major beneficiary.
Options traders have nearly doubled their euro shorts. As a result, with momentum investors chasing the euro’s collapse rather than anticipating the fundamentals, over-positioning could result in a short-term reversion. Thus, the prospect is bearish for the USD Index and bullish for the GDXJ ETF.
To that point, with the EUR/USD and the GDXJ ETF both rallying after slow starts, the counterintuitive price action unfolded as expected.
Please see below:
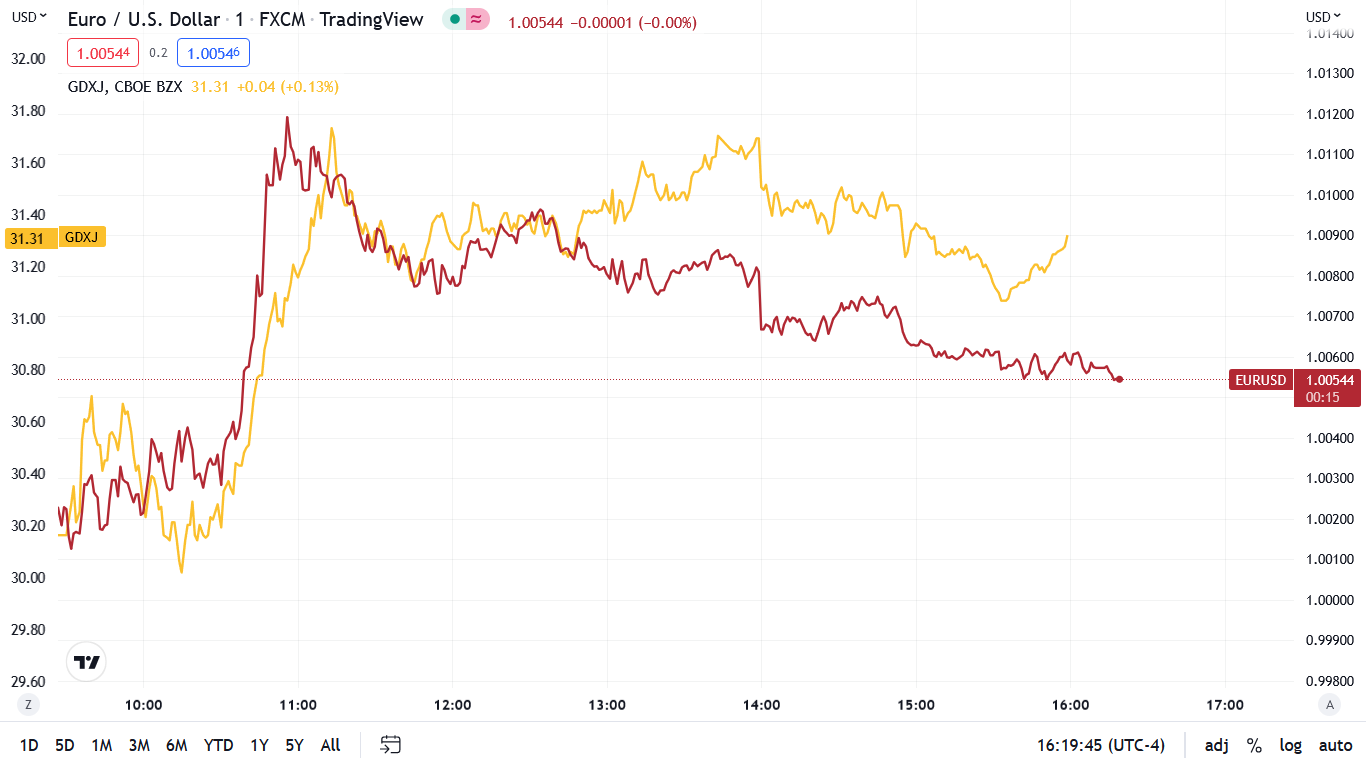
To explain, the red line above tracks the one-minute movement of the EUR/USD, while the gold line above tracks the one-minute movement of the GDXJ ETF. After initial declines at the open, a reversal materialized as the morning progressed. As a result, risk-on sentiment ruled the day.
However, while the short-term setup provides us with a tactical buying opportunity, the PMs’ medium-term fundamentals are headed in the opposite direction. Therefore, our bullish short-term outlook shouldn’t be confused with our bearish medium-term expectations.
Core Issues
While investors spent so much time citing supply-side constraints and their impact on inflation, they missed the elephant in the room. To explain, I wrote on Dec. 23, 2021:
U.S. households have nearly $3.54 trillion in their checking accounts. For context, this is 253% more than Q4 2019 (pre-COVID-19).
The bottom line? While some investors expect a dovish 180 from the Fed, they shouldn’t hold their breath. With U.S. economic growth still resilient and the U.S. consumer in much better shape than some portray, the Fed can raise interest rates without crashing the U.S. economy. As a result, Powell will likely stick to his hawkish script and forge ahead with rate hikes in 2022.
I updated on Mar. 31:
There is a misnomer in the financial markets that inflation is a supply-side phenomenon. In a nutshell: COVID-19 restrictions, labor shortages, and manufacturing disruptions are the reasons for inflation’s reign. As such, when these issues are no longer present, inflation will normalize and the U.S. economy will enjoy a “soft landing.”
However, investors’ faith in the narrative will likely lead to plenty of pain over the medium term. For example, I’ve noted for some time that the U.S. economy remains in a healthy position. With U.S. consumers flush with cash and a red hot labor market helping to bloat their wallets, their propensity to spend keeps economic data elevated....
U.S. households have nearly $3.89 trillion in their checking accounts. For context, this is 288% more than Q4 2019 (pre-COVID-19). As a result, investors misunderstand the amount of demand that’s driving inflation.
Likewise, the core CPI removes the impact of food and energy prices. In a nutshell: Fed officials prefer core metrics (like core PCE) because they disregard volatile items that the FOMC can’t control. However, with the core CPI coming in at 5.9% year-over-year (YoY) versus 5.7% YoY expected, demand-driven inflation is still much broader than investors realize.
For example, I’ve long warned that rent inflation posed a serious threat to the headline CPI. With leading data from Apartment List highlighting how rental prices soared in 2021 and have outpaced their 2018 and 2019 counterparts in 2022, a resilient Shelter CPI was obvious to those of us who were paying attention.
Please see below:
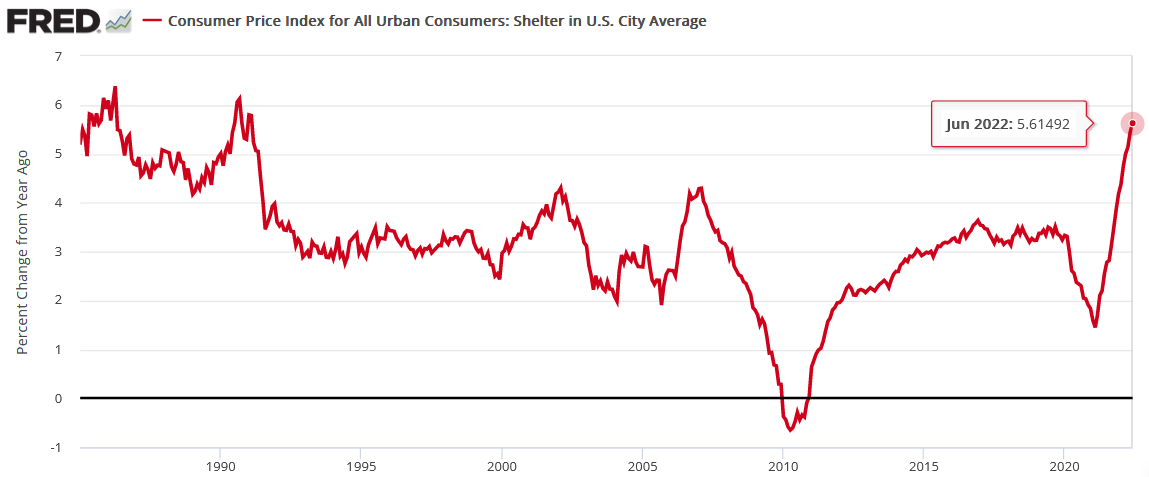
To explain, the red line above tracks the YoY percentage change in the Shelter CPI. If you analyze the right side of the chart, you can see that the metric hit its highest level since 1991. Moreover, the results are still below the findings from Apartment List. As a result, more upside should materialize in the months ahead.
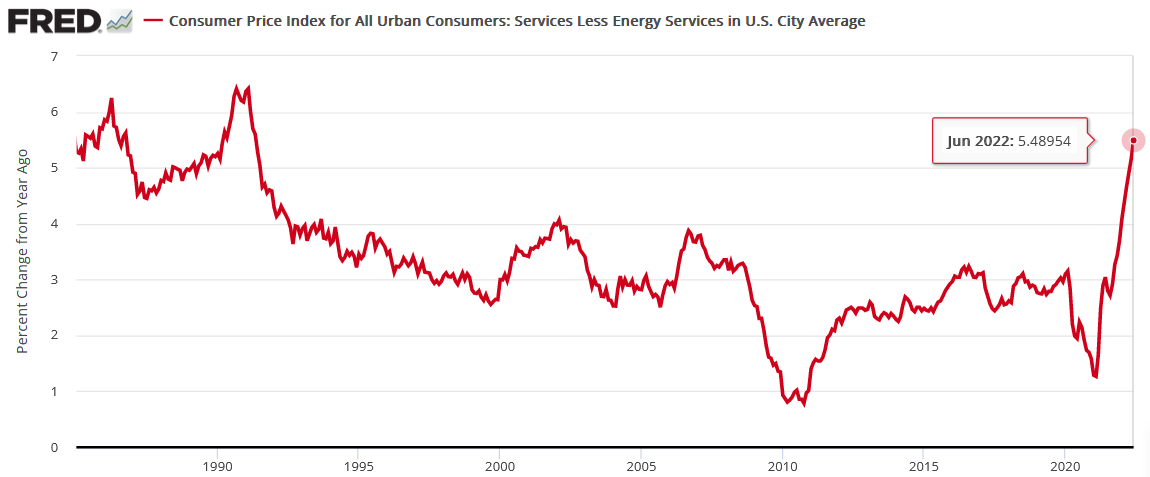
Furthermore, the Services CPI (which excludes the impact of energy) also hit its highest level since 1991. For context, the cohort includes spending on things like barbers, doctors, lawyers, and mechanics, as well as health care, the arts, entertainment, and recreation.
Please see below:
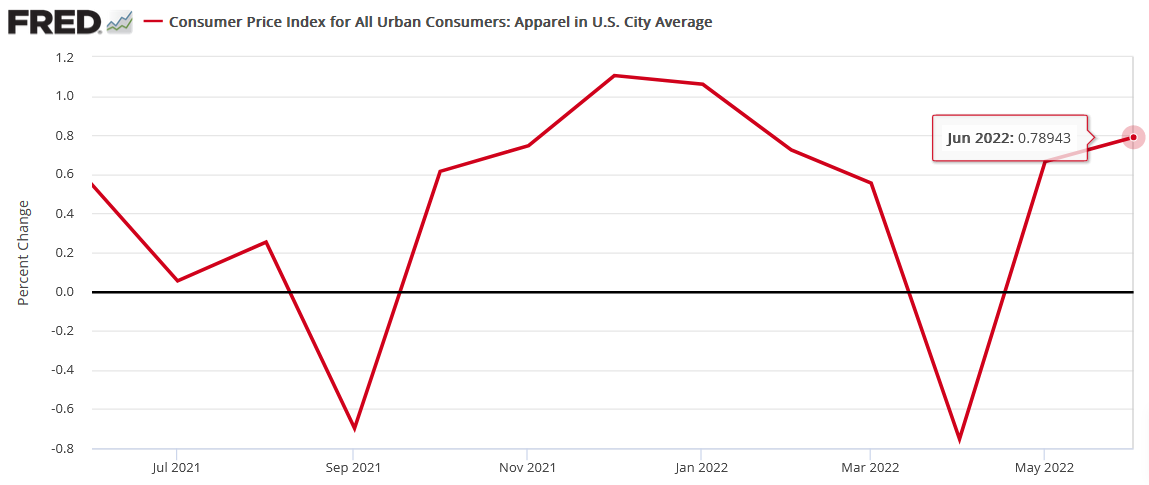
In addition, the Apparel CPI also outperformed. For example, when the metric declined by 0.75% month-over-month (MoM) in April, the consensus assumed that inflation had peaked and that only supply-side factors were left. However, the Apparel CPI increased by 0.67% MoM in May and upped that to 0.79% MoM in June. Therefore, Americans paid up to refresh their summer wardrobes.
Please see below:
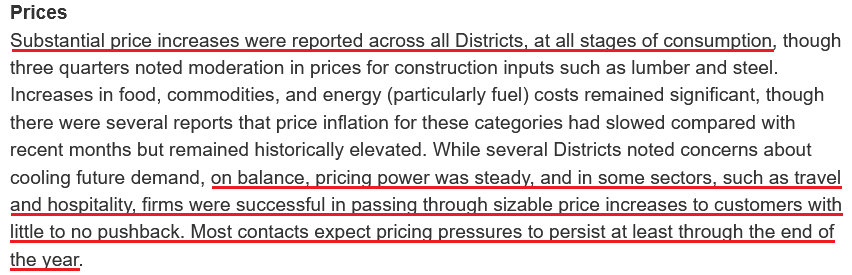
As further evidence, the Fed released its latest Beige Book on Jul. 13. Moreover, while the growth outlook was mixed, the report revealed:
“Most Districts continued to report that employment rose at a modest to moderate pace and conditions remained tight overall. However, nearly all Districts noted modest improvements in labor availability amid weaker demand for workers, particularly among manufacturing and construction contacts. Most Districts continued to report wage growth.”
More importantly:
 Source: U.S. Fed
Thus, with travel and hospitality companies passing on “sizable price increases to customers with little to no pushback,” does it seem like demand destruction has unfolded? In reality, the Fed and investors underestimated the demand side of the inflation equation, and the consequences have come to bear. As such, what I wrote on Apr. 6 should continue to prove prescient in the months ahead:
Please remember that the Fed needs to slow the U.S. economy to calm inflation, and rising asset prices are mutually exclusive to this goal. Therefore, officials should keep hammering the financial markets until investors finally get the message.
Moreover, with the Fed in inflation-fighting mode and reformed doves warning that the U.S. economy “could teeter” as the drama unfolds, the reality is that there is no easy solution to the Fed’s problem. To calm inflation, it has to kill demand. As that occurs, investors should suffer a severe crisis of confidence.
The Canary: Part 3
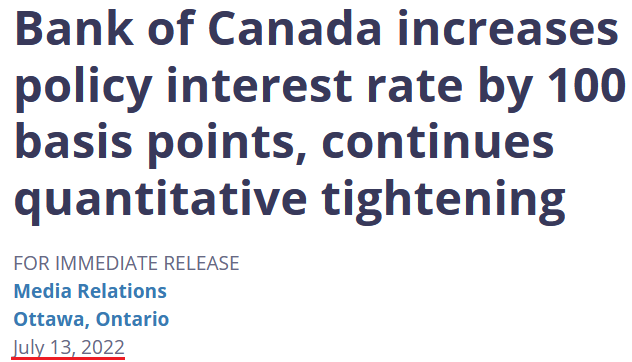
While the CPI release garnered all of investors’ attention, the Bank of Canada (BoC) dropped a hawkish bomb on Jul. 13.
Please see below:
 Source: BoC
Thus, while the FOMC one-upped the BoC and hiked interest rates by 75 basis points in June, the BoC one-upped the FOMC and hiked interest rates by 1% in July. Remember, due to the geographical proximity and the fact that 75% or more of Canadian exports are sent to the U.S., the two regions often have similar economic and monetary policy outcomes. For context, I wrote on Apr. 14:
The BoC announced a 50 basis point rate hike on Apr. 13. With the Fed likely to follow suit in May, the domestic fundamental environment confronting the PMs couldn’t be more bearish.
Moreover, BoC Governor Tiff Macklem (Canada's Jerome Powell) said: "We are committed to using our policy interest rate to return inflation to target and will do so forcefully if needed."
Furthermore, while he added that the BoC could "pause our tightening" if inflation subsides, he cautioned that "we may need to take rates modestly above neutral for a period to bring demand and supply back into balance and inflation back to target."
However, with the latter much more likely than the former, the BoC's decision is likely a preview of what the Fed should deliver in the months ahead.
Well, what a difference three months makes. The BoC’s monetary policy statement read:
“Further excess demand has built up in the Canadian economy. Labour markets are tight with a record low unemployment rate, widespread labour shortages, and increasing wage pressures. With strong demand, businesses are passing on higher input and labour costs by raising prices. Consumption is robust, led by a rebound in spending on hard-to-distance services.”
“With the economy clearly in excess demand, inflation high and broadening, and more businesses and consumers expecting high inflation to persist for longer, the Governing Council decided to front-load the path to higher interest rates by raising the policy rate by 100 basis points today. The Governing Council continues to judge that interest rates will need to rise further, and the pace of increases will be guided by the Bank’s ongoing assessment of the economy and inflation.”
As a result, the inflationary light bulb has finally come on in North America. The BoC admitted:
“Inflation in Canada is higher and more persistent than the Bank expected in its April Monetary Policy Report (MPR), and will likely remain around 8% in the next few months…. More than half of the components that make up the CPI are now rising by more than 5%. With this broadening of price pressures, the Bank’s core measures of inflation have moved up to between 3.9% and 5.4%.”
Please see below:
 Source: BoC
Thus, while I warned that the supply-side argument for inflation was an uninformed excuse, the Fed and the BoC are realizing that unprecedented fiscal stimulus created too much demand. As a result, reversing the imbalance should result in plenty of pain for financial assets over the medium term.
The Bottom Line
Harsh fundamental realities confront the financial markets over the next several months. With inflation unrelenting, central banks' misunderstanding of the drivers of inflation have created an environment where rate hikes and quantitative tightening (QT) must occur at a rapid pace. If not, they set themselves up for an even larger collapse down the road. Therefore, a rate-hike-induced recession should materialize in the months ahead.
In contrast, technical analysis and sentiment indicators support a short-term upswing for the GDXJ ETF. Moreover, since the former are much better predictors of the near-term price action than the fundamentals, we can attempt to profit in the interim and re-enter our short positions at higher prices in the coming weeks.
In conclusion, the PMs rallied on Jul. 13, and the GDXJ ETF was a material outperformer. Moreover, with further upside likely, higher prices remain the path of least resistance. As such, while the medium-term outlook is bearish, the short-term outlook is much more optimistic.
Overview of the Upcoming Part of the Decline
- It seems to me that the precious metals market is about to correct (rally) – similarly to what we saw in 2013 right before the April slide. And then – once the corrective rally is complete – I expect a huge decline to follow.
- If we see a situation where miners slide in a meaningful and volatile way while silver doesn’t (it just declines moderately), I plan to – once again – switch from short positions in miners to short positions in silver. At this time, it’s too early to say at what price levels this could take place and if we get this kind of opportunity at all – perhaps with gold prices close to $1,600.
- If we see a situation where miners slide in a meaningful and volatile way while silver doesn’t (it just declines moderately), I plan to – once again – switch from short positions in miners to short positions in silver. At this time, it’s too early to say at what price levels this could take place and if we get this kind of opportunity at all – perhaps with gold prices close to $1,600.
- I plan to exit all remaining short positions once gold shows substantial strength relative to the USD Index while the latter is still rallying. This may be the case with gold close to $1,400. I expect silver to fall the hardest in the final part of the move. This moment (when gold performs very strongly against the rallying USD and miners are strong relative to gold after its substantial decline) is likely to be the best entry point for long-term investments, in my view. This can also happen with gold close to $1,400, but at the moment it’s too early to say with certainty.
- The above is based on the information available today, and it might change in the following days/weeks.
You will find my general overview of the outlook for gold on the chart below:
Please note that the above timing details are relatively broad and “for general overview only” – so that you know more or less what I think and how volatile I think the moves are likely to be – on an approximate basis. These time targets are not binding or clear enough for me to think that they should be used for purchasing options, warrants, or similar instruments.
Letters to the Editor
Q: Is the GDXU product considered suitable to take advantage of rebounds?Thanks.
A: The issue of “suitability” is a subjective one. So, the only possible reply here would be through another question – suitable to whom? Then the person replying (investment adviser) would need to get to know the asker, their investment goals, risk tolerance, etc., in order to tell them if a given instrument (with a specific trade in mind) was suitable for them.
I’m not providing investment advice, so it’s impossible for me to reply to this question.
It’s a 3x leveraged instrument based on GDX and GDXJ, and in my opinion, this might be too much leverage for beginning investors (who tend to put too much money into a single trade, anyway). In short, if one needs to ask if it’s suitable or how to calculate targets for it, then it suggests that it’s probably not a good choice. That’s also why I stopped publishing targets for GDXD and GDXU (I’m not providing them when requested individually, either) – those who are actually positioned to use them shouldn’t need those details as they can easily figure it out on their own. They might be dangerous to those who are not very experienced.
I know this is not a “yes” or “no” reply that might be expected here, but providing one is not possible for me without providing investment advice, which is something that I can’t and won’t do.
Summary
Summing up, it seems that while the medium-term trend in the precious metals sector remains down, we are likely to see a corrective upswing soon. Based on the confirmations that we saw recently, the short-term outlook is bullish.
It seems likely that the profits that we earned from the last couple of trades will increase even further shortly.
After the final sell-off (that takes gold to about $1,350-$1,500), I expect the precious metals to rally significantly. The final part of the decline might take as little as 1-5 weeks, so it's important to stay alert to any changes.
As always, we'll keep you – our subscribers – informed.
To summarize:
Trading capital (supplementary part of the portfolio; our opinion): Full speculative long positions (100% of the full position) in junior mining stocks are justified from the risk to reward point of view with the following binding exit profit-take price levels:
Mining stocks (price levels for the GDXJ ETF): binding profit-take exit price: $33.87; stop-loss: none (the volatility is too big to justify a stop-loss order in case of this particular trade)
Alternatively, if one seeks leverage, we’re providing the binding profit-take levels for the JNUG (2x leveraged). The binding profit-take level for the JNUG: $36.78; stop-loss for the JNUG: none (the volatility is too big to justify a SL order in case of this particular trade).
For-your-information targets (our opinion; we continue to think that mining stocks are the preferred way of taking advantage of the upcoming price move, but if for whatever reason one wants / has to use silver or gold for this trade, we are providing the details anyway.):
Silver futures upside profit-take exit price: $20.28
SLV profit-take exit price: $18.78
AGQ profit-take exit price: $24.57
Gold futures upside profit-take exit price: $1,776
HGU.TO – alternative (Canadian) 2x leveraged gold stocks ETF – the upside profit-take exit price: $13.46
HZU.TO – alternative (Canadian) 2x leveraged silver ETF – the upside profit-take exit price: $9.18
Long-term capital (core part of the portfolio; our opinion): No positions (in other words: cash)
Insurance capital (core part of the portfolio; our opinion): Full position
Whether you’ve already subscribed or not, we encourage you to find out how to make the most of our alerts and read our replies to the most common alert-and-gold-trading-related-questions.
Please note that we describe the situation for the day that the alert is posted in the trading section. In other words, if we are writing about a speculative position, it means that it is up-to-date on the day it was posted. We are also featuring the initial target prices to decide whether keeping a position on a given day is in tune with your approach (some moves are too small for medium-term traders, and some might appear too big for day-traders).
Additionally, you might want to read why our stop-loss orders are usually relatively far from the current price.
Please note that a full position doesn't mean using all of the capital for a given trade. You will find details on our thoughts on gold portfolio structuring in the Key Insights section on our website.
As a reminder - "initial target price" means exactly that - an "initial" one. It's not a price level at which we suggest closing positions. If this becomes the case (as it did in the previous trade), we will refer to these levels as levels of exit orders (exactly as we've done previously). Stop-loss levels, however, are naturally not "initial", but something that, in our opinion, might be entered as an order.
Since it is impossible to synchronize target prices and stop-loss levels for all the ETFs and ETNs with the main markets that we provide these levels for (gold, silver and mining stocks - the GDX ETF), the stop-loss levels and target prices for other ETNs and ETF (among other: UGL, GLL, AGQ, ZSL, NUGT, DUST, JNUG, JDST) are provided as supplementary, and not as "final". This means that if a stop-loss or a target level is reached for any of the "additional instruments" (GLL for instance), but not for the "main instrument" (gold in this case), we will view positions in both gold and GLL as still open and the stop-loss for GLL would have to be moved lower. On the other hand, if gold moves to a stop-loss level but GLL doesn't, then we will view both positions (in gold and GLL) as closed. In other words, since it's not possible to be 100% certain that each related instrument moves to a given level when the underlying instrument does, we can't provide levels that would be binding. The levels that we do provide are our best estimate of the levels that will correspond to the levels in the underlying assets, but it will be the underlying assets that one will need to focus on regarding the signs pointing to closing a given position or keeping it open. We might adjust the levels in the "additional instruments" without adjusting the levels in the "main instruments", which will simply mean that we have improved our estimation of these levels, not that we changed our outlook on the markets. We are already working on a tool that would update these levels daily for the most popular ETFs, ETNs and individual mining stocks.
Our preferred ways to invest in and to trade gold along with the reasoning can be found in the how to buy gold section. Furthermore, our preferred ETFs and ETNs can be found in our Gold & Silver ETF Ranking.
As a reminder, Gold & Silver Trading Alerts are posted before or on each trading day (we usually post them before the opening bell, but we don't promise doing that each day). If there's anything urgent, we will send you an additional small alert before posting the main one.
Thank you.
Przemyslaw Radomski, CFA
Founder, Editor-in-chief

