

Briefly: in our opinion, full (100% of the regular position size) speculative long positions in junior mining stocks are justified from the risk/reward point of view at the moment of publishing this Alert.
The precious metals sector moved a bit lower yesterday, and that was bullish because it “should have” moved much lower based on the fact that the USD Index just soared to new highs.
Let’s start with the details.
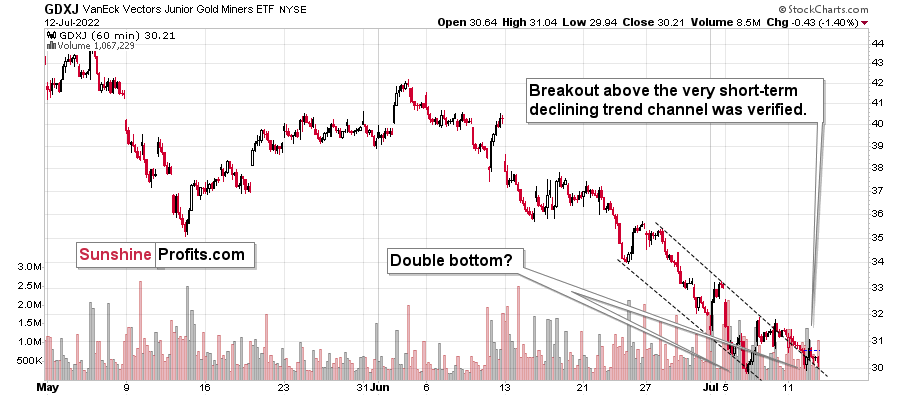
The GDXJ ended the day lower, but it didn’t move to new lows, and it didn’t move back below its previous resistance in the form of the upper border of the declining trend channel. Instead, it verified this border as support.
Consequently, it appears that the GDXJ formed a double bottom here (or it’s still forming one), and it’s even more likely because miners actually showed strength yesterday, when compared to what gold did.
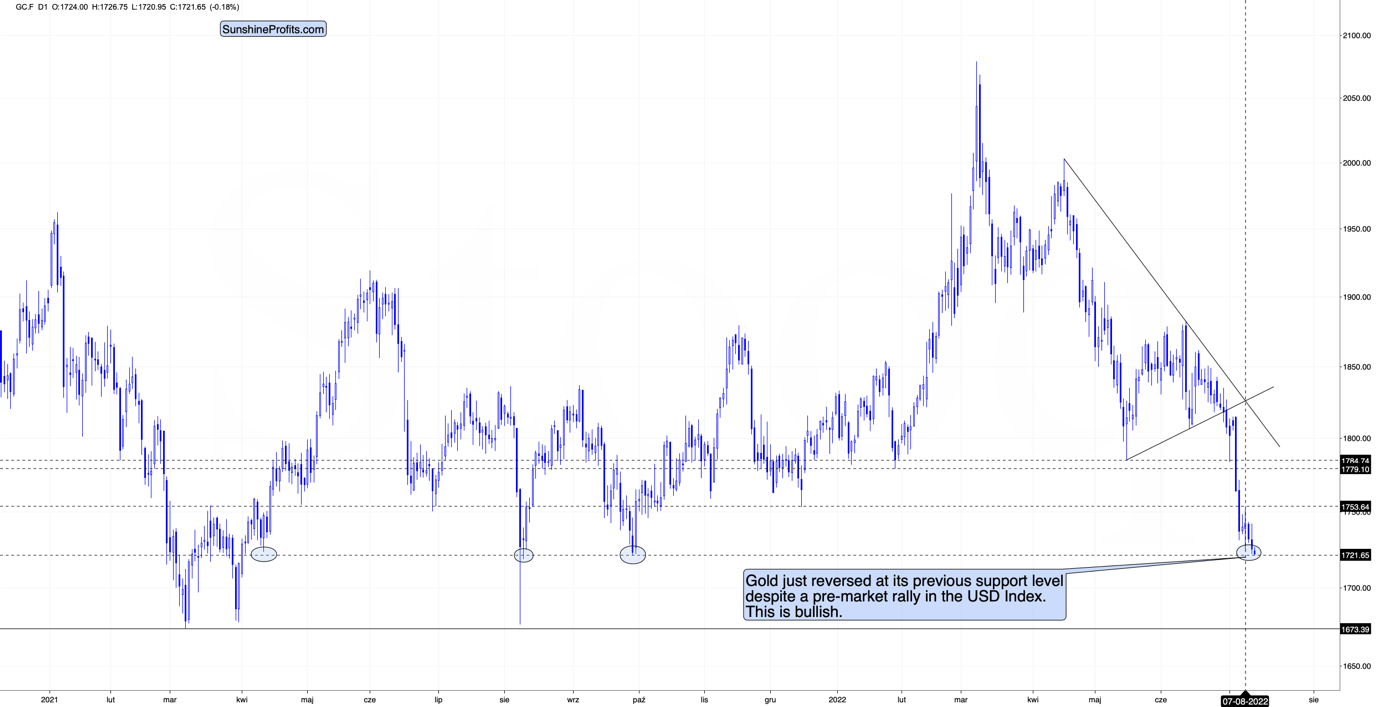
Namely, gold moved to new lows yesterday. It wasn’t a huge move lower, but still – gold moved to new lows while junior miners didn’t.
To clarify, despite this small move lower, gold didn’t break below the support (dashed line) provided by the previous lows (marked with ellipses on the above chart), which means that it’s still likely to rally from those levels, similarly to how it rallied back in 2013.
While junior miners were strong relative to gold, gold was strong relative to the indication that came from the USD Index.
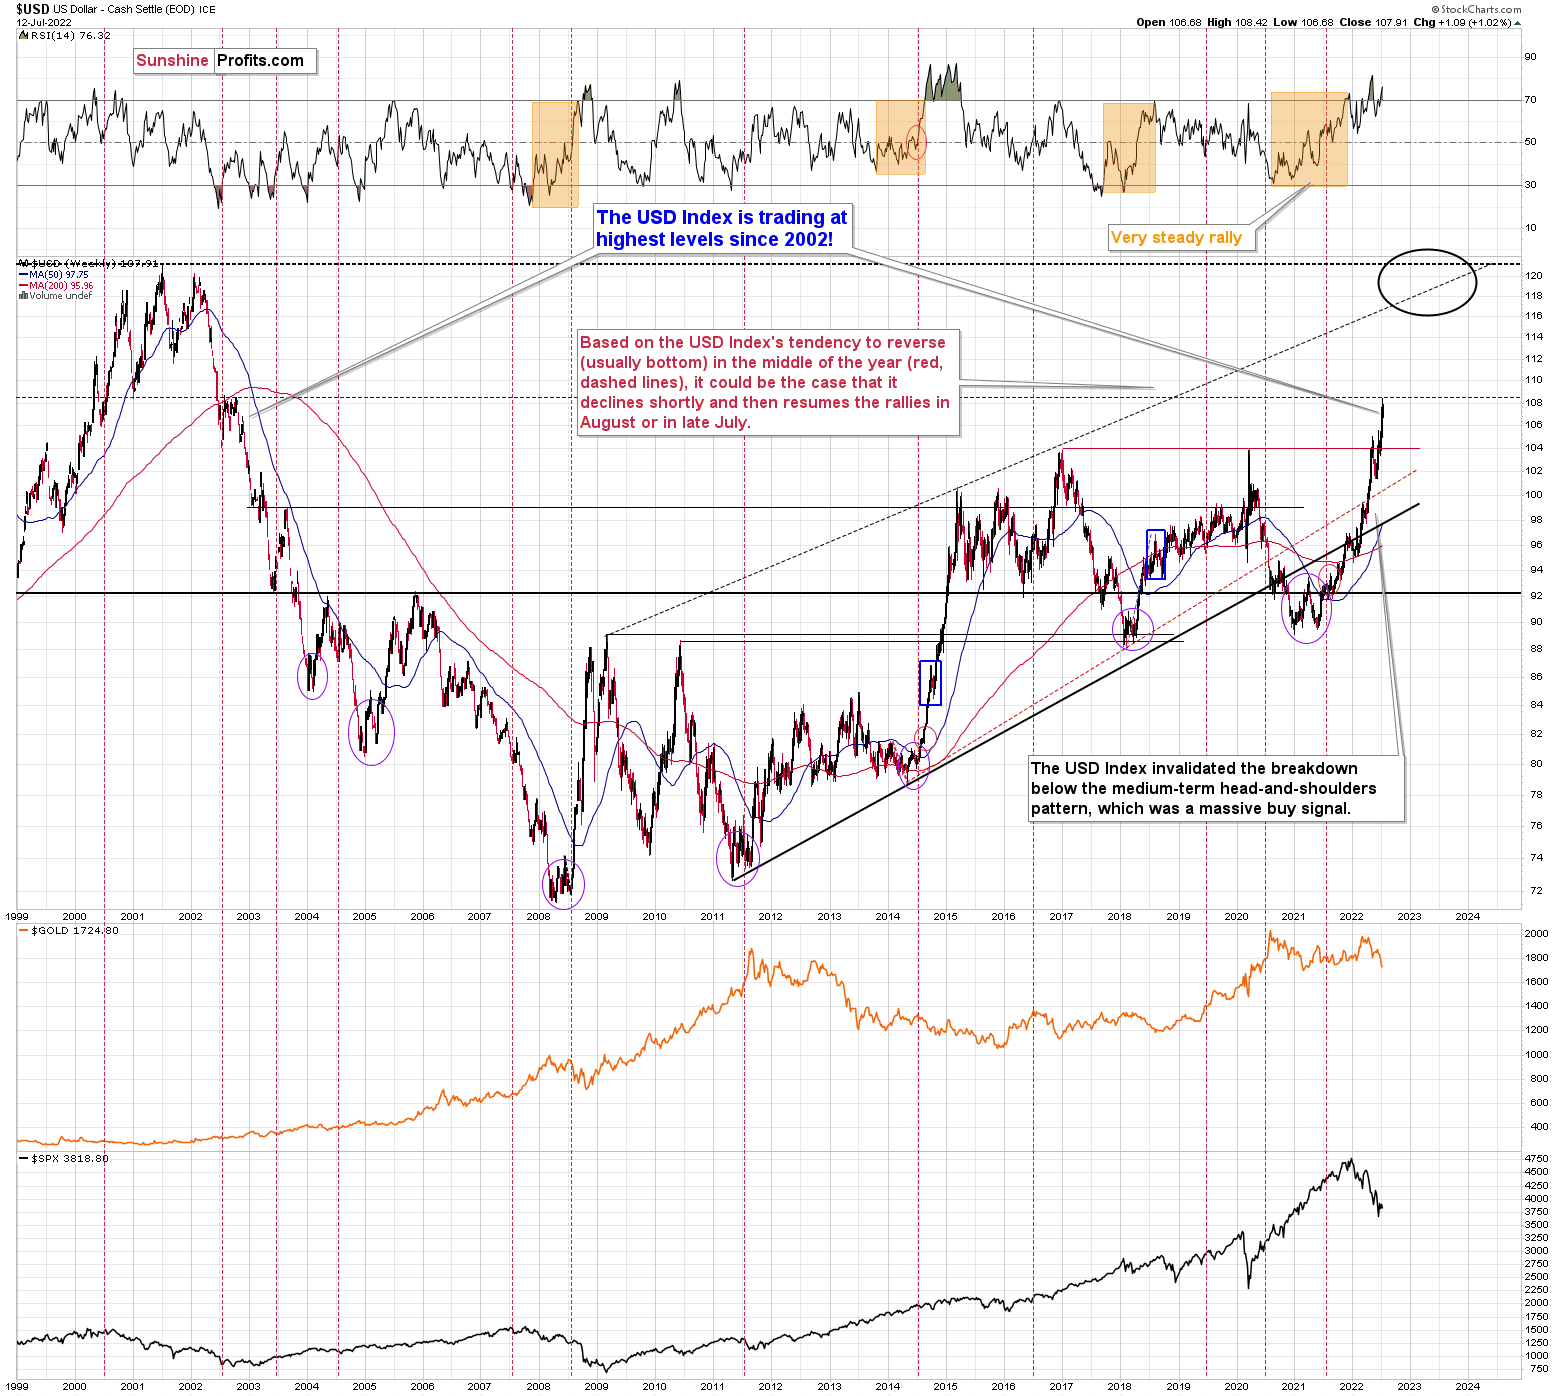
The USDX just rallied profoundly, and it moved to new highs, reaching my medium-term target at approximately its late-2002 highs (the blue, dashed line).
Given the size of the upswing in the USDX, gold should have declined more visibly (and juniors even more so), and they didn’t, which is bullish – simple as that.
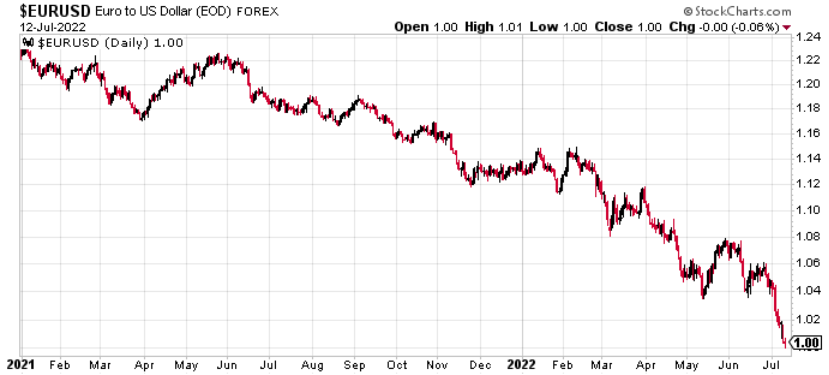
The profound support level was also reached by the EUR/USD currency pair. On the forex market, it bottomed at 1.00003, yesterday.
It’s the most important round number of them all: 1.
This means that the U.S. dollar was just about as valuable (99.997%) as the euro!
This is a headline shocker in every sense, and it’s very likely that it will trigger fresh buyers. “Enough is enough,” they might say, not wanting to believe that the euro could be cheaper than the buck. Of course it can, but it’s unlikely that this level (and buyers) will allow that without a fight.
This fight is likely to trigger at least a brief reversal and a rally.
This, in turn, is likely to trigger a decline in the USD Index, which would be in perfect tune with what’s likely based on the USD’s long-term chart.
How low could the USD Index correct? Perhaps to the previously broken highs, thus verifying them one last time before soaring again. These highs are at about 104. Please note that a decline there would be a mirror image of what we saw in 2002, which adds extra credibility to this scenario (it doesn’t make it certain, though).
Would a 4-index point decline in the USD Index be likely to trigger a rally in gold and junior mining stocks? Yes. And as far as the latter are concerned, if the general stock market moves higher, the rally in them could be quite visible.
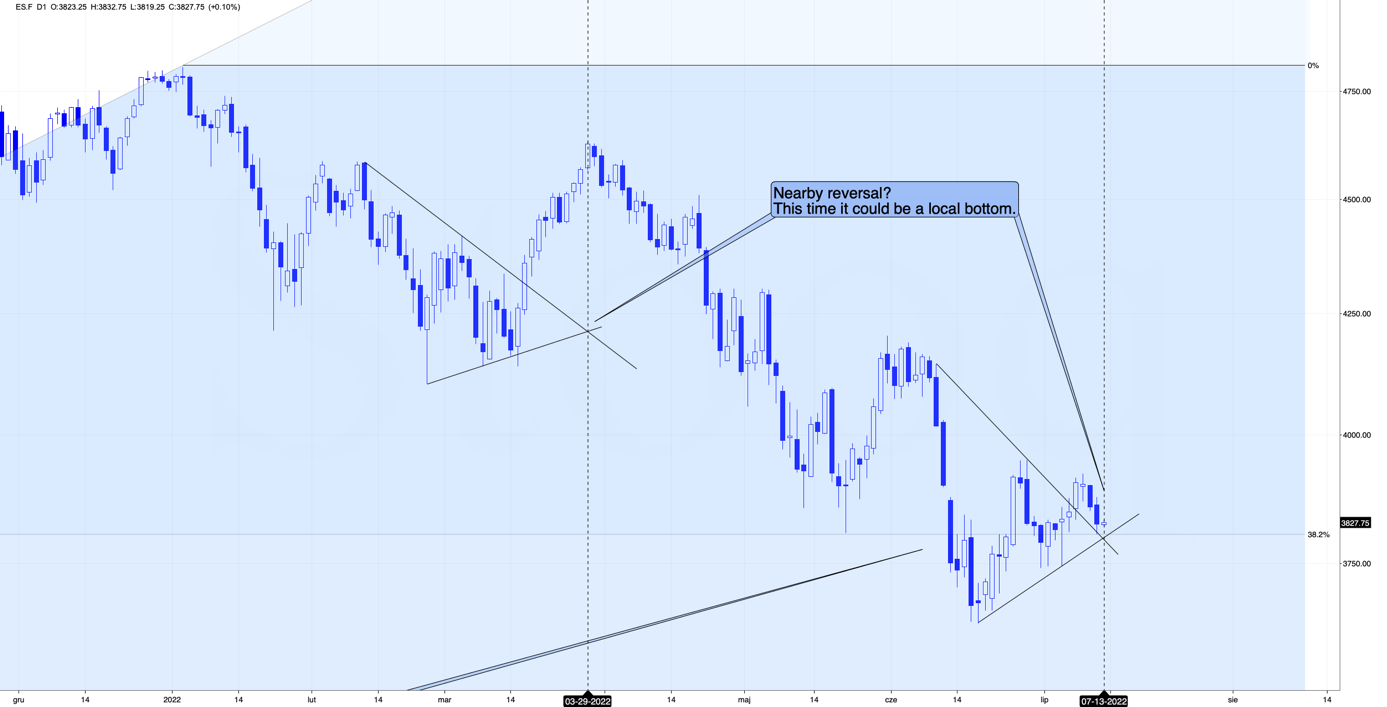
Interestingly, the stock market (the above chart features the S&P 500 futures) is right above the combination of short-term support levels.
What’s even more interesting is that we have a triangle-vertex-based reversal there today. To show that this technique is useful also in the case of the S&P 500 futures, I marked the previous similar triangle and the reversal that it triggered. Back then it was a local top, but since we’re seeing declines now, it’s much more likely that the reversal will actually be a short-term bottom.
It could be the case that markets rally based on today’s CPI statistics, or that they decline first, reverse, and then rally. Either way, today’s CPI numbers release corresponds quite well to the technical indication that we have about today (that we’re likely to see a reversal).
All in all, this means that junior miners are likely to rally either right away or soon.
Of course, as always, we’ll keep you – our subscribers – informed.
Having said that, let’s take a look at the markets from a more fundamental point of view.
Gauging Sentiment
With our highly profitable short position in the GDXJ ETF now converted into a long position, a selling reprieve across Wall Street could help elicit a short-term bounce. For example, the Consumer Price Index (CPI) hit the wire this morning, and investors have been selling assets in anticipation of another scorching print. However, with market participants known to ‘sell the rumor and buy the news,’ the GDXJ ETF could be a major beneficiary.
To explain, the euro collapsed to parity with the U.S. dollar on Jul. 12. Moreover, while I’ve been bearish on the EUR/USD for many months, the drawdown highlights how you can’t run from fundamental reality.
Please see below:
For context, I wrote on Mar. 12, 2021:
If you haven’t noticed, I spend a lot of time analyzing the EUR/USD because the currency pair accounts for nearly 58% of the movement in the USD Index. And due to Europe’s economic underperformance and the relative outprinting by the ECB, a sharp rerating of the EUR/USD could be the engine that drives the USD Index back above 94.5.
For some time, I’ve warned that the ECB’s bond-buying program was likely to accelerate. On Jan. 22, I wrote:
The ECB decreased its bond purchases toward the end of December 2020. Then, once January hit (2021), it was back to business as usual. As a result, the ECB’s attempt to scale back its asset purchases was (and will be) short-lived. And as the economic conditions worsen, the money printer will be working overtime for the foreseeable future.
Thus, while the Fed has run off six rate hikes (25 basis point increments) and begun selling assets on its balance sheet (QT), the ECB has done nothing. Therefore, the EUR/USD’s plight unfolded as expected.
However, with euro negativity now at extreme levels, investors that were bullish on the currency pair – and forecasting 1.30 – are now bearish. Thus, a short-covering rally in the EUR/USD could help uplift the GDXJ ETF.
Please see below:
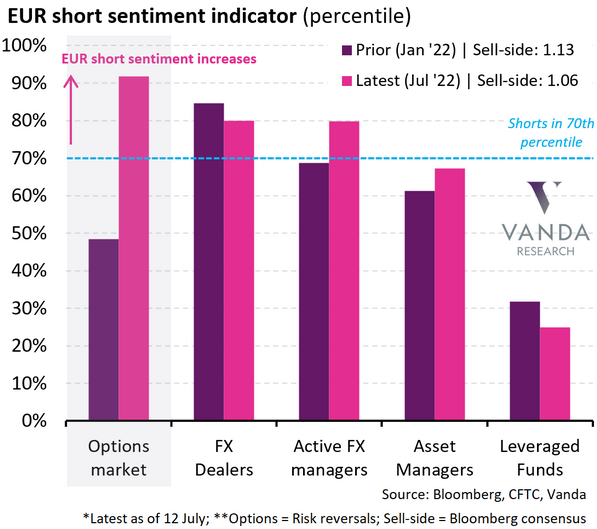
To explain, the purple and pink bars above track the expectations/positioning of various market participants in January 2022 and now. If you analyze the changes, you can see that three of the five cohorts (pink bars) are more short the euro now than in January.
Furthermore, the pink bar furthest to the left highlights how options traders have nearly doubled their euro shorts. As a result, with momentum investors chasing the euro’s collapse rather than anticipating the fundamentals, over-positioning could result in a short-term reversion. Thus, the prospect is bearish for the USD Index and bullish for the GDXJ ETF.
Second, hedge funds and speculative futures traders are all-in on a CPI sell-off.
Please see below:
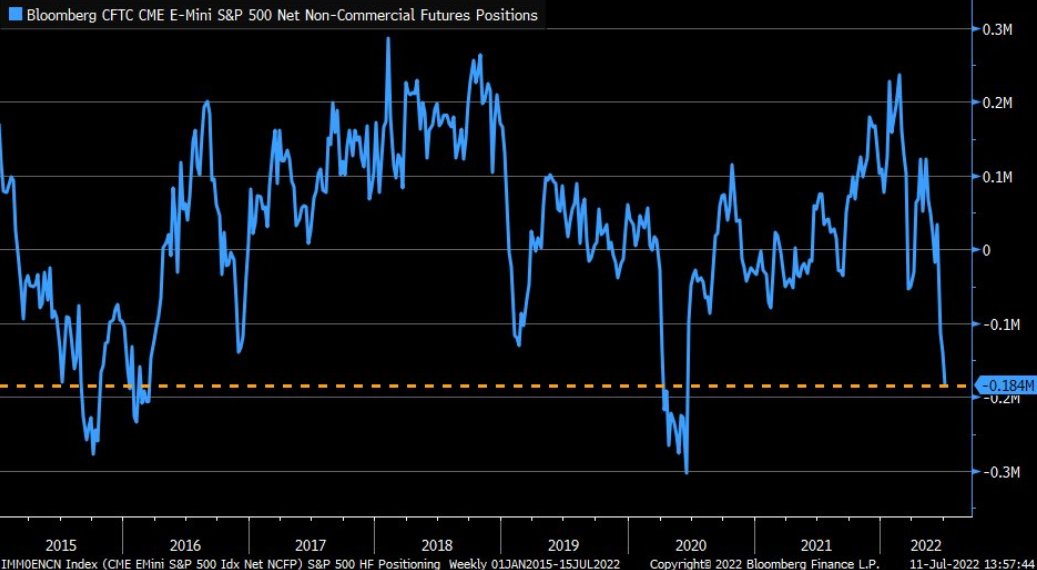
To explain, the blue line above tracks non-commercial traders’ (based on the CoT report) net E-Mini S&P 500 futures positioning. If you analyze the right side of the chart, you can see that net shorts have ballooned to their highest level since the COVID-19 crash. Likewise, the current reading has surpassed the 2018/2019 sell-off but remains below the 2015/2016 growth scare.
As such, with investors heavily positioned for a risk-off outcome, a bout of short-covering may spur a relief rally across Wall Street. Moreover, with the GDXJ ETF collapsing recently, the junior miners should benefit from a potential sentiment shift.
For context, our expectation for a short-term rally doesn’t change the medium-term thesis: the PMs are likely far from their final bottoms, as is the S&P 500. However, asset prices don’t move in a straight line, and bear market rallies are born out of over-positioning. Thus, the conditions should be ripe for a short-term reversal.
The Ominous Months Ahead
Since technical analysis and sentiment are much more prescient in predicting short-term moves, they're better gauges of near-term price action than the fundamentals. However, while it took time for the EUR/USD to reflect its fundamental value, the PMs and the S&P 500 should suffer similar re-ratings as the Fed's rate hike cycle continues.
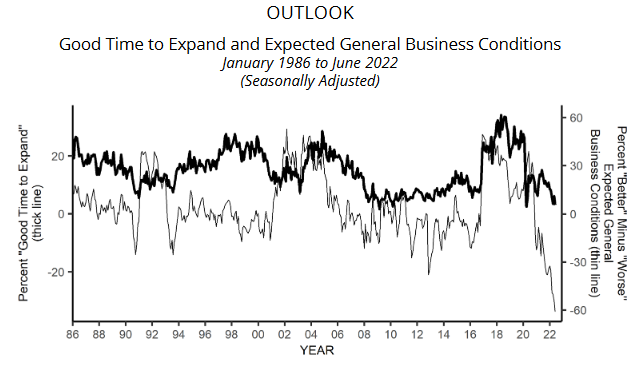
For example, the NFIB released its Small Business Optimism Index on Jul. 12. The headline index declined from 93.1 in May to 89.5 in June. The report revealed:
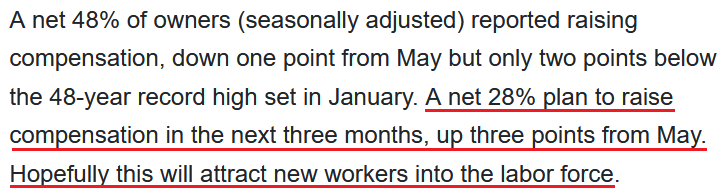
“Small business owners expecting better business conditions over the next six months decreased seven points to a net negative 61%, the lowest level recorded in the 48-year survey. Expectations for better conditions have worsened every month this year.”
Please see below:
 Source: NFIB
To explain, the gray line above highlights how inflation has rattled U.S. small businesses. If you analyze the right side of the chart, you can see that the gray line has plunged to an all-time low. Therefore, recession fears are rampant on Main Street.
However, I noted previously that the NFIB’s Small Business Jobs Report (released on Jul. 7) was bullish for wage inflation.
Please see below:
 Source: NFIB
Moreover, the NFIB’s Jul. 12 report revealed:
“Inflation continues to be a top problem for small businesses with 34% of owners reporting it was their single most important problem in operating their business, an increase of six points from May and the highest level since quarter four in 1980.”
Thus, while six-month sentiment has fallen off a cliff, the overall report was profoundly bullish for Fed policy. For context, the U.S. will likely enter a real (not technical) recession as the Fed attempts to rein in inflation. However, the current economic backdrop is far from dreadful.
Yes, activity has slowed, but that’s expected when the Fed hikes interest rates six times. Furthermore, with small businesses’ current activity contrasting their expectations, the Fed should focus more on the former than the latter when conducting monetary policy.
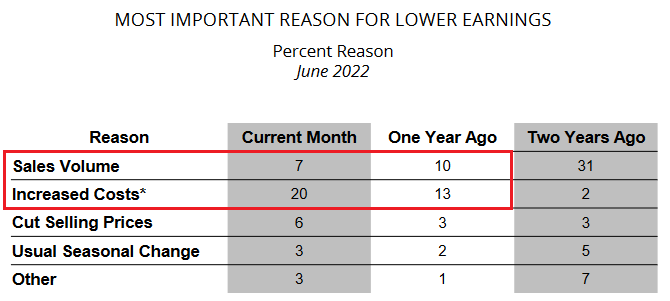
For example, only 7% of small business owners cited depressed sales volume as the reason for lower earnings. Moreover, the figure was three points lower than the 10% recorded in June 2021. Conversely, 20% of small business owners cited increased costs as the driver of lower earnings, an increase of seven points from June 2021.
As a result, the gloomy outlook on Main Street is a function of unanchored inflation, not evaporating demand.
Please see below:
 Source: NFIB
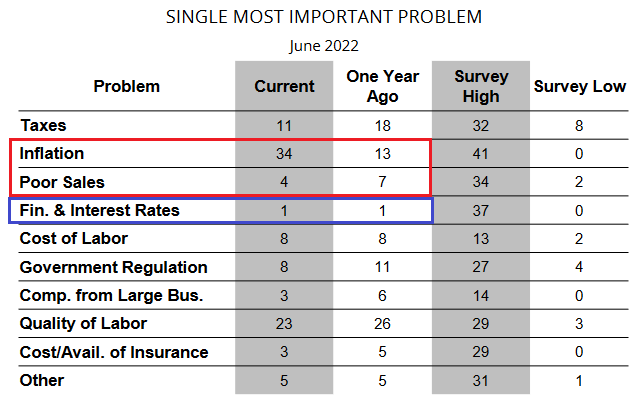
As further evidence, I noted above how 34% of respondents cited inflation as their “most important problem.” Well, that figure is up from 13% in June 2021 and is only seven points below the all-time high of 41%.
In contrast, the percentage of small businesses lamenting poor sales declined from 7% in June 2021 to 4% in June 2022. Furthermore, the far-right column shows that the current reading is only two points above the all-time low of 2%.
Please see below:
 Source: NFIB
Even more revealing, the blue rectangle above shows that only 1% of small businesses cite interest rates as their most important problem. Therefore, while the Fed has hiked interest rates six times in 2022, the figure matches 2021 and is only one point above the all-time low of 0%.
As such, sales volume is not a problem, interest rates are not a problem, and more small businesses are raising wages to “attract new workers into the labor force.” Therefore, does it seem like demand destruction has unfolded?
In reality, unanchored inflation has annihilated business confidence and has decision-makers bracing for the worst. As a result, the Fed needs to raise interest rates to curb inflation and restore predictability to the U.S. economy.
Think about it: how can CEOs make business decisions when they’re unsure of the cost of goods, labor, and whether or not demand will be present in the future. Moreover, when uncertainty reigns, the logical response is to become risk-averse and avoid decisions that could spur large potential losses.
Thus, while raising interest rates should elicit short-term pain and an eventual recession, I’ve warned on numerous occasions that not doing so would result in the worst possible outcome for Americans and the U.S. economy.
The Bottom Line
With asset prices selling off in advance of the CPI, today's release may result in a short-term reversal that catches over-positioned investors by surprise. Moreover, while it's happened many times in 2022, small bouts of positivity can amplify themselves when the shorts run for cover. Therefore, we may witness another re-enactment in the days ahead.
In contrast, the PMs' medium-term outlooks remain profoundly bearish. With the U.S. economy in better shape than the narrative suggests, inflation would have collapsed if demand had fallen off a cliff. Therefore, while sentiment has taken a plunge, the Fed will have to do the heavy lifting to make material progress on inflation.
In conclusion, the PMs declined on Jul. 12, as investors continued to front-run the CPI. However, with the markets often moving counterintuitively, pessimism can quickly turn to optimism. As a result, short-term upside should be on the horizon before the PMs continue their medium-term downtrends.
Overview of the Upcoming Part of the Decline
- It seems to me that the precious metals market is about to correct (rally) – similarly to what we saw in 2013 right before the April slide. And then – once the corrective rally is complete – I expect a huge decline to follow.
- If we see a situation where miners slide in a meaningful and volatile way while silver doesn’t (it just declines moderately), I plan to – once again – switch from short positions in miners to short positions in silver. At this time, it’s too early to say at what price levels this could take place and if we get this kind of opportunity at all – perhaps with gold prices close to $1,600.
- If we see a situation where miners slide in a meaningful and volatile way while silver doesn’t (it just declines moderately), I plan to – once again – switch from short positions in miners to short positions in silver. At this time, it’s too early to say at what price levels this could take place and if we get this kind of opportunity at all – perhaps with gold prices close to $1,600.
- I plan to exit all remaining short positions once gold shows substantial strength relative to the USD Index while the latter is still rallying. This may be the case with gold close to $1,400. I expect silver to fall the hardest in the final part of the move. This moment (when gold performs very strongly against the rallying USD and miners are strong relative to gold after its substantial decline) is likely to be the best entry point for long-term investments, in my view. This can also happen with gold close to $1,400, but at the moment it’s too early to say with certainty.
- The above is based on the information available today, and it might change in the following days/weeks.
You will find my general overview of the outlook for gold on the chart below:
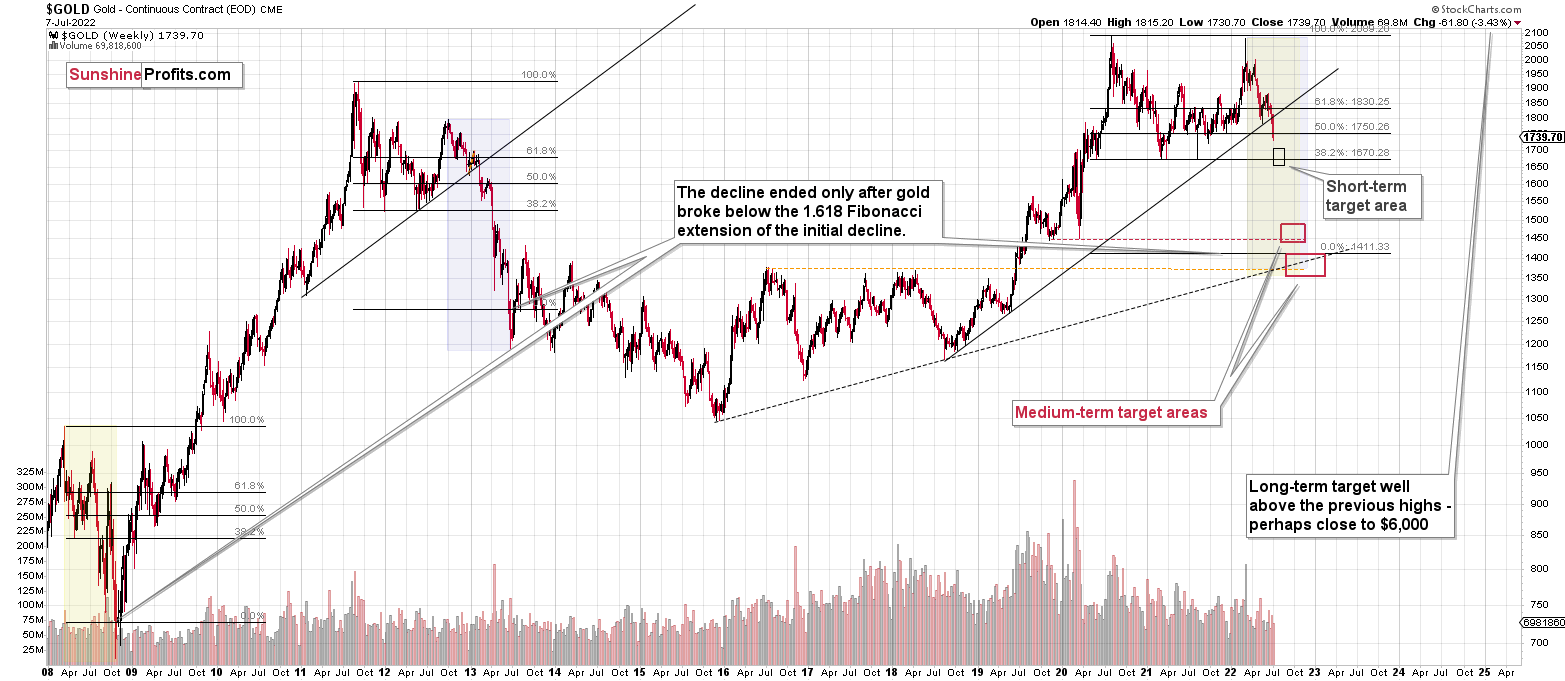
Please note that the above timing details are relatively broad and “for general overview only” – so that you know more or less what I think and how volatile I think the moves are likely to be – on an approximate basis. These time targets are not binding or clear enough for me to think that they should be used for purchasing options, warrants, or similar instruments.
Summary
Summing up, it seems that while the medium-term trend in the precious metals sector remains down, we are likely to see a corrective upswing soon. Based on the confirmations that we saw recently, the short-term outlook is bullish.
It seems likely that the profits that we earned from the last couple of trades will increase even further shortly.
After the final sell-off (that takes gold to about $1,350-$1,500), I expect the precious metals to rally significantly. The final part of the decline might take as little as 1-5 weeks, so it's important to stay alert to any changes.
As always, we'll keep you – our subscribers – informed.
To summarize:
Trading capital (supplementary part of the portfolio; our opinion): Full speculative long positions (100% of the full position) in junior mining stocks are justified from the risk to reward point of view with the following binding exit profit-take price levels:
Mining stocks (price levels for the GDXJ ETF): binding profit-take exit price: $33.87; stop-loss: none (the volatility is too big to justify a stop-loss order in case of this particular trade)
Alternatively, if one seeks leverage, we’re providing the binding profit-take levels for the JNUG (2x leveraged). The binding profit-take level for the JNUG: $36.78; stop-loss for the JNUG: none (the volatility is too big to justify a SL order in case of this particular trade).
For-your-information targets (our opinion; we continue to think that mining stocks are the preferred way of taking advantage of the upcoming price move, but if for whatever reason one wants / has to use silver or gold for this trade, we are providing the details anyway.):
Silver futures upside profit-take exit price: $20.28
SLV profit-take exit price: $18.78
AGQ profit-take exit price: $24.57
Gold futures upside profit-take exit price: $1,776
HGU.TO – alternative (Canadian) 2x leveraged gold stocks ETF – the upside profit-take exit price: $13.46
HZU.TO – alternative (Canadian) 2x leveraged silver ETF – the upside profit-take exit price: $9.18
Long-term capital (core part of the portfolio; our opinion): No positions (in other words: cash)
Insurance capital (core part of the portfolio; our opinion): Full position
Whether you’ve already subscribed or not, we encourage you to find out how to make the most of our alerts and read our replies to the most common alert-and-gold-trading-related-questions.
Please note that we describe the situation for the day that the alert is posted in the trading section. In other words, if we are writing about a speculative position, it means that it is up-to-date on the day it was posted. We are also featuring the initial target prices to decide whether keeping a position on a given day is in tune with your approach (some moves are too small for medium-term traders, and some might appear too big for day-traders).
Additionally, you might want to read why our stop-loss orders are usually relatively far from the current price.
Please note that a full position doesn't mean using all of the capital for a given trade. You will find details on our thoughts on gold portfolio structuring in the Key Insights section on our website.
As a reminder - "initial target price" means exactly that - an "initial" one. It's not a price level at which we suggest closing positions. If this becomes the case (as it did in the previous trade), we will refer to these levels as levels of exit orders (exactly as we've done previously). Stop-loss levels, however, are naturally not "initial", but something that, in our opinion, might be entered as an order.
Since it is impossible to synchronize target prices and stop-loss levels for all the ETFs and ETNs with the main markets that we provide these levels for (gold, silver and mining stocks - the GDX ETF), the stop-loss levels and target prices for other ETNs and ETF (among other: UGL, GLL, AGQ, ZSL, NUGT, DUST, JNUG, JDST) are provided as supplementary, and not as "final". This means that if a stop-loss or a target level is reached for any of the "additional instruments" (GLL for instance), but not for the "main instrument" (gold in this case), we will view positions in both gold and GLL as still open and the stop-loss for GLL would have to be moved lower. On the other hand, if gold moves to a stop-loss level but GLL doesn't, then we will view both positions (in gold and GLL) as closed. In other words, since it's not possible to be 100% certain that each related instrument moves to a given level when the underlying instrument does, we can't provide levels that would be binding. The levels that we do provide are our best estimate of the levels that will correspond to the levels in the underlying assets, but it will be the underlying assets that one will need to focus on regarding the signs pointing to closing a given position or keeping it open. We might adjust the levels in the "additional instruments" without adjusting the levels in the "main instruments", which will simply mean that we have improved our estimation of these levels, not that we changed our outlook on the markets. We are already working on a tool that would update these levels daily for the most popular ETFs, ETNs and individual mining stocks.
Our preferred ways to invest in and to trade gold along with the reasoning can be found in the how to buy gold section. Furthermore, our preferred ETFs and ETNs can be found in our Gold & Silver ETF Ranking.
As a reminder, Gold & Silver Trading Alerts are posted before or on each trading day (we usually post them before the opening bell, but we don't promise doing that each day). If there's anything urgent, we will send you an additional small alert before posting the main one.
Thank you.
Przemyslaw Radomski, CFA
Founder, Editor-in-chief

