

Briefly: in our opinion, full (300% of the regular position size) speculative short positions in junior mining stocks are justified from the risk/reward point of view at the moment of publishing this Alert.
I started yesterday’s analysis with a question that I then replied to, explaining why I thought that it wasn’t necessarily a good idea take profits from one’s short positions at this time, as the corrective upswings could be nothing to write home about, and that it might not be that easy to get back in the short positions at better (higher) prices.
Well, yesterday’s session showed exactly what I meant, and the 4-hour chart found below provides the details.
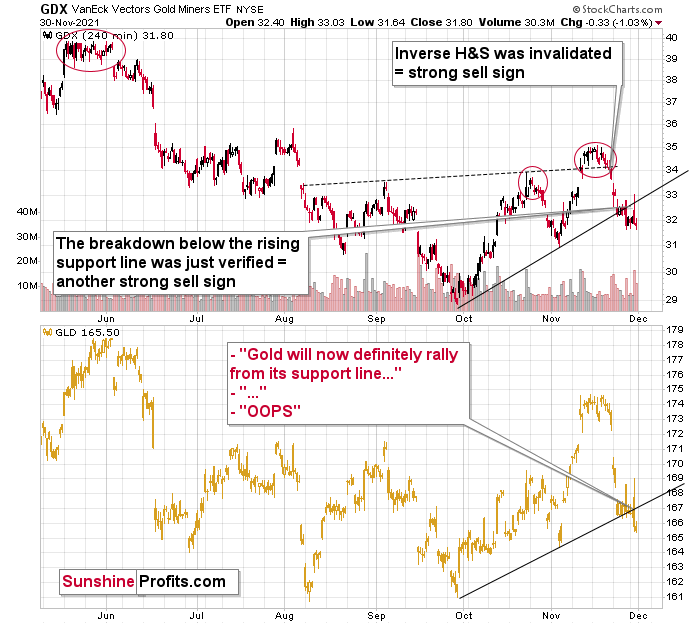
The upper part of the chart features the GDX ETF (proxy for gold mining stocks), and the lower part thereof features the GLD ETF (proxy for gold price itself.)
First of all, gold stocks were first to break below their rising support line – that happened a couple of days ago. Gold moved decisively below its rising support line only yesterday. This emphasizes that gold stocks are leading gold lower. This, in turn, is a bearish confirmation in itself, as that’s what tends to happen at the beginning of a bigger move lower.
The way both markets performed yesterday was also quite interesting.
In case of mining stocks, the intraday rally took GDX just slightly above its rising support line and then miners moved back down in a flash. In other words, if anyone had exited their short positions in order to re-enter them at higher prices, they had very little time to do so, and the most realistic version of this scenario is that they ended the session while missing the 1% decline in the GDX. The silver price was down by just 4 cents, but still, it was a move lower despite an intraday rally.
In the case of GLD, one might have thought that gold was bound to rally since it stopped at its rising support line (based on the Sep. and Nov. lows). And gold even rallied by about $20 intraday… Only to decline more and end yesterday’s session lower.
That was not a reversal. That was a bull trap.
And the most bearish thing about yesterday’s decline – and weakness? It happened while the USD Index moved lower during the day. The USDX ended the day 0.33 lower, which “should have” triggered gold’s rally. Instead, gold declined, proving that it really wants to move lower. And suggesting that profits from one’s short positions in mining stocks are likely to become bigger.
Don’t get me wrong – I do think that we’ll see a counter-trend upswing, but it’s just not that likely that we’ll see it right now. For quite some time, I’ve been repeating that it’s likely that we’ll see some kind of corrective upswing once gold moves back to its yearly lows, and this remains to be the case.
Then, after the rebound, gold is likely to decline once again, perhaps to its final lows (for many years to come).
Having said that, let’s take a look at the situation from a more fundamental angle.
That Escalated Quickly
With the S&P 500 suffering another daily freak out on Nov. 30, the bulls’ ‘perpetually higher’ narrative is starting to unravel. And with Fed Chairman Jerome Powell’s monetary policy 180 adding to the carnage, are the debts of rampant inflation about to be paid?
To explain, while I continuously warned that surging inflation would force the Fed to taper its asset purchases much sooner than investors expected, the death of QE was announced with little reaction. However, I also warned that the Fed’s hawk talk was likely far from its peak.
I wrote on Oct. 21:
While the deflationists have receded into the background and the Fed is hoping that 2022 will be more kind to its “transitory” narrative, inflation is still accelerating. And while the death of QE should help calm some of the fervor, an accelerated taper that concludes “by the middle of next year” is extremely bullish for the USD Index. Moreover, with the Fed still materially behind the inflation curve, hawkish whispers of further tightening should hit the wire in the coming months.
And with Powell lighting more hawkish fireworks on Nov. 30, he finally admitted that team “transitory” is waving the white flag. He said:
“The word transitory has different meanings for different people. To many it carries a sense of short-lived. We tend to use it to mean that it won’t leave a permanent mark in the form of higher inflation. I think it’s probably a good time to retire that word and try to explain more clearly what we mean.”
More importantly, though, when asked about the Fed’s taper timeline – which again, was only announced on Nov. 3 – Powell said:
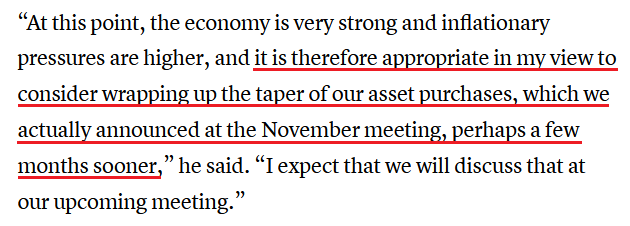 Source: CNBC
However, should any of this come as a surprise? Is it a coincidence that U.S. President Joe Biden has been chastising inflation for the past few weeks, and now, suddenly Powell wants to retire the word “transitory” and accelerate the pace of the taper?
For context, I wrote on Nov. 30:
Please remember that politicians pay close attention when consumers’ financial concerns go mainstream. Thus, after reappointing Powell as the Fed Chair on Nov. 22, it’s no surprise that Biden said the following on Nov. 26:
“I have talked to the Fed about a whole range of things from monetary policy to inflation, and I have confidence that the appointees I’ve made, and I’m going to have three more, are going to reflect that concern.”
And with Biden realizing that his presidency may hinge on solving inflation, Powell has essentially been given the green light to calm the pressures.
To that point, after the University of Michigan’s Consumer Sentiment Index sunk to a 10-year low in November, the writing was on the wall. And since unchecked inflation often leads to demand destruction, Biden and Powell realize that reducing liquidity is the lesser of two evils.
To explain, The Confidence Board released its Consumer Confidence Index on Nov. 30. And with the index declining from 111.6 in October to 109.5 in November (a nine-month low), Lynn Franco, Senior Director of Economic Indicators at The Conference Board, said:
“Expectations about short-term growth prospects ticked up, but job and income prospects ticked down. Concerns about rising prices – and, to a lesser degree, the Delta variant – were the primary drivers of the slight decline in confidence.”
However, when parsing through the data, it’s clear that inflation is rattling the U.S. consumer. Moreover, the policies required to calm the pricing pressures will likely result in the PMs’ fundamental ruin.
Please see below:
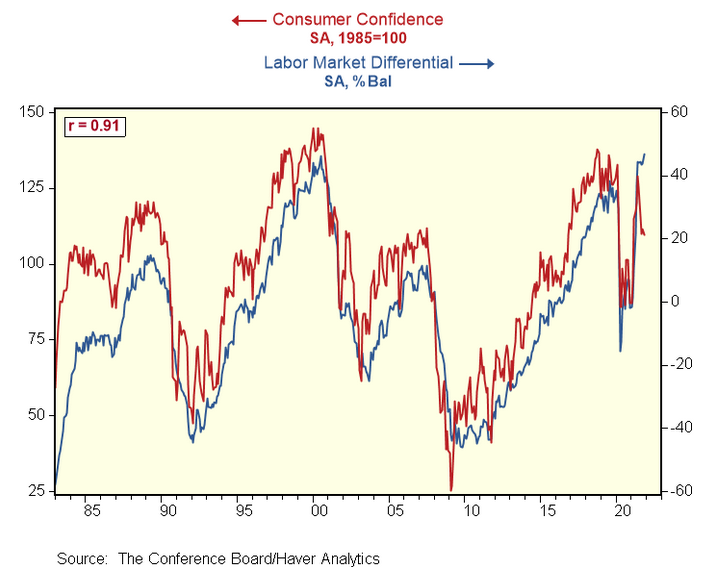
To explain, the red line above tracks The Confidence Board’s Consumer Confidence Index, while the blue line above tracks The Confidence Board’s labor differential. For context, the latter is calculated by subtracting the percentage of respondents that claim that jobs are “hard to get” from the percentage of respondents that claim that jobs are “plentiful.”
In a nutshell: when the blue line is rising, it means that U.S. employment opportunities are “plentiful”, and that Americans are not worried about their job security. Also noteworthy, the metric has a correlation of 0.91 with consumer confidence since its inception.
However, if you analyze the right side of the chart, you can see that the blue line has hit a 2021 high, while the red line has hit a nine-month low. As a result, the data signals that inflation is causing consumers’ anxiety. As a result, it’s no surprise that Biden and Powell are now waging an all-out offensive.
And why is all of this so important? Well, while the price action on Nov. 30 was contradictory, these developments are extremely bullish for the USD Index. And while I often repeat the statement, it’s important to remember that the greenback’s fundamentals are stronger now than at any other point in 2021.
Furthermore, with Biden likely providing his blessing, Powell’s hawkish rhetoric should shift to hawkish policy over the medium term. As a result, the USD Index’s fundamental foundation is supported by two extremely influential allies.
On the flip side, the EUR/USD – which accounts for nearly 58% of the movement of the USD Index – could present some fundamental resistance. In reality, the Fed and the ECB are worlds apart, and the latter’s economy is in much worse shape.
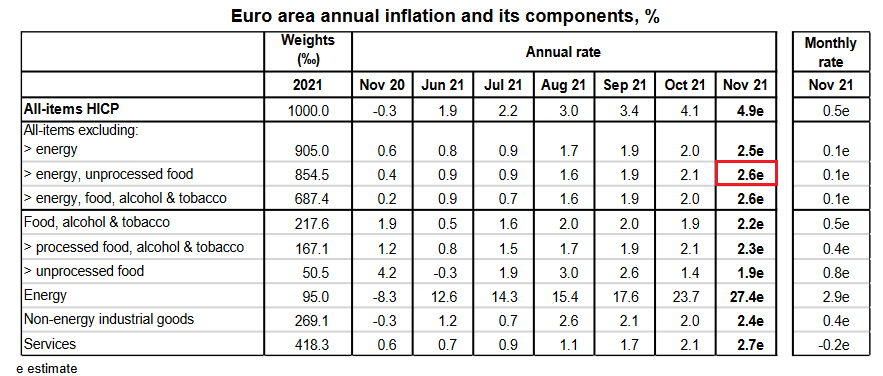
However, Eurozone inflation increased by 4.9% year-over-year (YoY) on Nov. 30 (flash estimate). And while energy prices were the main culprit, the media narrative of rampant Eurozone inflation could influence the ECB
As evidence, please have a look at the Financial Times’ headline on Nov. 30:
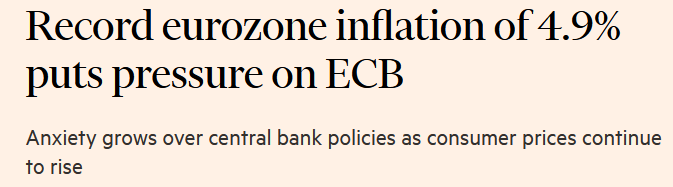
However, it’s important to remember that the Eurozone core Harmonised Index of Consumer Prices (HICP) – which excludes the inflationary impacts of food and energy – increased by 2.6% YoY in November (the red box below). As a result, the only inflationary issues confronting the Eurozone are surging oil & gas prices.
Please see below:
 Source: Eurostat
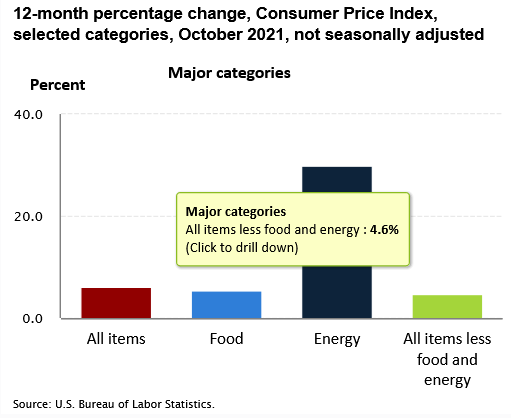
Conversely, the U.S. core Consumer Price Index (CPI) (released on Nov. 10) increased by 4.6% YoY. Thus, if we strip out food and energy, the U.S.’s inflationary problem is much worse than in the Eurozone.
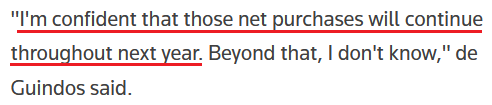
Finally, ECB Vice President Luis de Guindos said on Nov. 30 that even though PEPP purchases are scheduled to conclude at the end of March 2022, “they could be resumed if necessary.” Moreover, in stark contrast to the Fed, he emphasized that the ECB will likely purchase bonds until the end of 2022.
 Source: Reuters
The bottom line? While headline inflation could push the ECB in a hawkish direction, core readings are still well within the central bank’s 2% annual target. Moreover, with ECB President Christine Lagarde dismissing potential rate hikes and Vice President de Guindos signaling another year of bond purchases, the ECB is still well behind the Fed. Thus, while the risk of a hawkish shift is worth keeping an eye on, the U.S. dollar remains in the driver’s seat.
In conclusion, the PMs declined on Nov. 30, even as the USD Index struggled. And while the former’s dip was rational, the latter’s was driven by sentiment and not fundamentals. Thus, higher highs should materialize over the medium term. Conversely, with the PMs now in Biden and Powell’s crosshairs, their ‘war on inflation’ will likely result in many casualties across the precious metals market. As a result, the bearish thesis remains intact, and lower prices should confront the PMs over the next few months.
Overview of the Upcoming Part of the Decline
- It seems to me that the current corrective upswing in gold is about to be over soon, and the next short-term move lower is about to begin. Since it appears to be another short-term move more than a continuation of the bigger decline, I think that junior miners would be likely to (at least initially) decline more than silver.
- It seems that the first stop for gold will be close to its previous 2021 lows, slightly below $1,700. Then it will likely correct a bit, but it’s unclear if I want to exit or reverse the current short position based on that – it depends on the number and the nature of the bullish indications that we get at that time.
- After the above-mentioned correction, we’re likely to see a powerful slide, perhaps close to the 2020 low ($1,450 - $1,500).
- If we see a situation where miners slide in a meaningful and volatile way while silver doesn’t (it just declines moderately), I plan to – once again – switch from short positions in miners to short positions in silver. At this time, it’s too early to say at what price levels this could take place, and if we get this kind of opportunity at all – perhaps with gold close to $1,600.
- I plan to exit all remaining short positions once gold shows substantial strength relative to the USD Index while the latter is still rallying. This may be the case with gold close to $1,350 - $1,400. I expect silver to fall the hardest in the final part of the move. This moment (when gold performs very strongly against the rallying USD and miners are strong relative to gold after its substantial decline) is likely to be the best entry point for long-term investments, in my view. This can also happen with gold close to $1,375, but at the moment it’s too early to say with certainty. I expect the final bottom to take place near the end of the year, perhaps in mid-December. It is not set in stone that PMs have to bottom at that time. If not then, then early 2022 would become a likely time target.
- As a confirmation for the above, I will use the (upcoming or perhaps we have already seen it?) top in the general stock market as the starting point for the three-month countdown. The reason is that after the 1929 top, gold miners declined for about three months after the general stock market started to slide. We also saw some confirmations of this theory based on the analogy to 2008. All in all, the precious metals sector is likely to bottom about three months after the general stock market tops. The additional confirmation will come from the tapering schedule, as markets are likely to move on the rumor and reverse on the fact as they tend to do in general.
- The above is based on the information available today, and it might change in the following days/weeks.
You will find my general overview of the outlook for gold on the chart below:
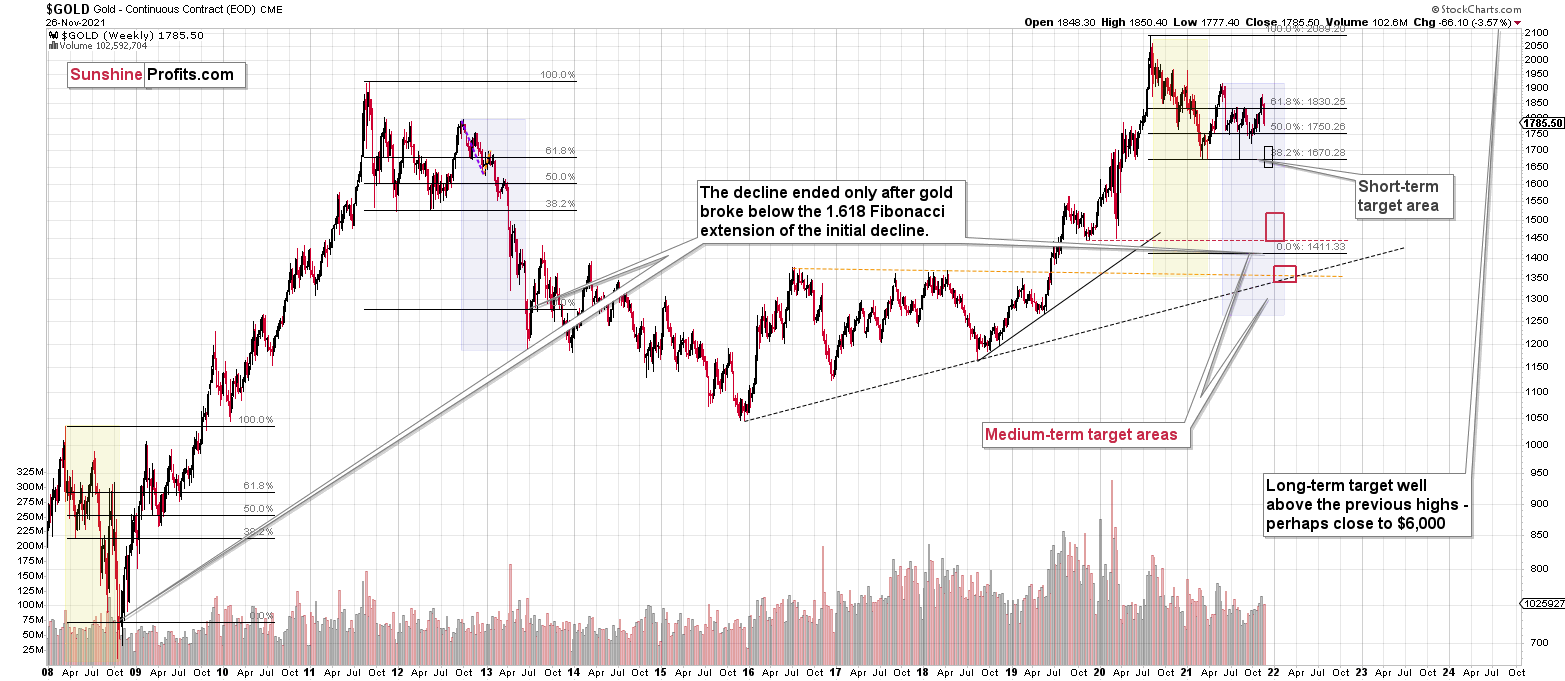
Please note that the above timing details are relatively broad and “for general overview only” – so that you know more or less what I think and how volatile I think the moves are likely to be – on an approximate basis. These time targets are not binding or clear enough for me to think that they should be used for purchasing options, warrants or similar instruments.
Letters to the Editor
Q: Does it appear that this new coronavirus variant (Editor’s note: Omicron variant) is launching gold and PM's. Or is it too early to tell?
A: In short, it’s too early to tell, but if it launches anything, I think it will be a move to the downside first - just like it was the case in 2020.
Summary
Summing up, gold declined in tune with my long-term-based indications, and the medium-term downtrend appears to have resumed. Based on the analogy to 2013 and other factors, a bigger decline in gold appears to be just around the corner (regardless of what happens in the very near term).
If the new Covid-19 variant makes the vaccine rather useless, we might be in for very wild price moves in most markets. In the case of the precious metals sector, the initial move should be to the downside, but at the same time, it makes the long-term outlook even more bullish.
It seems that we might see a short-term bottom close to the middle of December, and perhaps that’s when gold will move to its previous 2021 lows. However, I don’t think that it would be the final bottom. Conversely, it seems that the final bottom would form lower after a short-term correction (from the above-mentioned December lows).
From the medium-term point of view, the key two long-term factors remain the analogy to 2013 in gold and the broad head and shoulders pattern in the HUI Index. They both suggest much lower prices ahead.
It seems that our profits from the short positions are going to become truly epic in the following months.
After the sell-off (that takes gold to about $1,350 - $1,500), I expect the precious metals to rally significantly. The final part of the decline might take as little as 1-5 weeks, so it's important to stay alert to any changes.
Most importantly, please stay healthy and safe. We made a lot of money last March and this March, and it seems that we’re about to make much more on the upcoming decline, but you have to be healthy to enjoy the results.
As always, we'll keep you - our subscribers - informed.
By the way, we’re currently providing you with the possibility to extend your subscription by a year, two years or even three years with a special 20% discount. This discount can be applied right away, without the need to wait for your next renewal – if you choose to secure your premium access and complete the payment upfront. The boring time in the PMs is definitely over, and the time to pay close attention to the market is here. Naturally, it’s your capital, and the choice is up to you, but it seems that it might be a good idea to secure more premium access now while saving 20% at the same time. Our support team will be happy to assist you in the above-described upgrade at preferential terms – if you’d like to proceed, please contact us.
To summarize:
Trading capital (supplementary part of the portfolio; our opinion): Full speculative short positions (300% of the full position) in junior mining stocks are justified from the risk to reward point of view with the following binding exit profit-take price levels:
Mining stocks (price levels for the GDXJ ETF): binding profit-take exit price: $35.73; stop-loss: none (the volatility is too big to justify a stop-loss order in case of this particular trade)
Alternatively, if one seeks leverage, we’re providing the binding profit-take levels for the JDST (2x leveraged) and GDXD (3x leveraged – which is not suggested for most traders/investors due to the significant leverage). The binding profit-take level for the JDST: $16.18; stop-loss for the JDST: none (the volatility is too big to justify a SL order in case of this particular trade); binding profit-take level for the GDXD: $32.08; stop-loss for the GDXD: none (the volatility is too big to justify a SL order in case of this particular trade).
For-your-information targets (our opinion; we continue to think that mining stocks are the preferred way of taking advantage of the upcoming price move, but if for whatever reason one wants / has to use silver or gold for this trade, we are providing the details anyway.):
Silver futures downside profit-take exit price: $19.12
SLV profit-take exit price: $17.72
ZSL profit-take exit price: $41.38
Gold futures downside profit-take exit price: $1,683
HGD.TO – alternative (Canadian) inverse 2x leveraged gold stocks ETF – the upside profit-take exit price: $12.48
HZD.TO – alternative (Canadian) inverse 2x leveraged silver ETF – the upside profit-take exit price: $30.48
Long-term capital (core part of the portfolio; our opinion): No positions (in other words: cash
Insurance capital (core part of the portfolio; our opinion): Full position
Whether you already subscribed or not, we encourage you to find out how to make the most of our alerts and read our replies to the most common alert-and-gold-trading-related-questions.
Please note that we describe the situation for the day that the alert is posted in the trading section. In other words, if we are writing about a speculative position, it means that it is up-to-date on the day it was posted. We are also featuring the initial target prices to decide whether keeping a position on a given day is in tune with your approach (some moves are too small for medium-term traders, and some might appear too big for day-traders).
Additionally, you might want to read why our stop-loss orders are usually relatively far from the current price.
Please note that a full position doesn't mean using all of the capital for a given trade. You will find details on our thoughts on gold portfolio structuring in the Key Insights section on our website.
As a reminder - "initial target price" means exactly that - an "initial" one. It's not a price level at which we suggest closing positions. If this becomes the case (like it did in the previous trade), we will refer to these levels as levels of exit orders (exactly as we've done previously). Stop-loss levels, however, are naturally not "initial", but something that, in our opinion, might be entered as an order.
Since it is impossible to synchronize target prices and stop-loss levels for all the ETFs and ETNs with the main markets that we provide these levels for (gold, silver, and mining stocks - the GDX ETF), the stop-loss levels and target prices for other ETNs and ETF (among other: UGL, GLL, AGQ, ZSL, NUGT, DUST, JNUG, JDST) are provided as supplementary, and not as "final". This means that if a stop-loss or a target level is reached for any of the "additional instruments" (GLL for instance), but not for the "main instrument" (gold in this case), we will view positions in both gold and GLL as still open and the stop-loss for GLL would have to be moved lower. On the other hand, if gold moves to a stop-loss level but GLL doesn't, then we will view both positions (in gold and GLL) as closed. In other words, since it's not possible to be 100% certain that each related instrument moves to a given level when the underlying instrument does, we can't provide levels that would be binding. The levels that we do provide are our best estimate of the levels that will correspond to the levels in the underlying assets, but it will be the underlying assets that one will need to focus on regarding the signs pointing to closing a given position or keeping it open. We might adjust the levels in the "additional instruments" without adjusting the levels in the "main instruments", which will simply mean that we have improved our estimation of these levels, not that we changed our outlook on the markets. We are already working on a tool that would update these levels daily for the most popular ETFs, ETNs and individual mining stocks.
Our preferred ways to invest in and to trade gold along with the reasoning can be found in the how to buy gold section. Furthermore, our preferred ETFs and ETNs can be found in our Gold & Silver ETF Ranking.
As a reminder, Gold & Silver Trading Alerts are posted before or on each trading day (we usually post them before the opening bell, but we don't promise doing that each day). If there's anything urgent, we will send you an additional small alert before posting the main one.
Thank you.
Przemyslaw Radomski, CFA
Founder, Editor-in-chief

