

Briefly: in our opinion, full (300% of the regular position size) speculative short positions in mining stocks are justified from the risk/reward point of view at the moment of publishing this Alert.
History tends to rhyme and what happened before, will – to some degree - happen again. Gold is not immune to this concept, and the current implications are bearish.
Let’s jump right into the charts for details.
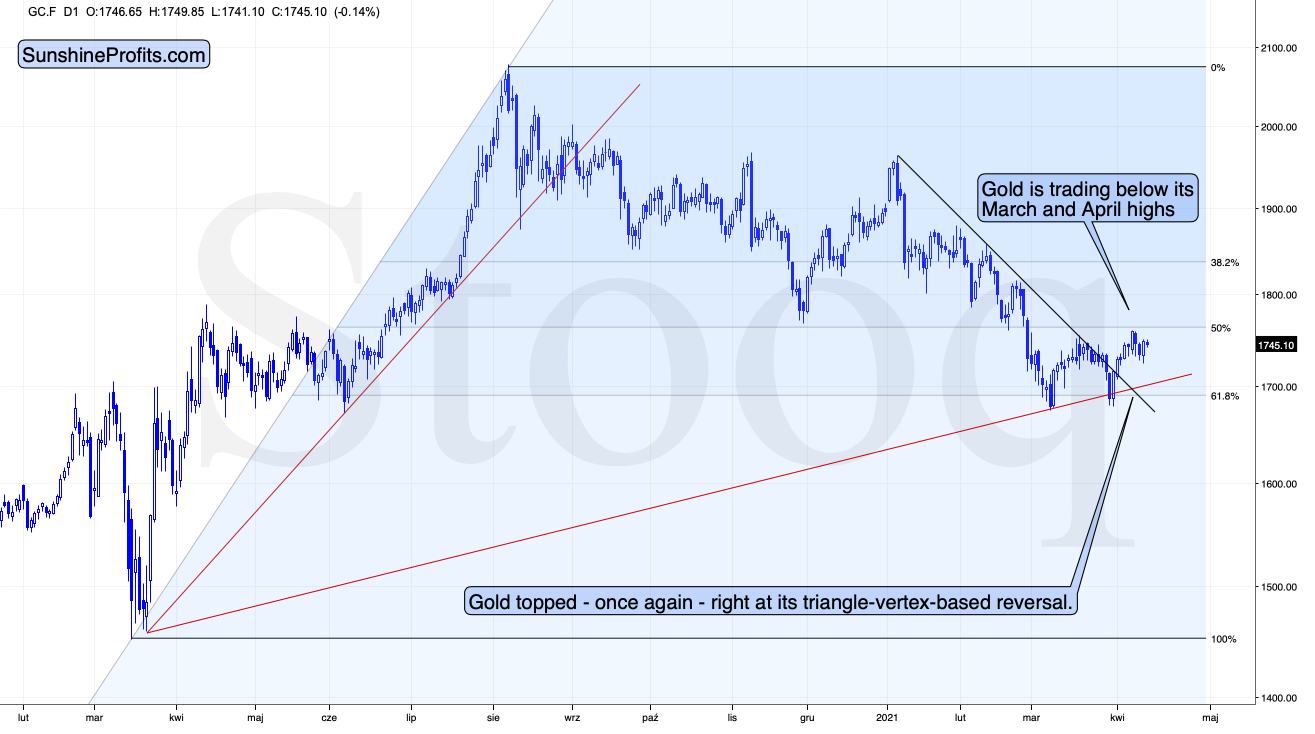
Gold topped right at its triangle-vertex-based reversal, just like it did in mid-March and in early January (please note the points that are marked on the above chart for confirmation – they are described in red). That happened on Thursday (Apr. 8), and since that time gold has continued to move lower.
Gold invalidated the breakout above its mid-March highs, proving that what we saw was nothing more than just an ABC (zigzag) correction within a bigger downswing. The moves that follow such corrections are likely to be similar to the moves that precede it. In this case, the move that preceded the correction was the 2021 decline of over $150. This means that another $150+ decline could have just begun.
It might appear bullish that gold rallied yesterday (Apr. 13), but it only appears this way until one compares this rally with what happened in the USD Index during the same time. Paying attention to today’s (Apr. 14) pre-market price moves further emphasizes the fake nature of yesterday’s rally in gold.
The point is not that gold rallied, but that it hasn’t rallied enough.
During yesterday’s session, the USD Index moved to new monthly lows and this decline continued in today’s pre-market trading. Consequently, if gold was at least reacting to the USD’s movement “normally”, it should move to new monthly highs. If gold “wanted” to rally, it would have likely exploded to the upside. But what happened instead? Gold moved higher only somewhat yesterday – not to new monthly highs – and in today’s pre-market trading it’s actually slightly lower.
This tells us that gold “wants” to move lower now.
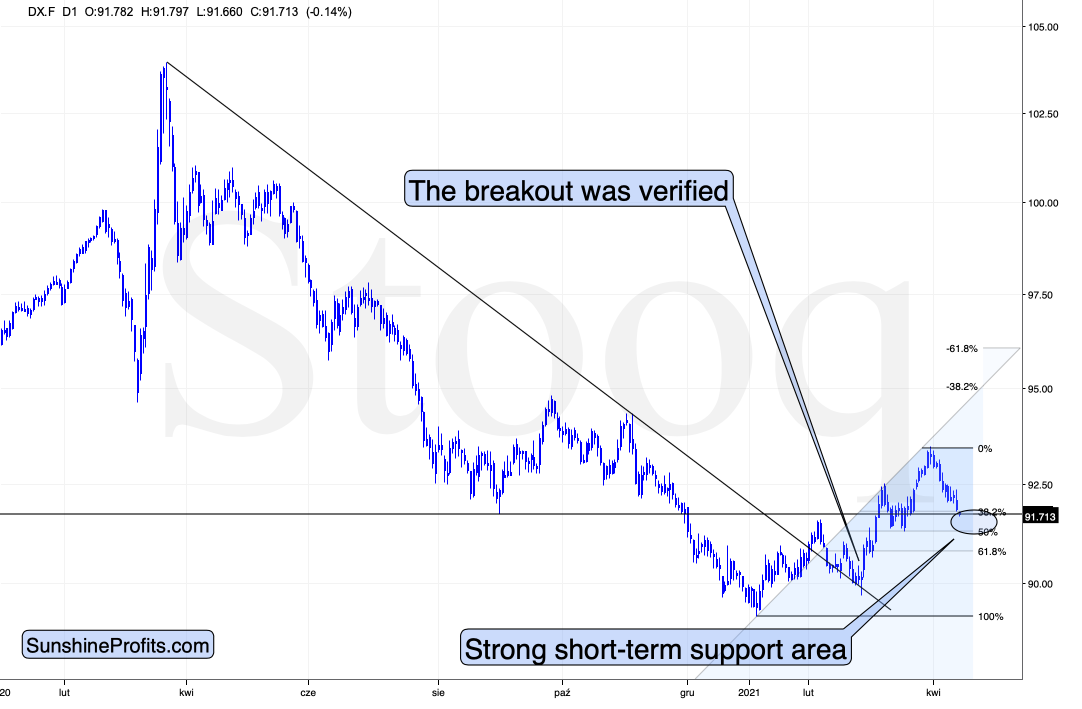
The USD Index moved lower and it can move even lower on a very short-term basis, perhaps to the 50% Fibonacci retracement based on the entire 2021 rally, and the previous lows. And what would be the likely effect on gold? Based on what we saw yesterday, and what we see so far today, it seems that gold will likely ignore this decline in the USD Index, while waiting for the latter to finally show strength – so that it (gold) could decline.
After all, gold has already topped right at its triangle-vertex-based reversal point. Consequently, it’s no wonder that it now continues to trade sideways, waiting for a trigger to move much lower.
Moreover, please note that the recent zigzag makes the situation similar (approximately symmetrical) to what we saw about a year ago – between April and early June. Once gold breaks to new yearly lows, one could view this as a breakdown below the neckline of a major head and shoulders pattern where the April 2020 – June 2020 and the recent consolidations are the shoulders of the pattern. Based on such a pattern, gold would be likely to slide profoundly, probably well below $1,500. And the relative performance of gold vs. the USD Index tells us that such a short-term breakdown (to new yearly lows) is a likely outcome in the following weeks.
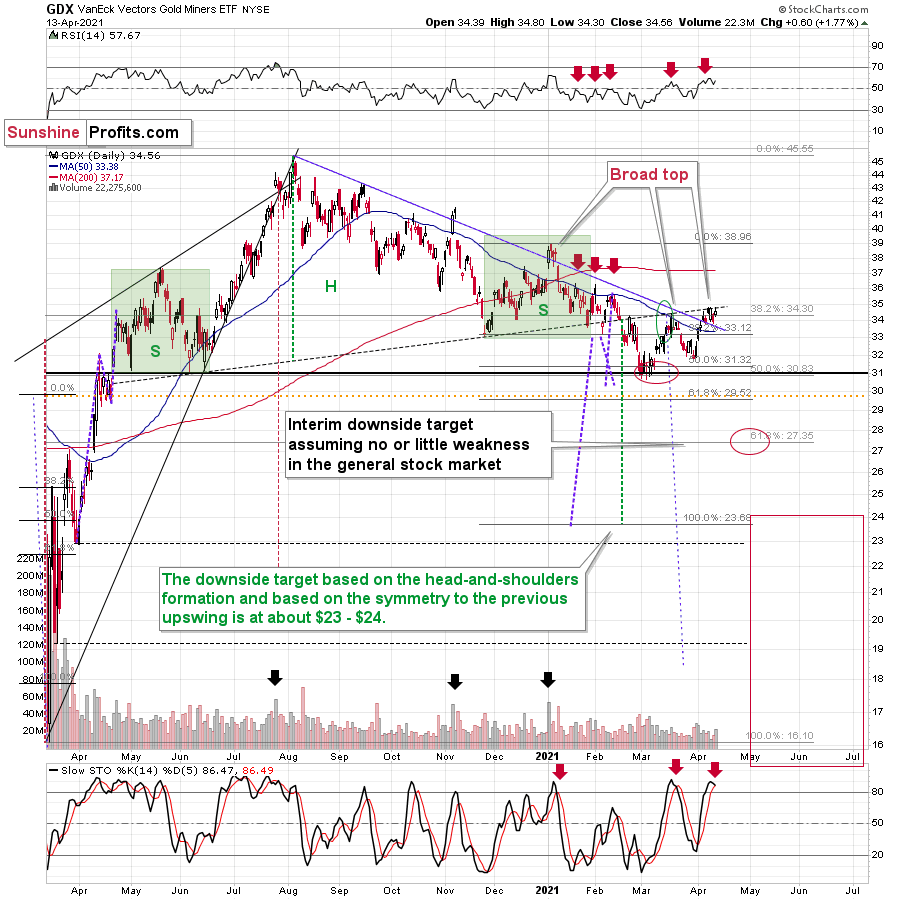
Gold stocks also failed to rally to new monthly highs, and they seem to be forming a relatively broad topping pattern, just as they did in mid-March and at the beginning of the year.
The sell signal from the Stochastic indicator as well as the fact that miners failed to invalidate the breakdown below their broad head-and-shoulders pattern points to a bearish outlook for the following weeks (and perhaps months).
All in all, the outlook for the precious metals market remains bearish and the recent rally didn’t change anything.
Having said that, let’s take a look at the market from a more fundamental angle.
Decoding the Dollar
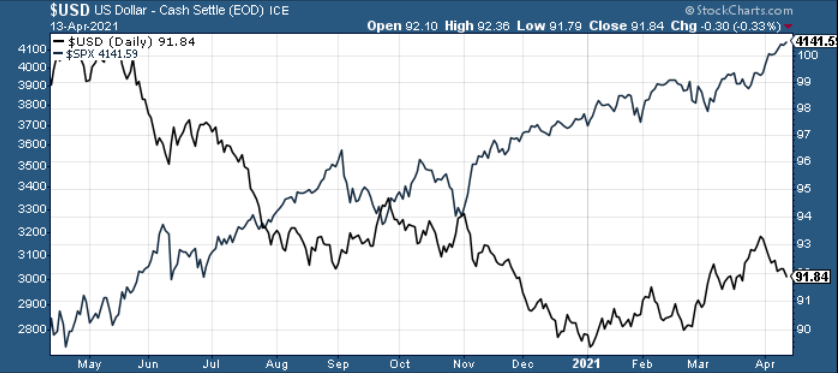
With the USD Index still on its back foot, April hasn’t been kind to the greenback. However, while the dollar languishes in a state of consolidation, the declining momentum completely contradicts the USD Index’s strong relative (! – compared to other currencies) fundamentals.
Case in point: even as the USD Index fell, non-commercial (speculative) futures traders, asset managers and leveraged funds were increasing their net-long USD positions.
Please see below:
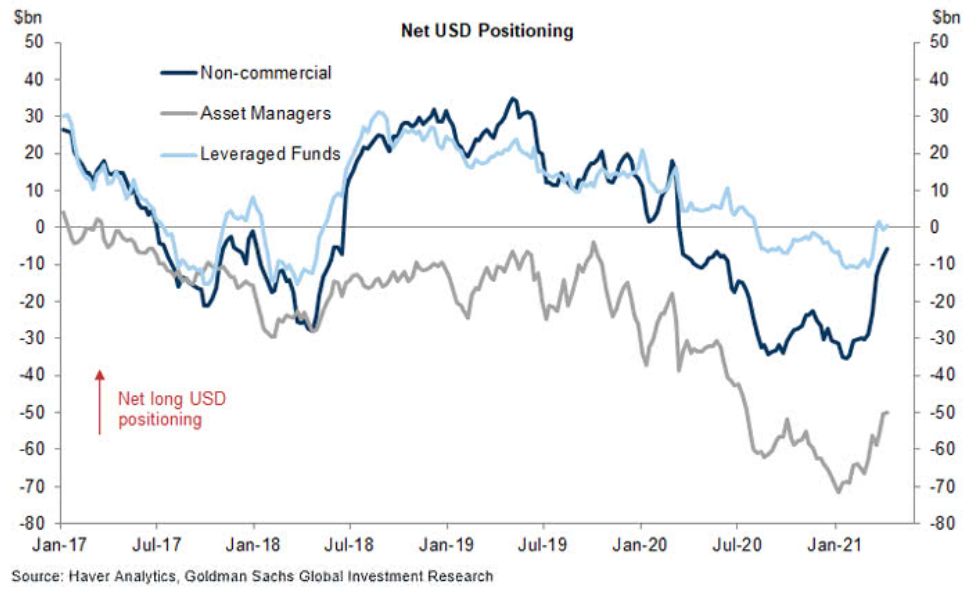
To explain, the dark blue, gray and light blue lines above represent net-long positions of non-commercial (speculative) futures traders, asset managers and leveraged funds. When the lines are falling, it means that the trio have reduced their net-long positions and are expecting a weaker U.S. dollar. Conversely, when the lines are rising, it means that the trio have increased their net-long positions and are expecting a stronger U.S. dollar. And if you analyze the right side of the chart, you can see that all three are bracing for upward USD momentum.
Second, China’s credit impulse has moved sharply lower in recent months. For context, the metric measures changes in China’s public and private debt as a percentage of its GDP. Essentially, when the government, corporations and citizens are borrowing more money as a percentage of GDP, China’s credit impulse increases. Conversely, when the opposite occurs, China’s credit impulse decreases.
And why does this matter?
Because a peak in China’s credit impulse often marks significant turning points in economic activity. For example, a decline can have a profound impact on commodity prices, as a reduction in spending reduces demand for copper, oil and iron ore. More importantly though, a peak in China’s credit impulse often coincides with a bottom in the USD Index.
Please see below:
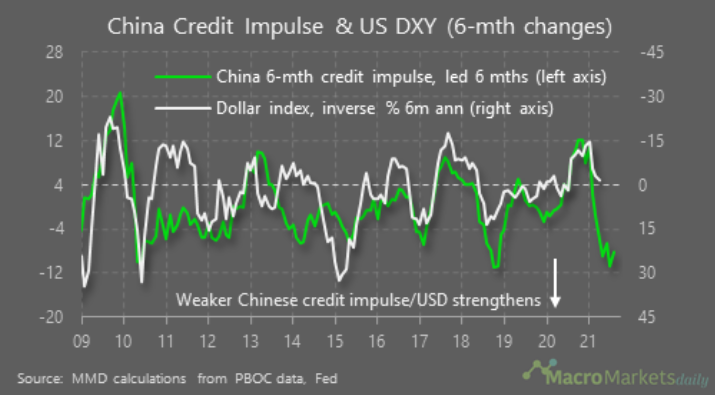
To explain, the green line above tracks China’s six-month credit impulse, while the white line above tracks the inverted six-month annual percentage change of the USD Index. For context, inverted means that the USD Index’s axis is flipped upside down and that a falling white line represents a rising USD Index. If you analyze the right side of the chart, you can see that China’s credit impulse peaked near the end of 2020 and has moved sharply lower even since.
In addition, if you analyze prior six-month peaks near 2010, 2013, mid-2016, mid-2017 and early 2019, the USD Index formed bottoms at roughly the same times. Thus, with the significant gap on the right side of the chart implying follow-through by the white line, the USD Index should move substantially higher over the next six months.
In similar fashion, fluctuations in China’s credit impulse also have a profound impact on the S&P 500. If you analyze the chart below, you can see that six-month peaks near 2010, early 2013, mid-2016, mid-2018 (with a lag) and late 2020 coincided with peaks in the six-month annual percentage change of the S&P 500. Furthermore, with an equally large gap on the right side of the chart, the S&P 500 could be ready to roll over.
Please see below:
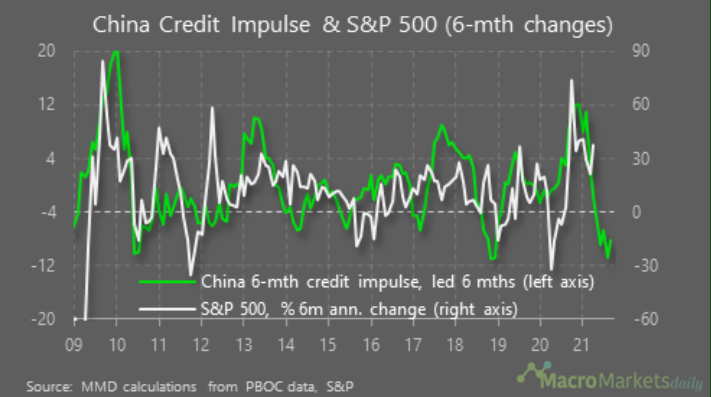
As a result, because the USD Index has a strong negative correlation with the S&P 500, a significant drawdown of the latter could light a fire under the former.
Please see below:
If that wasn’t enough, the EUR/USD accounts for nearly 58% of the movement of the USD Index. In a nutshell: a 1% decline in the currency pair results in a ~0.58% increase in the USD Index (holding all else constant).
And despite the EUR/USD moving higher since April, non-commercial (speculative) futures traders were net-sellers of last week’s rally. Case in point: the latest Commitments of Traders (COT) report revealed that speculators reduced their EUR/USD long positions by more than 2,500 contracts and increased their EUR/USD short positions by nearly 3,700 contracts.
Please see below:
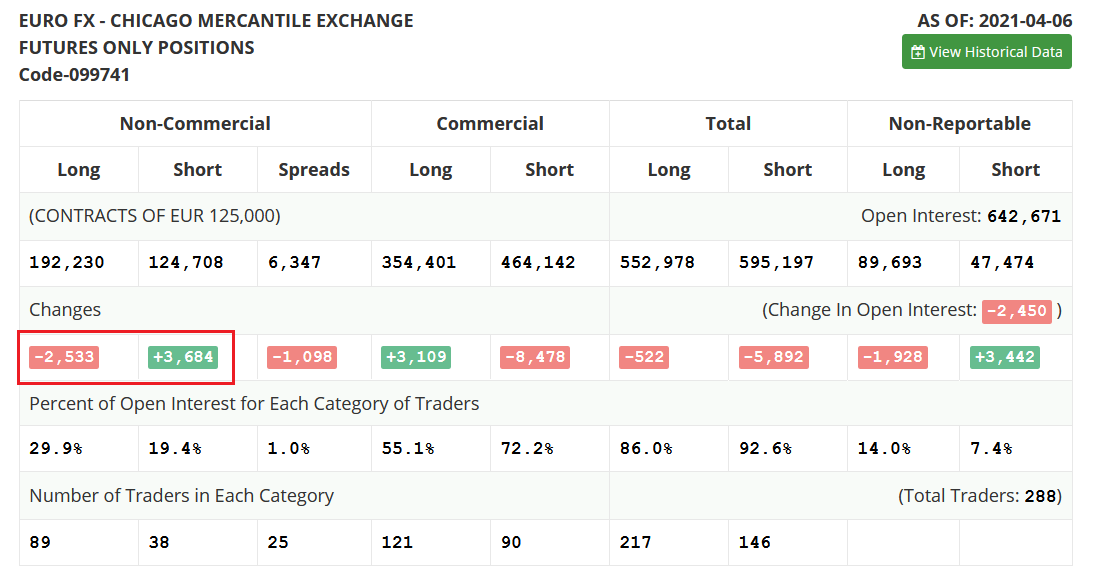 Source: COT
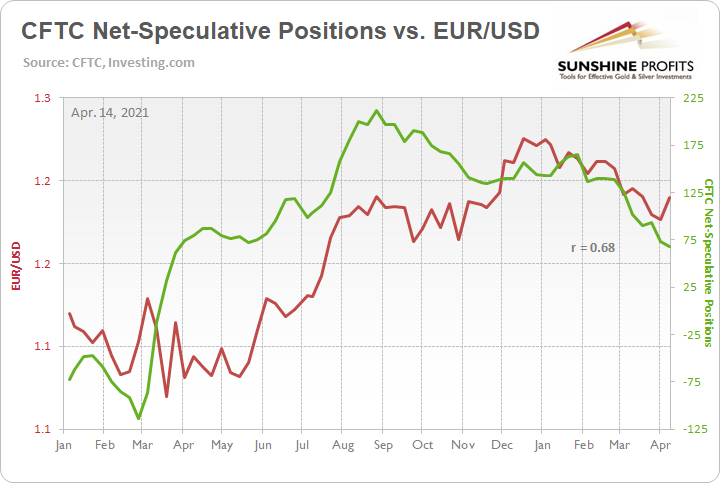
And diverging from the norm, notice how the EUR/USD tends to rise and fall with speculative net-futures positioning?
As further evidence, if you analyze the monthly chart below, you can see that the two variables have a 15+-month correlation of 0.68.
The bottom line? The EUR/USD’s divergence is living on borrowed time.
For more context, I wrote previously:
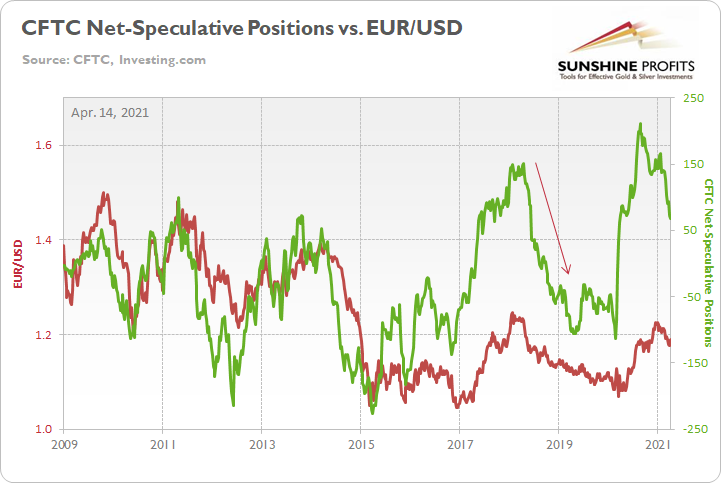
If you analyze the right side of the long-term chart above (2009-2021), you can see that speculative net-futures positioning has already begun to roll over. And with the 2020 reading by far the highest on record, the last four times speculative net-futures positioning moved from peak-to-trough, the EUR/USD declined by an average of 15.35%.
Please see below:
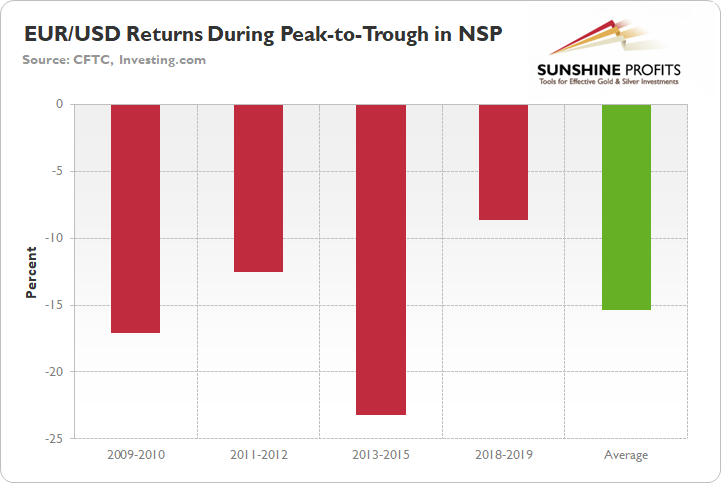
Furthermore, because it pays to be conservative, if we apply the 2018-2019 analogue – marked by the arrow on the long-term chart above (2009-2021) – by the time speculative net-futures positioning troughed (at net-short 106,000 contracts), the EUR/USD had declined by 8.6%. As a result, if speculative net-futures positioning continues its rapid descent, an identical 8.6% decline would usher the EUR/USD back to 1.09.
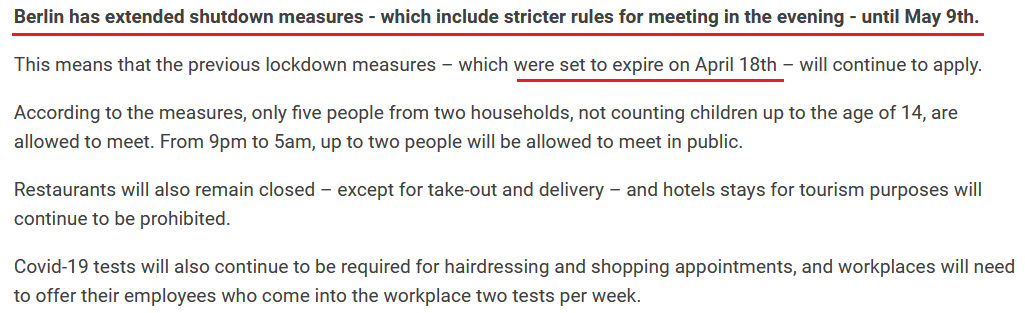
Adding to the EUR/USD’s wall of worry, the economic outlook in Europe continues to weaken. With COVID-19 raging and the vaccine rollout stuck in neutral, on Apr. 12, Germany – Europe’s largest economy – extended its nationwide lockdown by another three weeks.
Please see below:
 Source: The Local
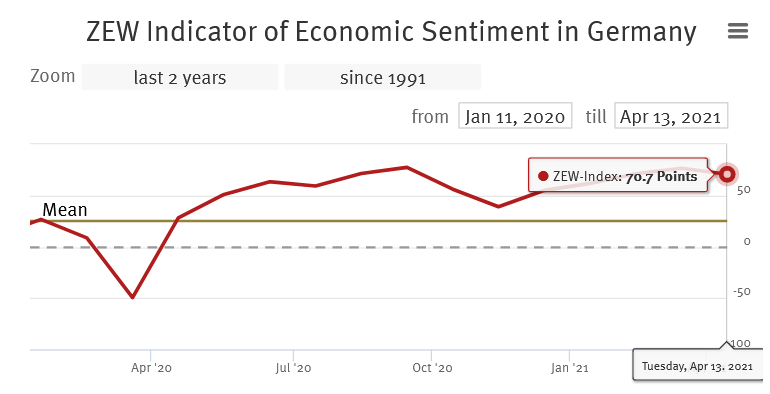
Moreover, with Europe’s economic renaissance in a state of perpetual delay, on Apr. 13, the ZEW – a German economic research institute – revealed that its economic sentiment index declined by 5.9 points to 70.7. For context, the index is calculated using the responses of 300 experts from banks, insurance companies and financial departments within select corporations. More importantly though, the decline was the first since November 2020.
Please see below:
 Source: ZEW
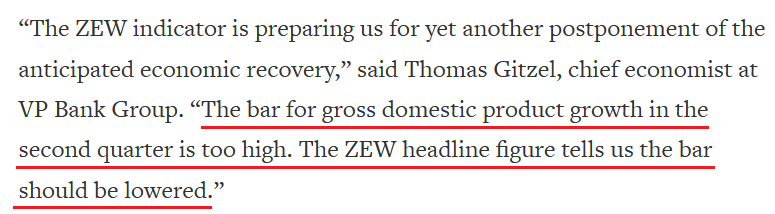
And what was VP Bank Group’s takeaway from the release?
 Source: Reuters
Singing a similar tune, as shutdown measures further widen the gap between Eurozone-U.S. growth differentials, Vanda Research’s latest FX Outlook signals that the decoupling has only just begun.
Please see below:
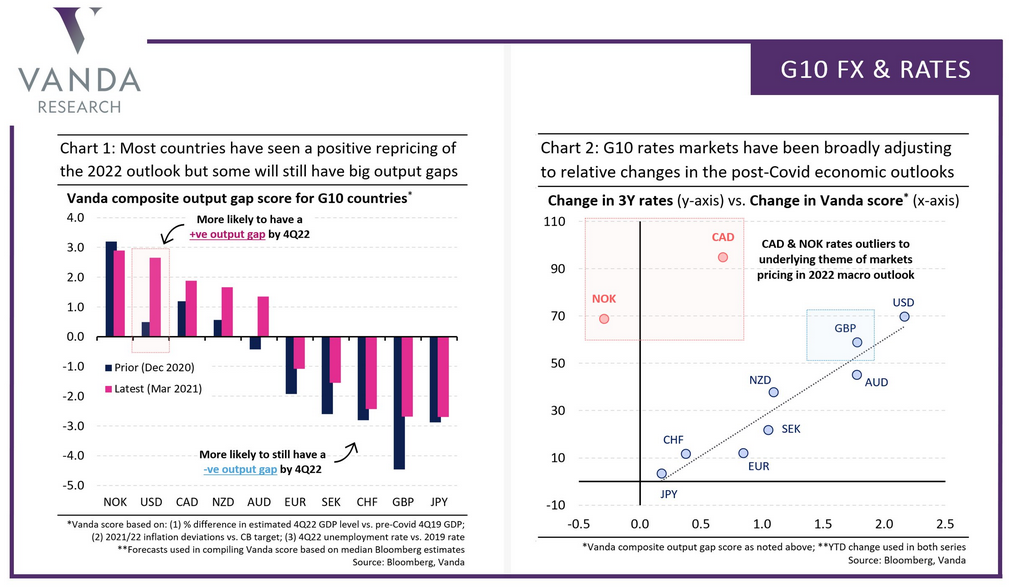
To explain, the blue and pink bars above indicate the probability of regions having positive or negative output gaps by the fourth quarter of 2022. For context, a positive output gap means that a region’s actual GDP (realized) outperforms its potential GDP (medium-term trend). Conversely, a negative output gap means that a region’s actual GDP (realized) underperforms its potential GDP (medium-term trend). In addition, the blue and pink bars above contrast Vanda Research’s projections in December 2020 and March 2021.
Thus, if you analyze the second positive pink bar on the left (USD), the U.S. is now significantly more likely to have a positive output gap by Q4:2022. Conversely, if you analyze the first negative pink bar on the left (EUR), Europe is still half as likely to have a negative output gap by Q4:2022. The bottom line? While both regions have seen an upgrade in growth expectations, the U.S. significantly outperforms on a relative basis.
Furthermore, if you analyze the chart on the right, you can see that U.S. interest rates have the highest response rate to a positive change in Vanda Research’s composite score. To explain, at the top of the upward sloping line, a USD score of more than 2.0 coincides with a 70-point increase in U.S. 3-year bond yields. Conversely, a EUR score of less than 1.0 coincides with a roughly 10-point increase in Eurozone 3-year bond yields.
And why are Eurozone-U.S. interest rate differentials so important?
Because if you analyze the chart below, you can see that the spread between Eurozone and U.S. real yields (inflation-adjusted) often has a profound impact on the EUR/USD.
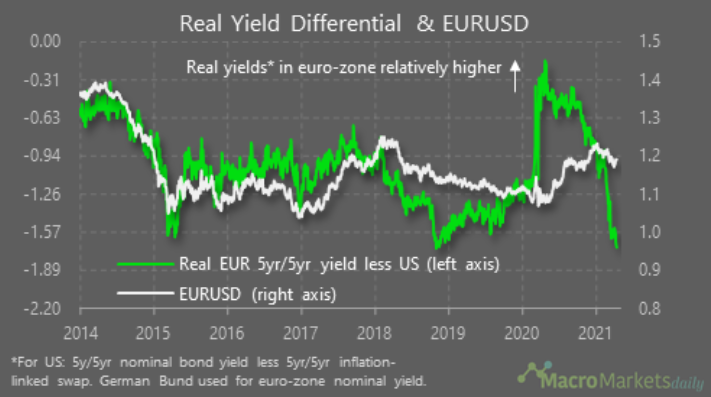
To explain, when the green line is rising, the Eurozone real yield is outperforming the U.S real yield. Conversely, when the green line is falling, the U.S. real yield is outperforming the Eurozone real yield. Moreover, if you analyze the right side of the chart, you can see that real yield differentials have moved sharply lower. Thus, with the EUR/USD (the white line) still showing a material divergence, it’s yet another fundamental indicator that supports a weakening of the currency pair.
Finally, because EUR/USD pain is the USD Index’s gain, a material decline of the currency pair is extremely negative for gold. Case in point: gold has a strong negative correlation with the USD Index. As a result, an upward rerating of the USDX will likely cast a dark shadow over the yellow metal.
In conclusion, the PMs’ daily bounce on Apr. 13 occurred at the expense of the USD Index and the U.S. 10-Year Treasury yield. However, with the former’s move relatively weak from a historical perspective, a reversal of fortunes will likely haunt the PMs over the medium term. Moreover, with technicals, fundamentals and sentiment favoring the latter, the recent price action is an inaccurate portrayal of the overall state of play. As a result, the PMs will likely face a much tougher environment going forward.
Overview of the Upcoming Part of the Decline
- It seems likely to me that the corrective upswing was already completed last week (Apr. 5-9). Consequently, it seems that the next big move lower is already underway.
- After miners slide once again in a meaningful and volatile way, but silver doesn’t (and it just declines moderately), I plan to switch from short positions in miners to short positions in silver (this could take another 1-2 weeks to materialize). I plan to exit those short positions when gold shows substantial strength relative to the USD Index, while the latter is still rallying. This might take place with gold close to $1,450 - $1,500 and the entire decline (from above $1,700 to about $1,475) would be likely to take place within 1-12 weeks and I would expect silver to fall hardest in the final part of the move. This moment (when gold performs very strongly against the rallying USD and miners are strong relative to gold – after gold has already declined substantially) is likely to be the best entry point for long-term investments in my view. This might happen with gold close to $1,475, but it’s too early to say with certainty at this time. In other words, the entire decline could take between 1 and 12 weeks, with silver declines occurring particularly fast in the final 1-2 weeks.
- If gold declines even below $1,500 (say, to ~$1350 or so), then it could take another 10 weeks or so for it to bottom, but this is not what I view as a very likely outcome.
- As a confirmation for the above, I will use the (upcoming or perhaps we have already seen it?) top in the general stock market as the starting point for the three-month countdown. The reason is that after the 1929 top, gold miners declined for about three months after the general stock market started to slide. We also saw some confirmations of this theory based on the analogy to 2008. All in all, the precious metals sector would be likely to bottom about three months after the general stock market tops . If the mid-February 2020 top was the final medium-term top (based on NASDAQ’s top, then it seems that we might expect the precious metals sector to bottom in mid-May or close to May’s end. If, however, the mid-March 2020 top was the final medium-term top (based on the S&P 500), then we might expect the precious metals sector to bottom in mid-June or close to June’s end.
- The above is based on the information available today and it might change in the following days/weeks.
Summary
To summarize, the PMs’ medium-term decline is well underway, and based on the recent performance of the USD Index, gold and mining stocks, it seems that the corrective upswing is already over or about to be over. Based on gold’s triangle-vertex-based reversal it seems that we saw the top on Thursday (Apr. 8). The next big move lower seems to be already underway or about to start.
In addition, because we’re likely entering the “winter” part of the Kondratiev cycle (just like in 1929 and then the 1930s), the outlook for the precious metals’ sector remains particularly bearish during the very first part of the cycle, when cash is king.
The confirmed breakout in the USD Index is yet another confirmation of the bearish outlook for the precious metals market.
After the sell-off (that takes gold to about $1,450 - $1,500), we expect the precious metals to rally significantly. The final part of the decline might take as little as 1-5 weeks, so it's important to stay alert to any changes.
Most importantly, please stay healthy and safe. We made a lot of money last March and it seems that we’re about to make much more on this March decline, but you have to be healthy to enjoy the results.
As always, we'll keep you - our subscribers - informed.
By the way, we’re currently providing you with a possibility to extend your subscription by a year, two years or even three years with a special 20% discount. This discount can be applied right away, without the need to wait for your next renewal – if you choose to secure your premium access and complete the payment upfront. The boring time in the PMs is definitely over and the time to pay close attention to the market is here. Naturally, it’s your capital, and the choice is up to you, but it seems that it might be a good idea to secure more premium access now, while saving 20% at the same time. Our support team will be happy to assist you in the above-described upgrade at preferential terms – if you’d like to proceed, please contact us.
To summarize:
Trading capital (supplementary part of the portfolio; our opinion): Full speculative short positions (300% of the full position) in mining stocks are justified from the risk to reward point of view with the following binding exit profit-take price levels:
Mining stocks (price levels for the GDXJ ETF): binding profit-take exit price: $24.12; stop-loss: none (the volatility is too big to justify a stop-loss order in case of this particular trade)
Alternatively, if one seeks leverage, we’re providing the binding profit-take levels for the JDST (2x leveraged) and GDXD (3x leveraged – which is not suggested for most traders/investors due to the significant leverage). The binding profit-take level for the JDST: $39.87; stop-loss for the JDST: none (the volatility is too big to justify a SL order in case of this particular trade); binding profit-take level for the GDXD: $94.87; stop-loss for the GDXD: none (the volatility is too big to justify a SL order in case of this particular trade).
For-your-information targets (our opinion; we continue to think that mining stocks are the preferred way of taking advantage of the upcoming price move, but if for whatever reason one wants / has to use silver or gold for this trade, we are providing the details anyway.):
Silver futures upside profit-take exit price: unclear at this time - initially, it might be a good idea to exit, when gold moves to $1,512.
Gold futures upside profit-take exit price: $1,512.
Long-term capital (core part of the portfolio; our opinion): No positions (in other words: cash
Insurance capital (core part of the portfolio; our opinion): Full position
Whether you already subscribed or not, we encourage you to find out how to make the most of our alerts and read our replies to the most common alert-and-gold-trading-related-questions.
Please note that we describe the situation for the day that the alert is posted in the trading section. In other words, if we are writing about a speculative position, it means that it is up-to-date on the day it was posted. We are also featuring the initial target prices to decide whether keeping a position on a given day is in tune with your approach (some moves are too small for medium-term traders, and some might appear too big for day-traders).
Additionally, you might want to read why our stop-loss orders are usually relatively far from the current price.
Please note that a full position doesn't mean using all of the capital for a given trade. You will find details on our thoughts on gold portfolio structuring in the Key Insights section on our website.
As a reminder - "initial target price" means exactly that - an "initial" one. It's not a price level at which we suggest closing positions. If this becomes the case (like it did in the previous trade), we will refer to these levels as levels of exit orders (exactly as we've done previously). Stop-loss levels, however, are naturally not "initial", but something that, in our opinion, might be entered as an order.
Since it is impossible to synchronize target prices and stop-loss levels for all the ETFs and ETNs with the main markets that we provide these levels for (gold, silver and mining stocks - the GDX ETF), the stop-loss levels and target prices for other ETNs and ETF (among other: UGL, GLL, AGQ, ZSL, NUGT, DUST, JNUG, JDST) are provided as supplementary, and not as "final". This means that if a stop-loss or a target level is reached for any of the "additional instruments" (GLL for instance), but not for the "main instrument" (gold in this case), we will view positions in both gold and GLL as still open and the stop-loss for GLL would have to be moved lower. On the other hand, if gold moves to a stop-loss level but GLL doesn't, then we will view both positions (in gold and GLL) as closed. In other words, since it's not possible to be 100% certain that each related instrument moves to a given level when the underlying instrument does, we can't provide levels that would be binding. The levels that we do provide are our best estimate of the levels that will correspond to the levels in the underlying assets, but it will be the underlying assets that one will need to focus on regarding the signs pointing to closing a given position or keeping it open. We might adjust the levels in the "additional instruments" without adjusting the levels in the "main instruments", which will simply mean that we have improved our estimation of these levels, not that we changed our outlook on the markets. We are already working on a tool that would update these levels daily for the most popular ETFs, ETNs and individual mining stocks.
Our preferred ways to invest in and to trade gold along with the reasoning can be found in the how to buy gold section. Furthermore, our preferred ETFs and ETNs can be found in our Gold & Silver ETF Ranking.
As a reminder, Gold & Silver Trading Alerts are posted before or on each trading day (we usually post them before the opening bell, but we don't promise doing that each day). If there's anything urgent, we will send you an additional small alert before posting the main one.
Thank you.
Przemyslaw Radomski, CFA
Founder, Editor-in-chief

