

Briefly: in our opinion, full (300% of the regular position size) speculative short positions in mining stocks are justified from the risk/reward point of view at the moment of publishing this Alert.
It’s really hard to get a more bearish combination of factors for gold than what we just saw.
A good way to start the discussion would be to reply to a question that I received about the USD Index recently.
Hi, I have been reading your articles about the USD bottoming and moving in a similar pattern to 2018. I am seeing a possible head and shoulder pattern on Jan 18th (left shoulder), Feb 5th (the head), and Feb 17th (right shoulder). For all its problems, the euro seems to be going higher and higher. Just wondering what your thoughts are.
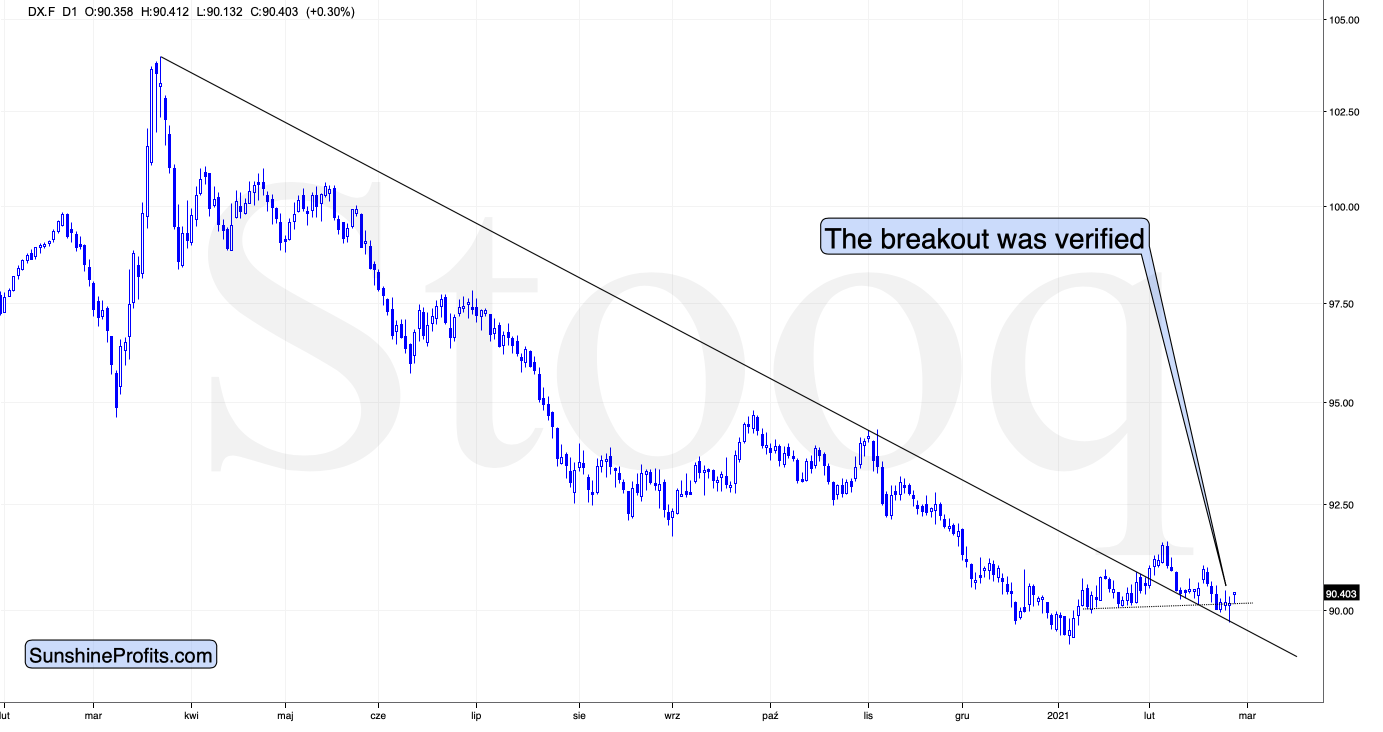
Figure 1
Indeed, the head-and-shoulders pattern formed as you described it (I added a dotted neckline to the formation on the above chart), but since it wasn’t as significant as the breakout above the declining medium-term resistance line, the implications of the latter overwhelmed the bearish implications of the H&S formation. The USD index invalidated the breakdown below the neck level of the formation, so what was previously a sell signal, has now turned into a buy signal. Consequently, we have yet another reason to expect higher values of the USD Index in the following weeks and months.
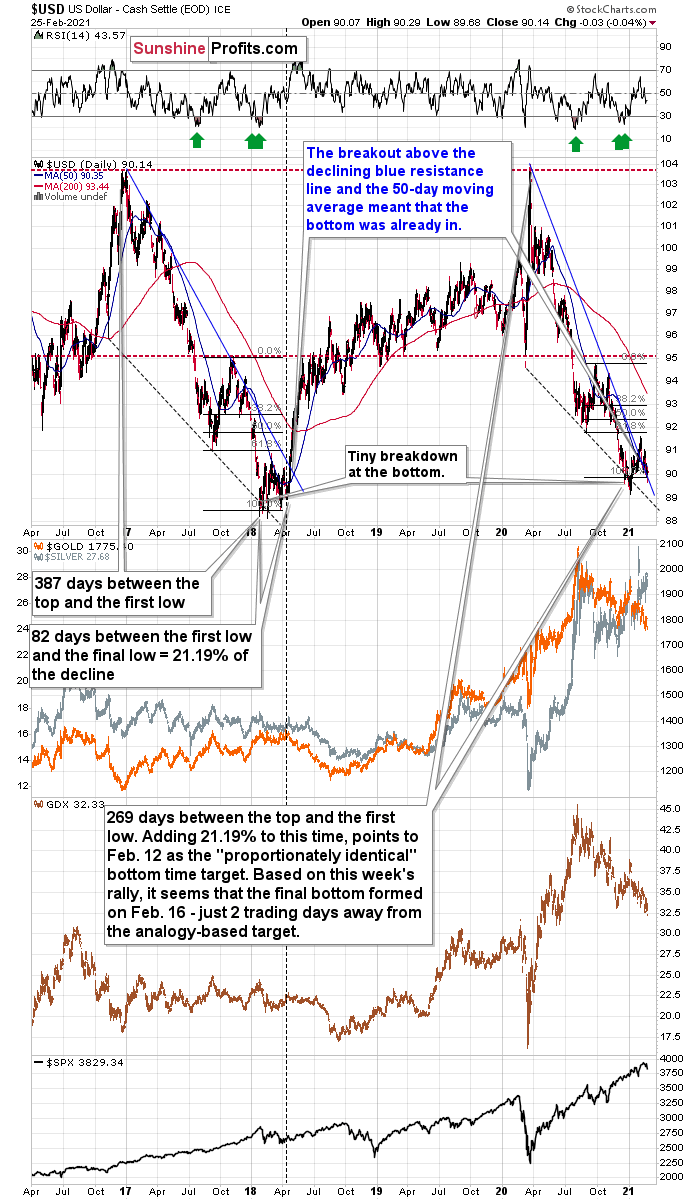
Figure 2
Based on the obvious similarity to early 2018, the verification of the breakdown is likely the final step before a major rally in the USDX. This will likely translate into lower precious metals and mining stock prices, especially if the general stock market declines as well.
Let’s use another question that I received to segue to the following part of the analysis.
What happens to gold if the dollar crashes, instead of going up?
That’s just what happened early during the day, yesterday (Feb. 25). Well, it was just intraday action rather than a big medium-term crash, however, it shows what could happen. Simply put, gold declined anyway. Why did it do so? Because it wanted to do so based on technical/emotional factors. Maybe that was just a temporary reversion in direction? No – when the USD Index came back up, gold declined even more, and we see the continuation of this pattern today as well.
What if the USD Index declines much more? The last time when gold was trading at these levels in 2020, the USD Index was trading at about 100. The latter declined about 10 index points and gold is at the same level. So, gold has already proven its ability to ignore the USD’s declines. There will be a time, when gold soars in response to even mild declines in the USDX, but this is likely to happen only after gold declines significantly – and it “wants” to rally.
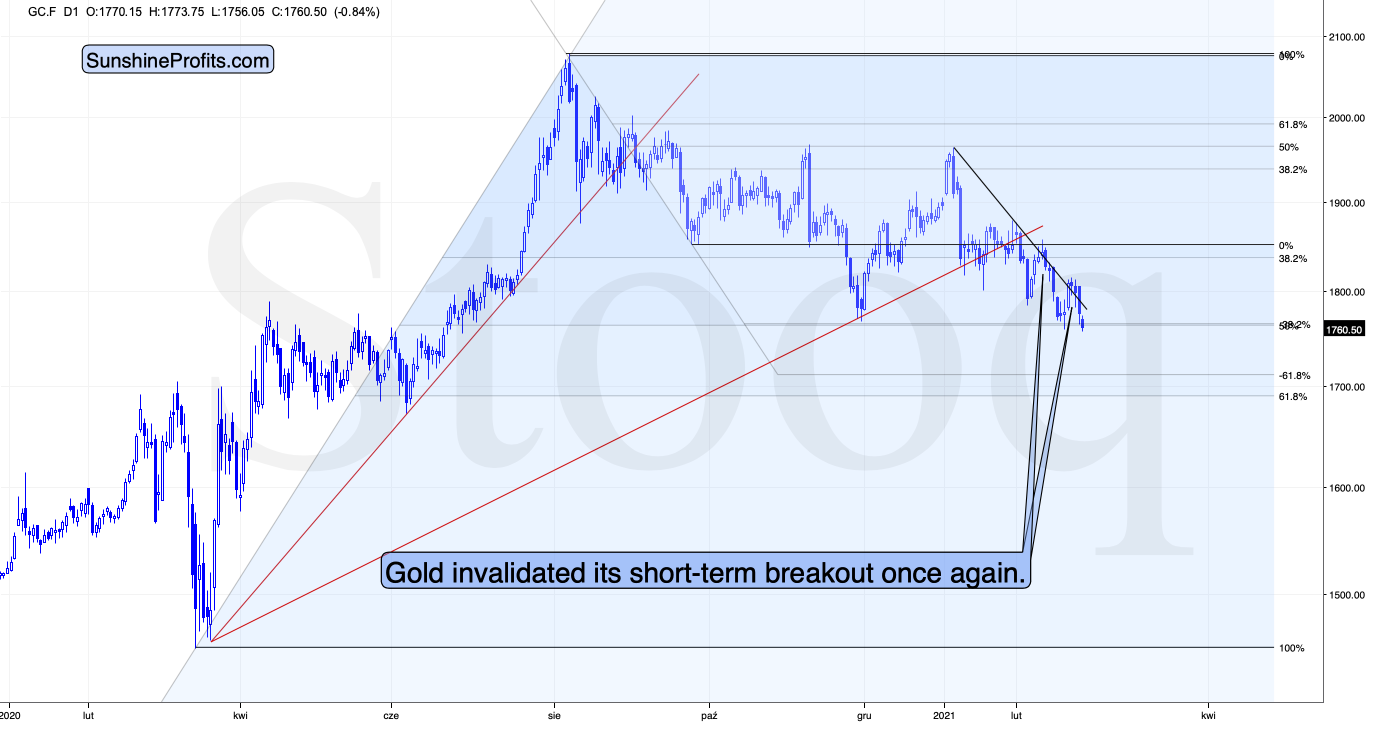
Figure 3
In previous analyses, I commented on the above chart in the following way:
The move higher in gold was notable, but nothing game changing. The last time gold moved above the declining short-term resistance line, was when it actually topped. The invalidation of the breakdown marked the start of another very short-term decline. The small decline in today’s overnight trading might be the very beginning of this invalidation that leads to another slide.
That’s exactly what happened. The failed breakout led to another slide and gold is currently right after its breakdown to new 2021 lows. The road to ~$1,700 gold is now fully open. That’s when gold would be likely to take some sort of breather and gather strength (well, weakness, but “gathering weakness” just doesn’t sound right) for another wave down – likely to $1,500 or so.
Please note that gold didn’t close at new yearly lows yesterday. This observation is important in comparison with the fact that…
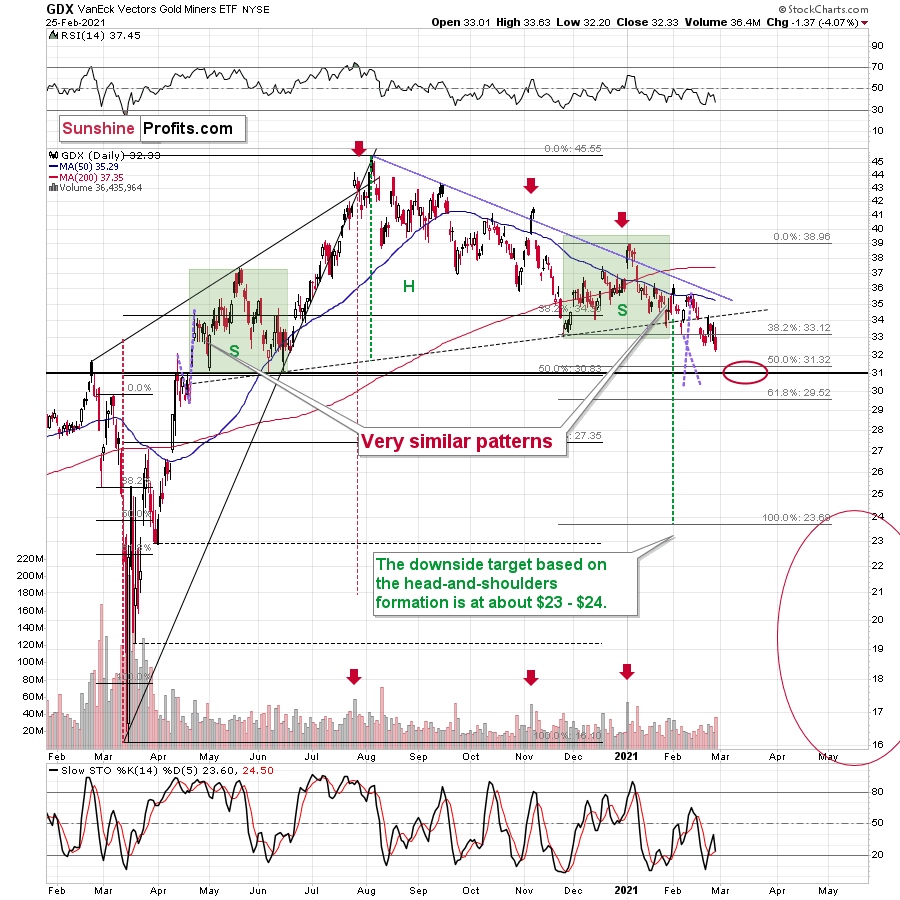
Figure 4
Mining stocks did.
Miners closed at new 2021 lows yesterday, even though gold didn’t, which once again proves their weakness and once again confirms the bearish outlook.
I previously wrote that gold’s ~$1,700 target is likely to be aligned with the GDX’s ~$31 target and this remains up-to-date. After that, I expect some kind of corrective upswing – perhaps to $33 or so, and then another – big – move lower. Please note that the corrective upswing would be yet another (and final) verification of the head and shoulders pattern, and its very bearish implications would take place only after this verification. That’s why I expect the decline to be particularly significant. You can read more about this broad H&S pattern over here.
Silver just went through a triangle-vertex-based reversal, and it seems to have indeed triggered a reversal.
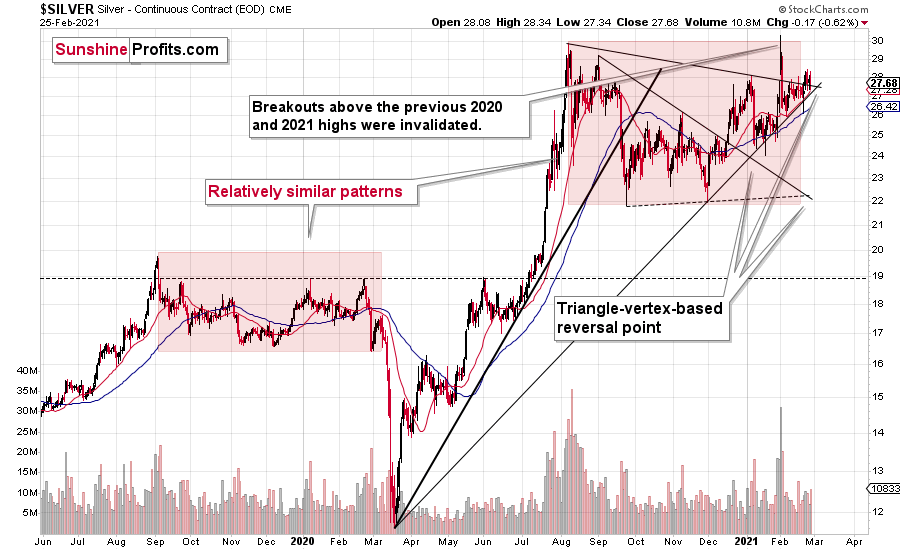
Figure 5
Silver moved a bit higher on Wednesday (Feb. 24) and in yesterday’s early trading, but it didn’t exceed the recent high. This means that my previous comments on the above chart remain up-to-date:
The move lower is not yet super significant, but given the reversal point, it could just be the beginning. Remember the triangle-vertex-based reversal at the beginning of the year? Back then, practically nobody wanted to believe that silver and the precious metals market was topping at that time. It was the truth, though. Gold and mining stocks were never higher since that time and the same thing would have most likely happened to silver if it wasn’t the #silversqueeze popularity that gave it its most recent boost.
Now, there’s also another triangle-vertex-based-reversal in a few days, and since these reversals tend to work on a near-to basis, silver might top any day now, even if it hasn’t topped earlier today.
Based on what’s happening in the markets right now, it seems just as possible that silver and the rest of the precious metals market will form a temporary bottom within the next few days.
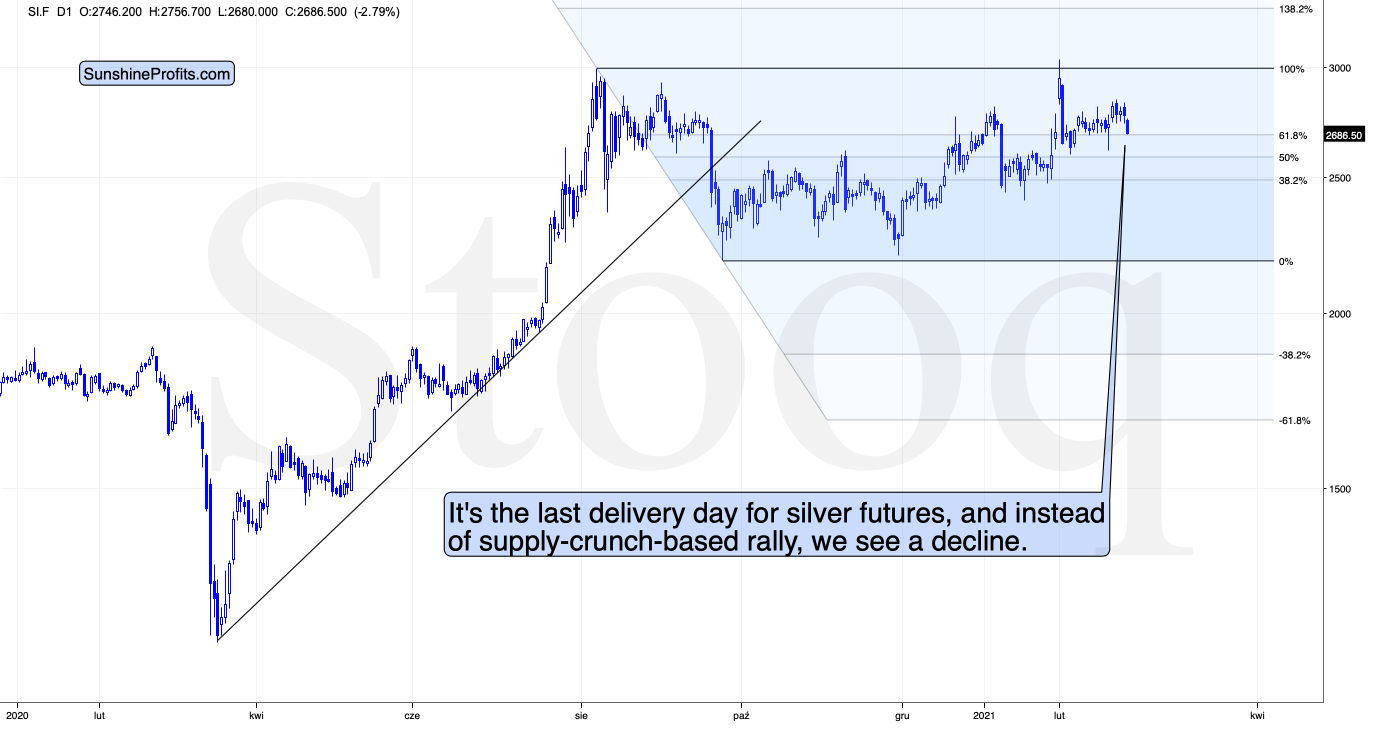
Figure 6
Moreover, please note that it’s the last delivery day for silver futures, and instead of a supply-crunch-based rally, we see a decline. Naturally, this is bearish.
Having said that, let’s consider the more fundamental side of things.
The Perfect Storm
With the U.S. 10-Year Treasury yield becoming increasingly unhinged, the benchmark interest rate surged by 11.59% on Feb. 25. Ducking for cover, gold fell by 1.25%.
For weeks, I’ve been warning that a bond market sell-off could impact nearly every corner of the financial markets. And with the latest earthquake leaving U.S. equities suddenly shaken, Big Tech’s impact on the PMs was felt once again.
On Feb. 24, I wrote that rising interest rates are spreading like wildfire, and if uncontained, they could engulf everything from equities to the PMs. As for the potential impact on the precious metals, it’s important to distinguish orderly equity drawdowns from liquidity events.
Why so?
Because on Feb. 25, we witnessed a re-enactment of the latter.
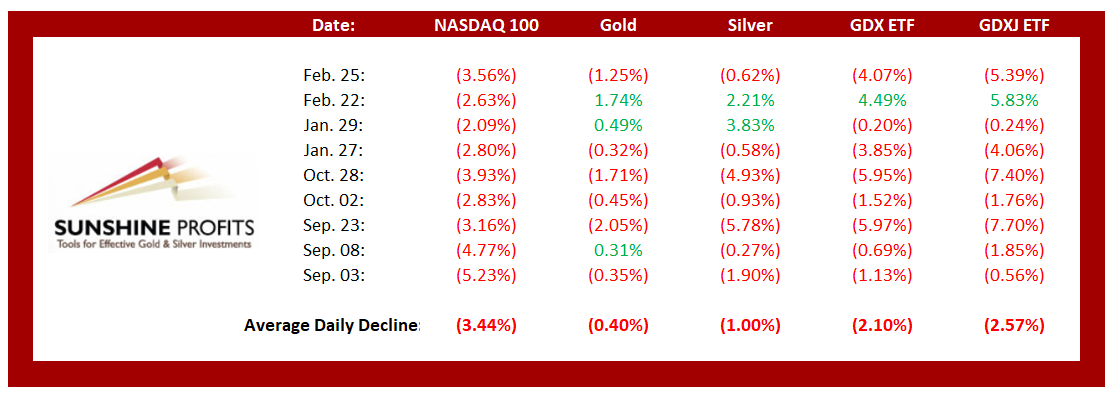
Figure 7
If you analyze the table above, you can see that the NASDAQ 100 drawdowns of more than 2.00% tend to unnerve the PMs. Moreover, if you exclude silver’s short squeeze on Jan. 29 and the NASDAQ 100’s relatively ‘quiet’ 2.63% drawdown on Feb. 22, bouts of equity volatility significantly impact the PMs (especially the miners).
As the source of the panic, the U.S. 7-Year Treasury yield absolutely exploded on Feb. 25.
At auction, the Treasury’s bid-to-cover ratio plunged from 2.305 to 2.045 – the lowest level on record and well below its 2.35 short-term average – with the yield surging by 20.59% (the red box below).
For context, the bid-to-cover ratio tallies the dollar bids received during a Treasury auction relative to the dollar amount being sold. In a nutshell: the lower the bid-to-cover ratio, the less demand there is for Treasuries.
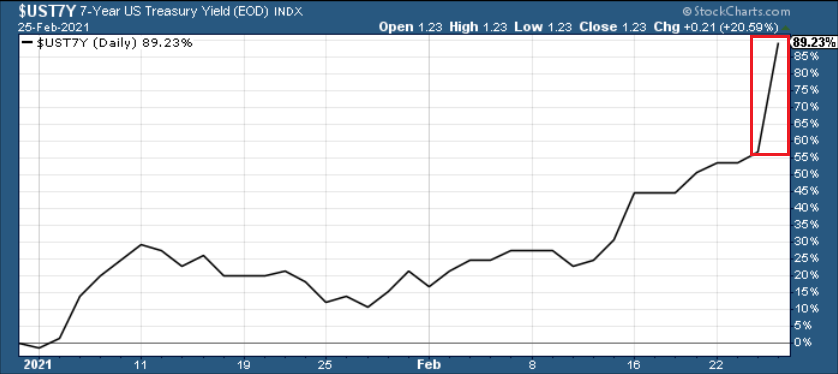
Figure 8
Even more revealing, indirect bids – that often come from foreign entities – declined from 64.10% to 38.06%, the lowest level since 2014.
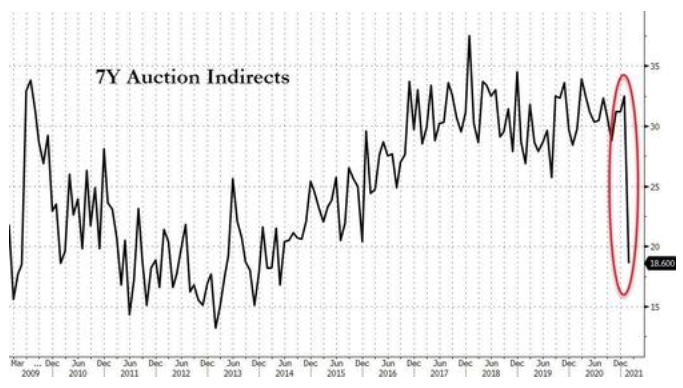
Figure 9 - Source: ZeroHedge
To explain, the black line above depicts indirect demand for U.S. Treasuries. If you focus on the red circle, you can see that foreign investors currently have little appetite for U.S. debt.
As part of the Treasuries’ reaction function, surging nominal yields have also lifted the U.S. 10-year real yield (inflation-adjusted) to a roughly eight-month high.
Please see below:
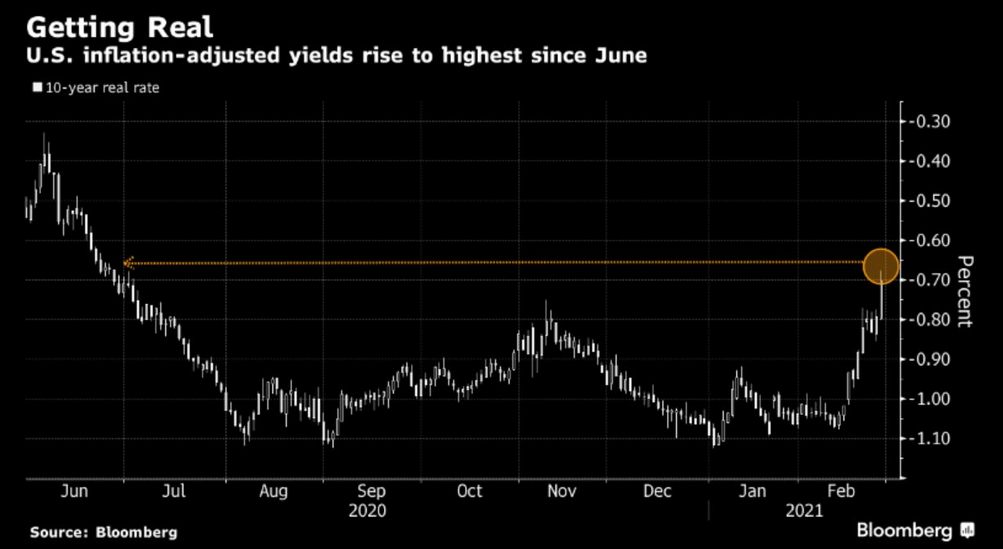
Figure 10
For context, I wrote on Dec. 28:
When real yields are negative (meaning the expected inflation rate is greater than the nominal interest rate), it’s bullish for gold, because the yellow metal offers a higher potential return than owning government bonds. Conversely, when real yields are positive (or become less negative), the opposite occurs.
If the average U.S. Treasury yield repeats its historical pattern, then nominal interest rates have plenty of room to move higher. And following right along, they will lift real yields in the process (unless the expected inflation rate swells, which is unlikely). The potential development is extremely bearish for gold, because it decreases gold’s attractiveness relative to government bonds. So, while pundits keep reiterating that “this time is different,” history suggests otherwise.
Exacerbating the sell-off, Commodity Trading Advisors (CTAs) were frantically dumping Treasury futures on Feb. 25. For context, CTAs manage professional futures portfolios and often employ computer-driven (quant) strategies in their attempts to deliver alpha.
Please see below:
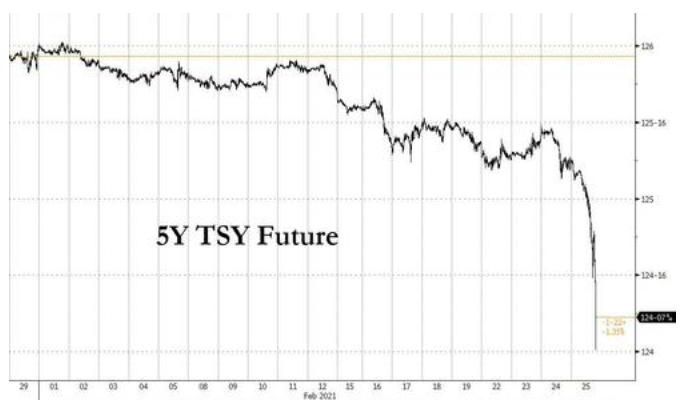
Figure 11 - Source: ZeroHedge
To explain, weak auction demand and the subsequent rip higher in the U.S. 7-Year Treasury yield led to a liquidation event in the futures market. In a nutshell: with CTAs’ bracing for higher yields, owning bond futures (which move inversely of yields and benefit when interest rates fall) became hazardous to their portfolio’s health.
At the same time, CME Group, the world's largest derivatives exchange, reported on Feb. 25 that its Ultra 10-Year Note futures contract (1.7 million) and its 30-Year Bond futures contract (1.8 million) traded in record volume on Feb. 23.
Please see below:
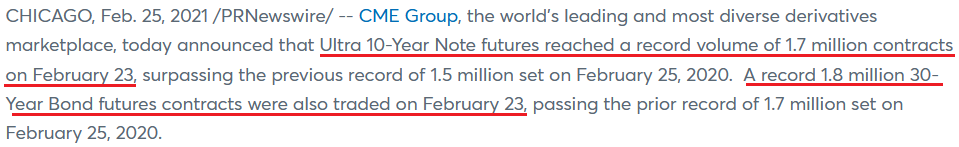
Moreover, after surpassing 1.57% on the day, the Ultra 10-Year Note futures contract is now trading at its highest level since February 2020.
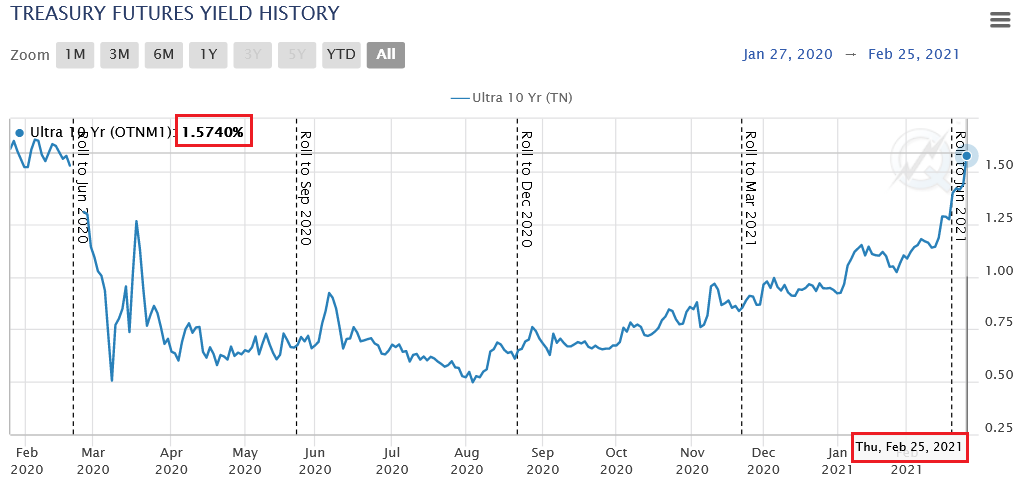
Figure 12 - Source: CME Group
In addition, Nomura quant analyst Masanari Takada told clients that “the momentum behind systematic bear trades in bond futures is looking increasingly difficult to rein in” and that “CTAs’ selling of bond futures has gotten so relentless as to look a little unnatural.” However, he also mentioned that CTAs’ net-short positioning is in the 85th percentile (dating back to 2009). As a result, CTAs’ selling activity could be ripe for a reversal.
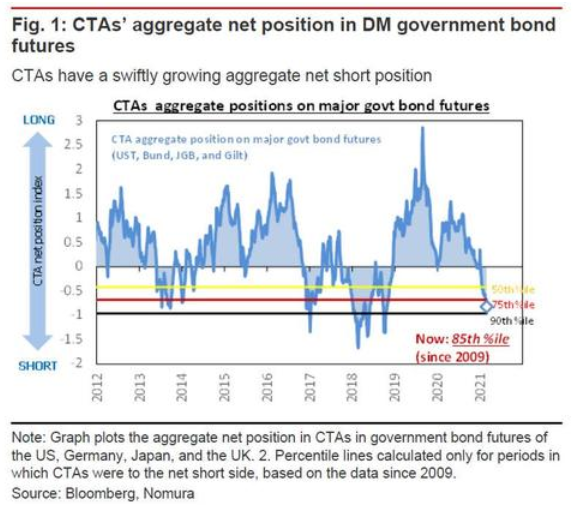
Figure 13
Conversely, if the surge in U.S. Treasury yields continues, the PMs could be in trouble. I wrote previously that gold topped (on Aug. 7), exactly one day after the U.S. 10-Year Treasury yield bottomed (Aug. 6). And continuing to head their separate ways, the negative correlation remains on full display.
Please see below:
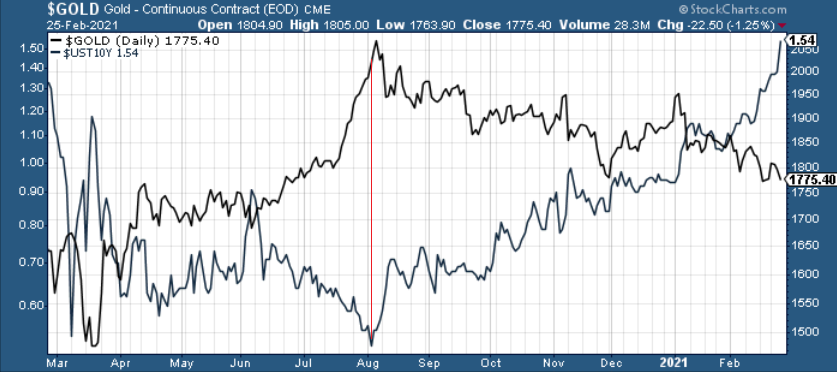
Figure 14
Even more unnerving for the PMs, amid the surge in U.S. Treasury yields, the USD Index hasn’t participated. Since 2003, a bottom and subsequent move higher in the U.S. 10-Year Treasury yield has coincided with a rise in the USD Index 80% of the time.
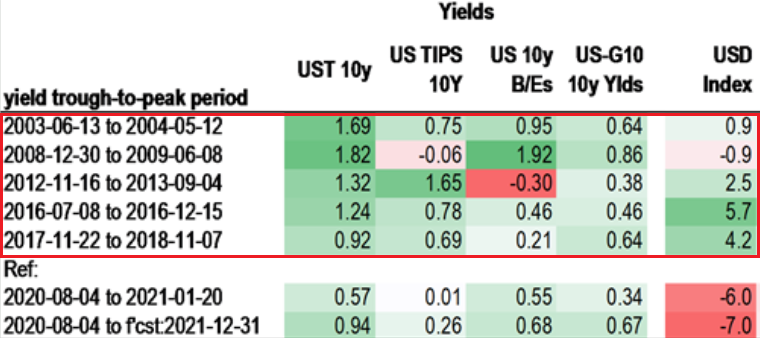
Figure 15
However, since the U.S. 10-year Treasury yield bottomed in August, the USD Index has continued to decline. As a result, if the USD Index decides to join the party, given its strong negative correlation with gold, the combination could deliver a knockout punch.
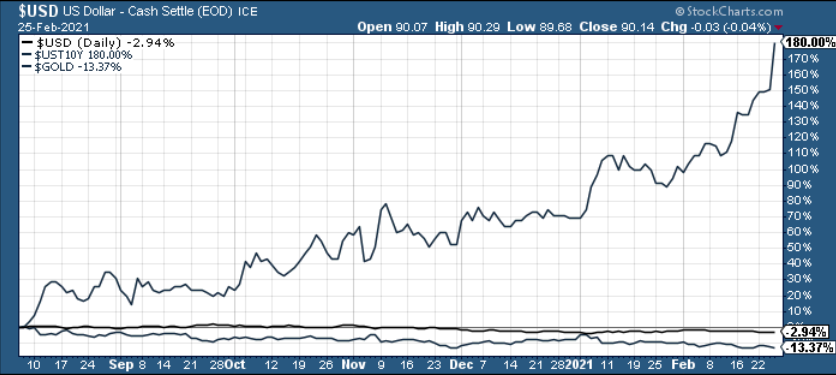
Figure 16
In conclusion, the U.S. yield curve is in the midst of a liquidity revolt. And despite attempting to keep their heads above the water, the PMs’ relief rallies have become increasingly short-lived. Despite numerous attempts to fight the current, the waves continue to pull them under. And looking ahead, that’s unlikely to change. However, in time, after the above developments run their course, the PMs terrain will eventually become less treacherous.
Overview of the Upcoming Part of the Decline
- I expect the initial bottom to form with gold falling to roughly $1,700, and I expect the GDX ETF to decline to about $31 - $32 at that time. I then plan to exit the short positions in the miners and I will consider long positions in the miners at that time – in order to benefit from the likely rebound.
- I expect the above-mentioned decline to take another 1 – 7 weeks to materialize and I expect the rebound to take place during 1-3 weeks.
- After the rebound (perhaps to $33 - $34 in the GDX), I plan to get back in with the short position in the mining stocks.
- Then, after miners slide once again in a meaningful and volatile way, but silver doesn’t (and it just declines moderately), I plan to switch from short positions in miners to short positions in silver (this could take another 1-4 weeks to materialize). I plan to exit those short positions when gold shows substantial strength relative to the USD Index, while the latter is still rallying. This might take place with gold close to $1,500 and the entire decline (from above $1,700 to about $1,500) would be likely to take place within 1-10 weeks and I would expect silver to fall hardest in the final part of the move. This moment (when gold performs very strongly against the rallying USD and miners are strong relative to gold – after gold has already declined substantially) is likely to be the best entry point for long-term investments in my view. This might happen with gold close to $1,500, but it’s too early to say with certainty at this time.
- Consequently, the entire decline could take between 3 and 20 weeks, while the initial part of the decline (to $1,700 in gold) is likely to take between 1 and 7 weeks.
- If gold declines even below $1,500 (say, to ~$1350 or so), then it could take another 10 weeks or so for it to bottom, but this is not what I view as a very likely outcome.
- As a confirmation for the above, I will use the (upcoming or perhaps we have already seen it?) top in the general stock market as the starting point for the three-month countdown. The reason is that after the 1929 top, gold miners declined for about three months after the general stock market started to slide. We also saw some confirmations of this theory based on the analogy to 2008. All in all, the precious metals sector would be likely to bottom about three months after the general stock market tops .
- The above is based on the information available today and it might change in the following days/weeks.
Summary
To summarize, the PMs’ short-term downswing has likely just begun, as miners broke below the neck level of their almost-yearly head-and-shoulders formation. We saw a small invalidation, but we don’t trust its bullish implications – we just saw something similar that failed to ignite a lasting rally and the USD’s decline seems to be a normal, post-breakout pullback.
In addition, because we’re likely entering the “winter” part of the Kondratiev cycle (just like in 1929 and then the 1930s), the outlook for the precious metals’ sector remains particularly bearish during the very first part of the cycle, when cash is king.
Silver’s strength seems bullish at first sight, but taking a closer look at this move, and comparing it with previous cases (when silver got so much attention) and with miners’ weakness, provides us with bearish implications for the medium term.
The confirmed breakout in the USD Index is yet another confirmation of the bearish outlook for the precious metals market.
Naturally, everyone's trading is their responsibility. But in our opinion, if there ever was a time to either enter a short position in the miners or increase its size if it was not already sizable, it's now. We made money on the March decline, and on the March rebound, with another massive slide already underway.
After the sell-off (that takes gold to about $1,500), we expect the precious metals to rally significantly. The final part of the decline might take as little as 1-5 weeks, so it's important to stay alert to any changes.
Most importantly, please stay healthy and safe. We made a lot of money on the March decline and the subsequent rebound (its initial part) price moves (and we'll likely earn much more in the following weeks and months), but you have to be healthy to enjoy the results.
As always, we'll keep you - our subscribers - informed.
To summarize:
Trading capital (supplementary part of the portfolio; our opinion): Full speculative short positions (300% of the full position) in mining stocks is justified from the risk to reward point of view with the following binding exit profit-take price levels:
Senior mining stocks (price levels for the GDX ETF): binding profit-take exit price: $31.22; stop-loss: none (the volatility is too big to justify a stop-loss order in case of this particular trade); binding profit-take level for the DUST ETF: $24.88; stop-loss for the DUST ETF: none (the volatility is too big to justify a SL order in case of this particular trade)
Junior mining stocks (price levels for the GDXJ ETF): binding profit-take exit price: $42.72; stop-loss: none (the volatility is too big to justify a stop-loss order in case of this particular trade); binding profit-take level for the JDST ETF: $14.19; stop-loss for the JDST ETF: none (the volatility is too big to justify a SL order in case of this particular trade)
For-your-information targets (our opinion; we continue to think that mining stocks are the preferred way of taking advantage of the upcoming price move, but if for whatever reason one wants / has to use silver or gold for this trade, we are providing the details anyway. In our view, silver has greater potential than gold does):
Silver futures downside profit-take exit price: unclear at this time - initially, it might be a good idea to exit, when gold moves to $1,703.
Gold futures downside profit-take exit price: $1,703
Symbols to be on a lookout for in case of possible future transactions (leveraged and non-leveraged):
Gold: GLD (non-leveraged, regular), UGL (2x leverage, regular), GLL (2x leverage, inverse)
Silver: SLV (non-leveraged, regular), AGQ (2x leverage, regular), ZSL (2x leverage, inverse)
Mining stocks:
Senior mining stocks: GDX (non-leveraged, regular), NUGT (2x leverage, regular), DUST (2x leverage, inverse)
Junior mining stocks: GDXJ (non-leveraged, regular), JNUG (2x leverage, regular), JDST (2x leverage, inverse)
-----
Long-term capital (core part of the portfolio; our opinion): No positions (in other words: cash
-----
Insurance capital (core part of the portfolio; our opinion): Full position
Whether you already subscribed or not, we encourage you to find out how to make the most of our alerts and read our replies to the most common alert-and-gold-trading-related-questions.
Please note that we describe the situation for the day that the alert is posted in the trading section. In other words, if we are writing about a speculative position, it means that it is up-to-date on the day it was posted. We are also featuring the initial target prices to decide whether keeping a position on a given day is in tune with your approach (some moves are too small for medium-term traders, and some might appear too big for day-traders).
Additionally, you might want to read why our stop-loss orders are usually relatively far from the current price.
Please note that a full position doesn't mean using all of the capital for a given trade. You will find details on our thoughts on gold portfolio structuring in the Key Insights section on our website.
As a reminder - "initial target price" means exactly that - an "initial" one. It's not a price level at which we suggest closing positions. If this becomes the case (like it did in the previous trade), we will refer to these levels as levels of exit orders (exactly as we've done previously). Stop-loss levels, however, are naturally not "initial", but something that, in our opinion, might be entered as an order.
Since it is impossible to synchronize target prices and stop-loss levels for all the ETFs and ETNs with the main markets that we provide these levels for (gold, silver and mining stocks - the GDX ETF), the stop-loss levels and target prices for other ETNs and ETF (among other: UGL, GLL, AGQ, ZSL, NUGT, DUST, JNUG, JDST) are provided as supplementary, and not as "final". This means that if a stop-loss or a target level is reached for any of the "additional instruments" (GLL for instance), but not for the "main instrument" (gold in this case), we will view positions in both gold and GLL as still open and the stop-loss for GLL would have to be moved lower. On the other hand, if gold moves to a stop-loss level but GLL doesn't, then we will view both positions (in gold and GLL) as closed. In other words, since it's not possible to be 100% certain that each related instrument moves to a given level when the underlying instrument does, we can't provide levels that would be binding. The levels that we do provide are our best estimate of the levels that will correspond to the levels in the underlying assets, but it will be the underlying assets that one will need to focus on regarding the signs pointing to closing a given position or keeping it open. We might adjust the levels in the "additional instruments" without adjusting the levels in the "main instruments", which will simply mean that we have improved our estimation of these levels, not that we changed our outlook on the markets. We are already working on a tool that would update these levels daily for the most popular ETFs, ETNs and individual mining stocks.
Our preferred ways to invest in and to trade gold along with the reasoning can be found in the how to buy gold section. Furthermore, our preferred ETFs and ETNs can be found in our Gold & Silver ETF Ranking.
As a reminder, Gold & Silver Trading Alerts are posted before or on each trading day (we usually post them before the opening bell, but we don't promise doing that each day). If there's anything urgent, we will send you an additional small alert before posting the main one.
Thank you.
Przemyslaw Radomski, CFA
Founder, Editor-in-chief

