

Briefly: in our opinion, full (300% of the regular position size) speculative short positions in mining stocks are justified from the risk/reward point of view at the moment of publishing this Alert.
The U.S. Labor Day is almost there, and thus the time for gold’s rally is running out. Tick-tock, tick-tock… and then the party stops.
Chart analysis is a very interesting activity. You need to keep your mind open, your cognitive and emotional biases at bay, you have to stay humble, as you always have something new to discover, and you might need to change your mind in a flash. Moreover, the indications can arrive from all over the place. You can expect that the key signal will come from this price analysis technique, or that one, or maybe based on the price link between some assets. Or it could even be the case that it will not be the price or volume that will be critical in a given situation… but time.
The cyclical nature of many areas of life is present in the markets, and it is usually the case that the seasonal factors have only a mild effect on the prices and other factors are much more important, as they are specific to a given situation. Sometimes, however, we have a recurring event that’s so precise in its implications and so accurate that its importance could dwarf other techniques.
This could be the case with gold’s post-U.S.-Labor-Day performance.
A poet might say that at that time a golden dolphin jumps joyfully into the air, shining briefly in the evening sun, preparing for a deep and dangerous dive.
A data scientist might say that 10 out of 10 efficiency with regard to short-term implications and 8 out of 10 performance with regard to medium-term implications is something that seems opposite to the efficient market theory, even in its weak form.
And a trader might say “great! let’s make some money on it!”
I’ll let you be the judge as to which approach is best, while I will feature my observations regarding gold’s price performance around the U.S. Labor Day.
And yes, I did feature this chart yesterday, but I think I haven’t given enough emphasis on how important it is currently.
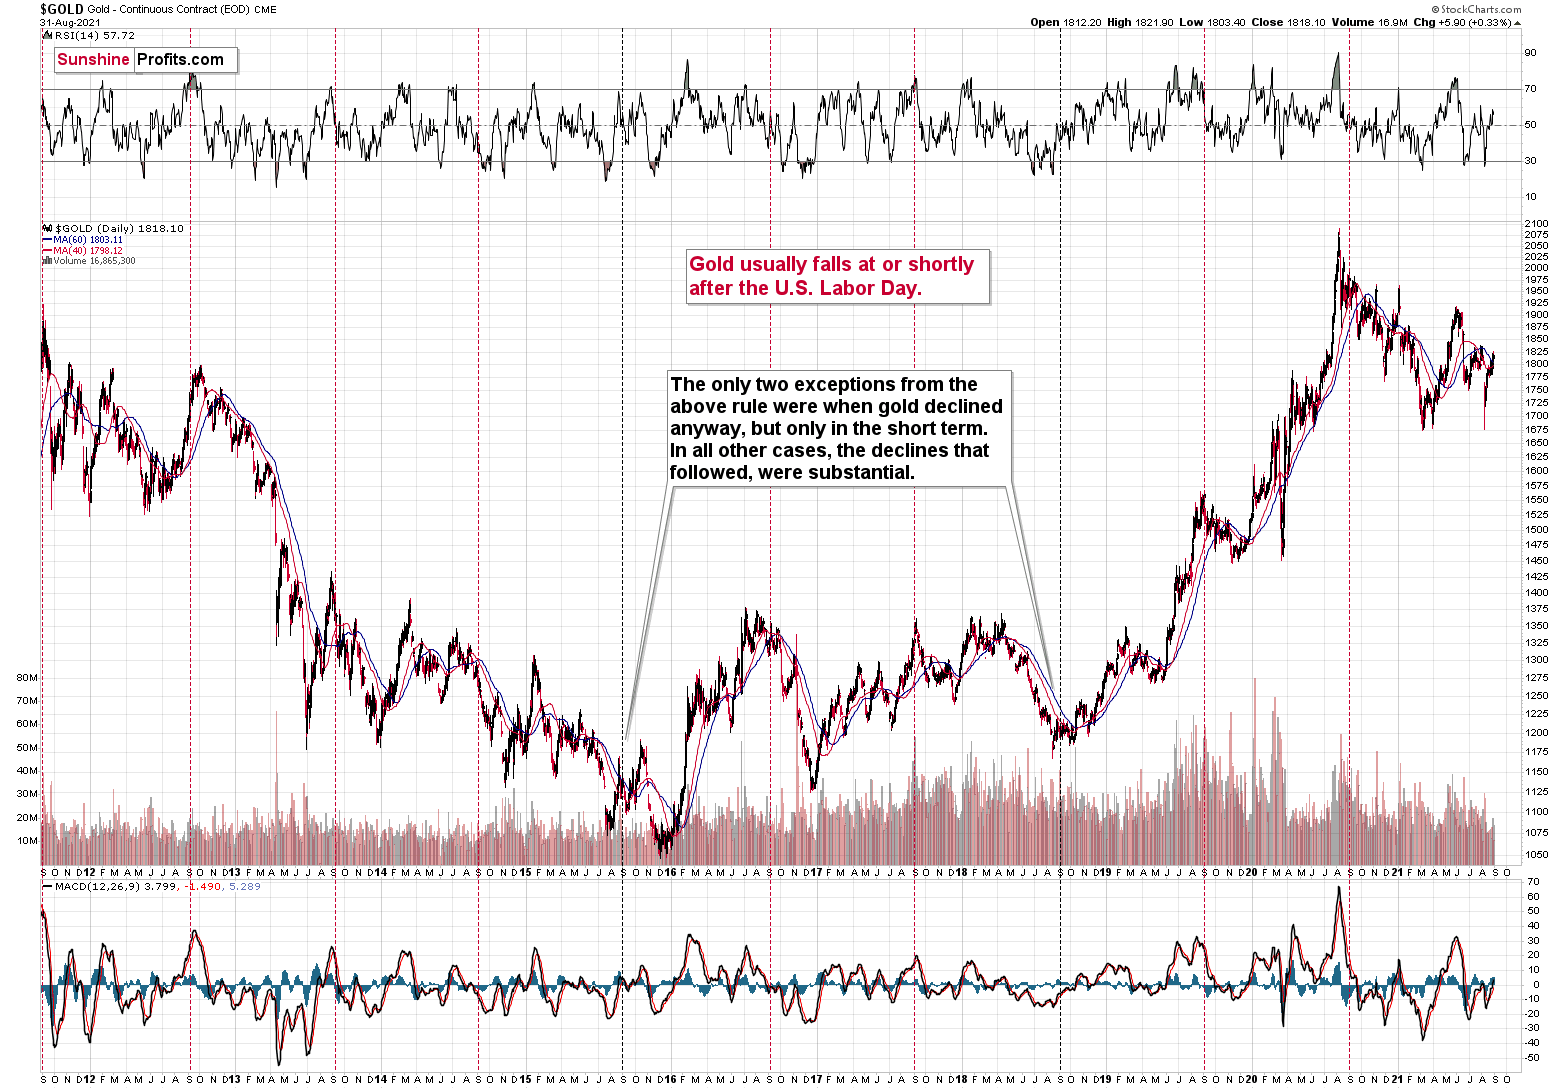
We’re now less than one week away from the U.S. Labor Day, which is particularly important for the gold price movement.
You see, in the previous 10 years, gold almost always declined profoundly right after the U.S. Labor Day — I marked that on the above chart with red, dashed lines. There were only two cases (in 2015 and in 2018) when gold didn’t slide profoundly after that day, but… it was when gold declined in the short term anyway. There was simply no major downswing later.
In other words, in all 10 out of the previous 10 years, gold moved lower in the short term after the U.S. Labor Day. Of course, it’s debatable what one describes as the short term. In this case, I mean a period between a few days and a few weeks. Then again, if you look at the chart, it’s clear what we can expect. Please have a look at how far gold usually fell (red lines) and how far it fell during the exceptionally bullish years when it declined just in the short run.
This is very important, as it tells us that even if gold doesn’t decline this week, it will be very likely to do so based on this surprisingly accurate cyclicality.
There are other short-term indications confirming gold’s bearish outlook as well.
The USD Index, for example, moved to the neck level of its previous inverse head-and-shoulders pattern before forming a daily reversal.
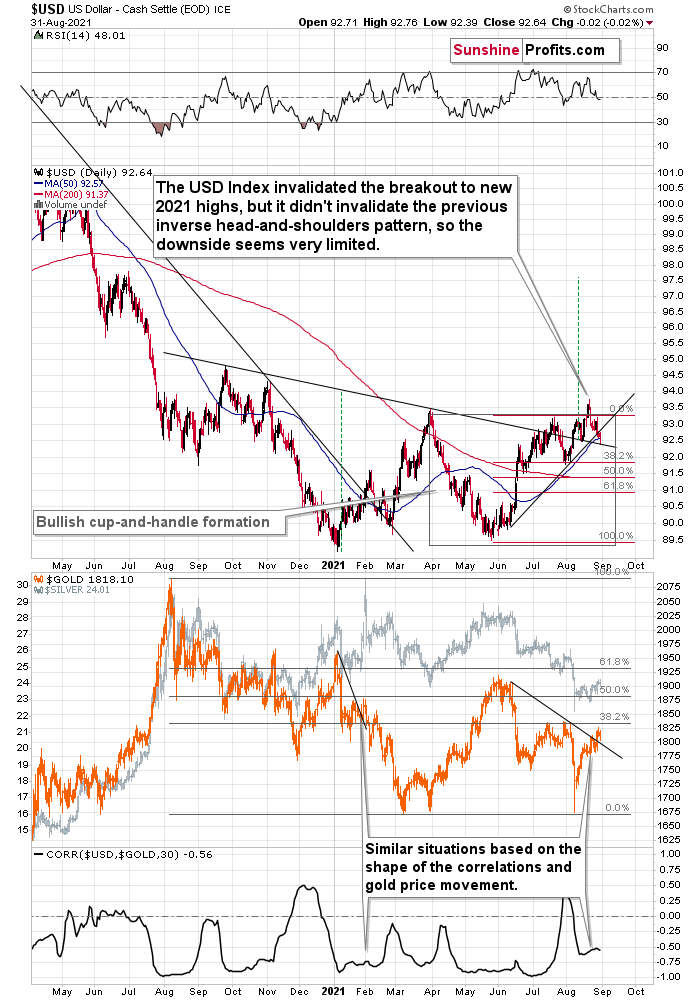
Both the daily reversal and the fact that the move above the neck level was not invalidated are bullish for the USD Index.
This is bearish for gold not only on its own but also because, in response to the USD’s move to new short-term lows, gold didn’t move to new short-term highs.
And what about silver?
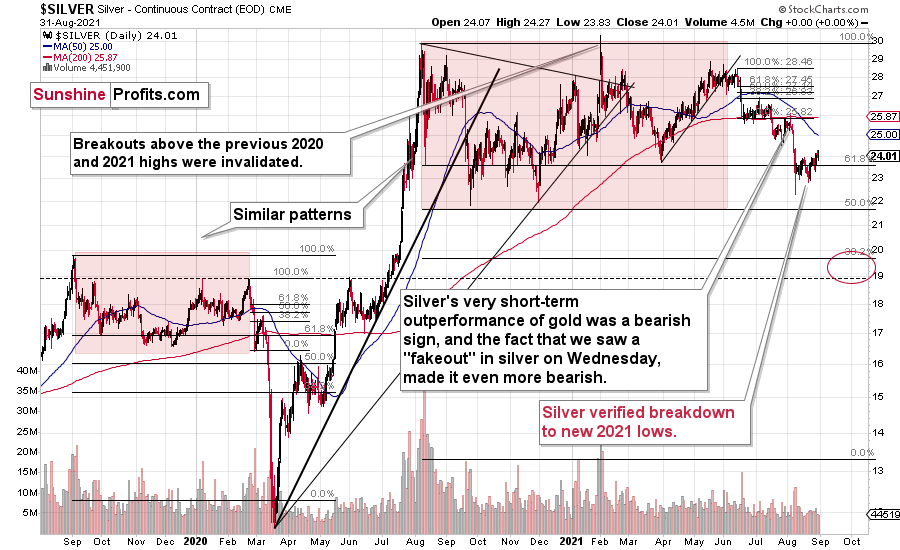
Well, nothing. Just as silver was previously trading below its previous highs, it’s trading there also today. The white metal didn’t close back above the previous 2021 low in terms of the closing prices, so nothing has really changed. The verification of the breakdown to new lows appears to be complete. This means that another big slide is to be expected.
A Dramatic Hesitation
Mining stocks moved a bit higher yesterday, but they pretty much closed where they closed also on Friday.
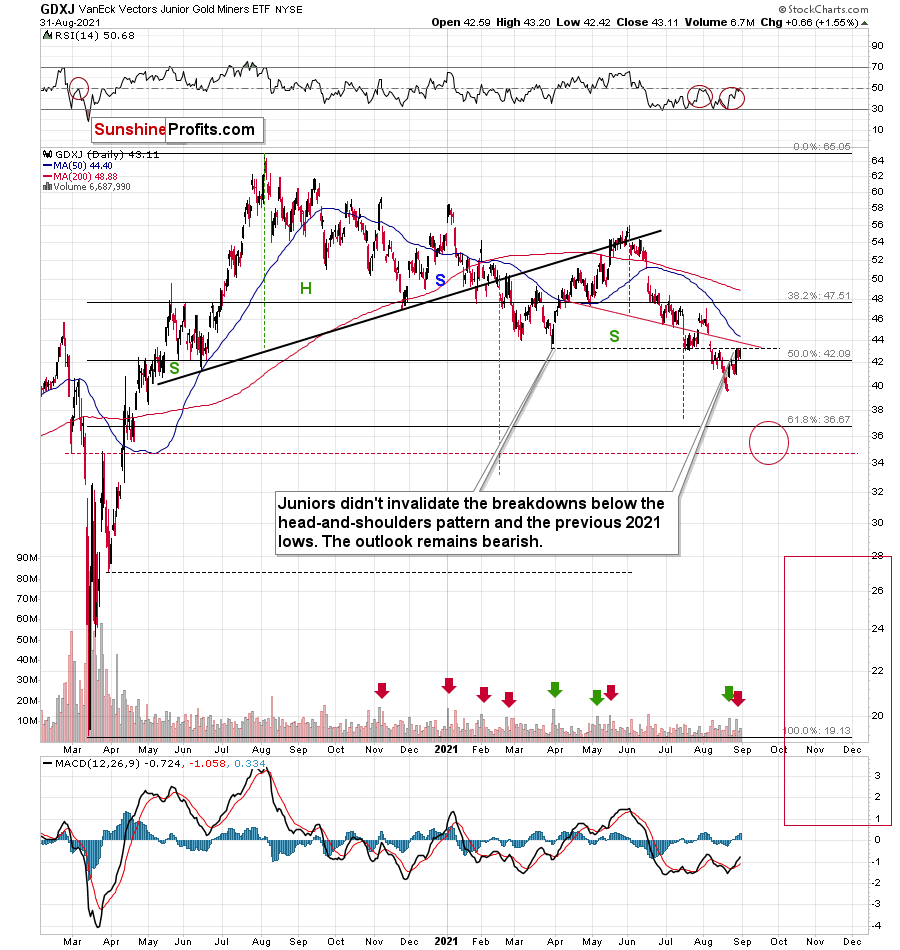
Yesterday, I referred to the GDXJ’s verification of the previous breakdown to new yearly lows as a final good-bye kiss, and, well, it seems that the GDXJ actually needed two kisses to part ways with this level. And – combining it with the U.S. Labor Day cyclicality – it could even be the case that this “dramatic hesitation” will continue until the end of the week or so, but in the end, the next move in the GDXJ is likely to be down. And it’s likely to slide truly profoundly.
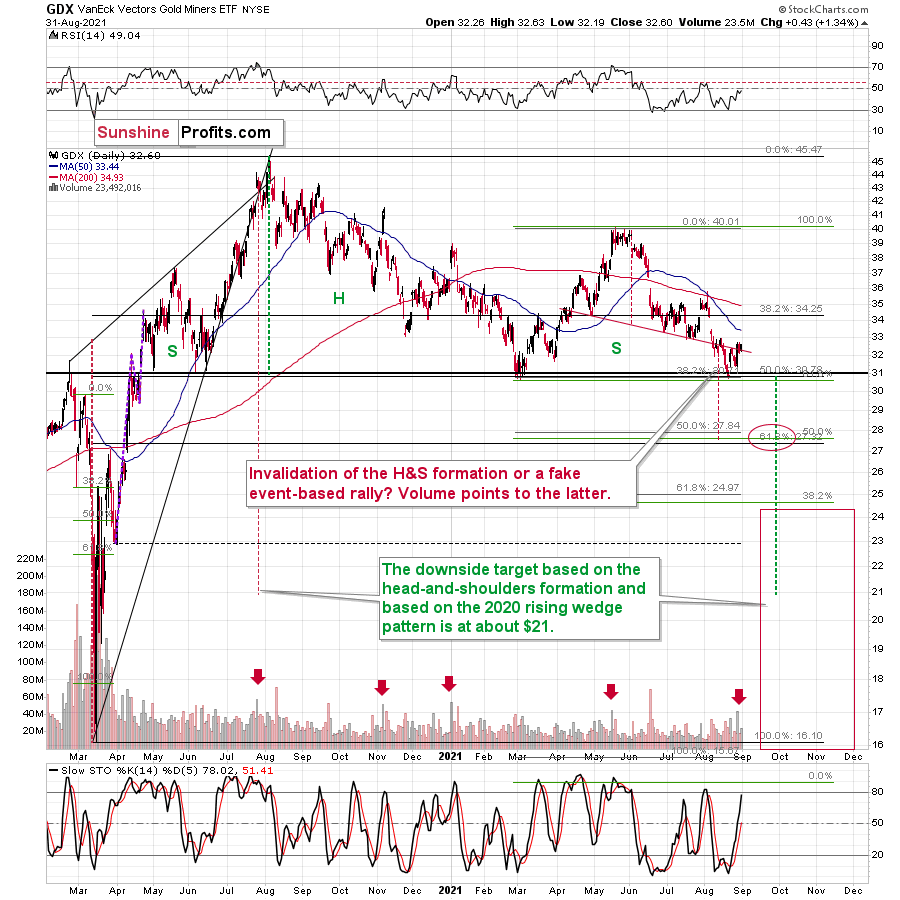
Just as the move higher in the GDX on Friday was inconsequential (and Monday’s decline proved it), yesterday’s upswing seems to have been inconsequential too.
The bearish implications of Friday’s volume spike remain intact (please compare Friday’s session to the other sessions that I marked with red arrows and check what kind of price action followed).
All in all, the outlook for the precious metals sector remains very bearish for the following weeks, even though we might need to wait a few extra days for the big declines to follow.
Having said that, let’s take a look at the markets from a more fundamental point of view.
Preparing to Pounce
With the USD Index consolidating in recent days, the Fed’s dovish rhetoric has put a short-term ceiling atop the greenback. And with European Central Bank (ECB) Governing Council member Robert Holzmann saying on Aug. 31 that “we are now in a situation where we can think about how to reduce the pandemic special programs,” semblance has reigned supreme.
However, while the EUR/USD accounts for nearly 58% of the movement of the USD Index, it’s important to remember that the U.S. and the Eurozone are in much different places as it relates to inflation and realized GDP growth. For example, while Germany, France and Italy – the Eurozone’s three-largest economies – remain below their 2019 GDP levels, the U.S. is already ahead of its pre-pandemic baseline.
Please see below:
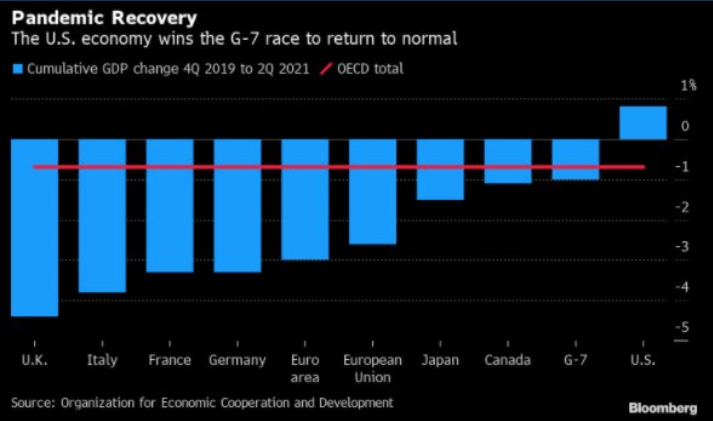
To explain, the blue bars above represent the percentage change in countries’ GDP levels relative to Q4:2019. If you analyze the middle of the chart, you can see that the Eurozone remains a relative laggard. Conversely, if you turn to the right side of the chart, you can see that the U.S. is the only G7 country that’s recouped (and now exceeded) what was lost during the coronavirus crisis. As a result, the U.S. dollar should benefit from the fundamental outperformance.
Second, despite the U.S. having much higher interest rates than the Eurozone, the former’s debt service capacity is either in line or well above its European peers.
Please see below:
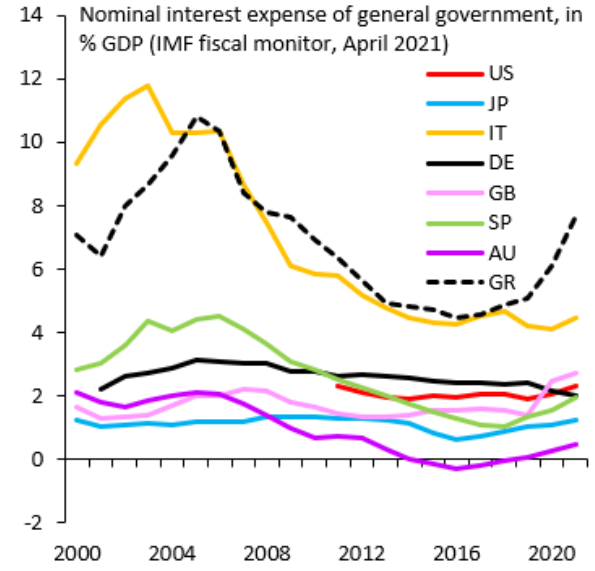 Source: IIF/Robin Brooks
To explain, the red (U.S.), black (Germany) and green (Spain) lines above track the countries’ nominal interest expenses as a percentage of their GDP. If you analyze the right side of the chart, you can see that the three lines are in similar positions. However, if you focus on the gold (Italy) and dashed black (Greece) lines, you can see that their debt service capacities are quite fragile. As a result, can the ECB really taper and underwrite higher Eurozone interest rates?
For context, I wrote on Aug. 20:
While some argue that there is too much debt in the system for the Fed to actually taper, the Eurozone suffers from an even greater affliction. Case in point: with the ECB the only buyer in town, three of Europe’s four-largest economies rely (nearly) solely on the central bank to finance their debt.
Please see below:
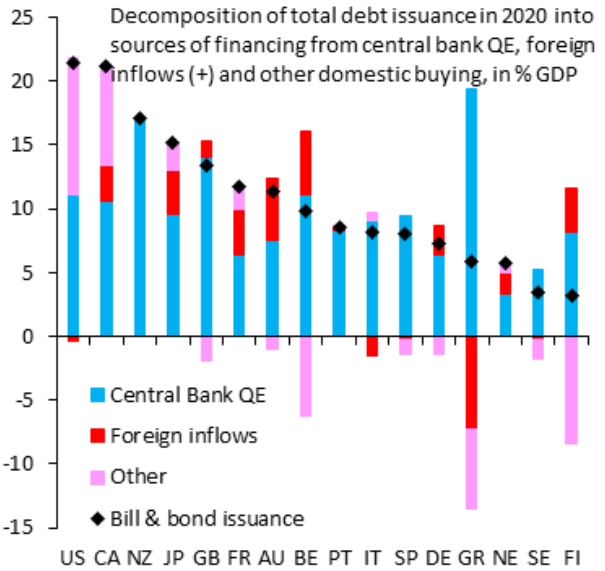 Source: IIF/Robin Brooks
To explain, the stacked bars above depict the buyers of various countries’ sovereign debt. If you analyze the column marked “US,” you can see that roughly half of the U.S. Treasury’s 2020 debt issuances have been purchased by the Fed (the light blue portion), while the other half has been purchased by domestic investors (the pink section). However, in stark contrast, if you analyze the columns labeled “IT” and “SP,” you can see that the ECB has purchased all, or nearly all, of Italy and Spain’s debt issuances since 2020. Likewise, if you analyze the column labelled “DE,” roughly 75% of German bonds have also been purchased by the ECB. As a result, with no buyers in sight, if the ECB tapers, interest rates in Italy and Spain could spike and derail Europe’s already tepid recovery. Thus, the Eurozone is much more dependent on the ECB than the U.S. is on the Fed, and the predicament implies looser-for-longer European monetary policy, which is bearish for the EUR/USD.
Emerging Markets: USDX Tailwind?
Third, with emerging market currencies oozing optimism and prior bouts of euphoria ending with profound rallies in the USD Index, I warned on May 27 that many market participants could be caught flat-footed. For context, the USD Index was trading at roughly 90 at the time.
I wrote:
While emerging market currencies continue to elicit strength versus the U.S. dollar, real money flows signal that a sharp reversal could be forthcoming.
Please see below:
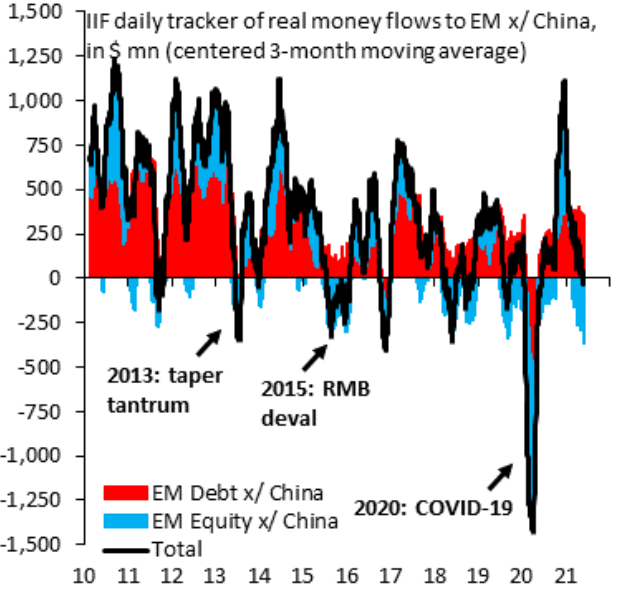 Source: IIF/Robin Brooks
To explain, the red and blue bars above track the real money debt and equity flows into emerging markets (excluding China). If you analyze the right side of the chart, you can see that total flows have turned negative (the black line) and equity flows (the blue bars) remain extremely negative. More importantly, though, when similar shifts occurred, the USD Index rallied from roughly 78 to 85 in 2013, from roughly 88 to north of 100 in 2015, from roughly 92 to north of 102 in 2016 and from roughly 88 to north of 97 in 2018. For context, I’m excluding the coronavirus-induced spike in 2020 because the sharp drop in real money flows is a material outlier.
And circling back to the present, total real money flows have turned even more negative, and they’re flirting with their 2021 lows (the black line on the right side of the chart below). Thus, the capital flight out of emerging markets remains a bullish tailwind for the U.S. dollar.
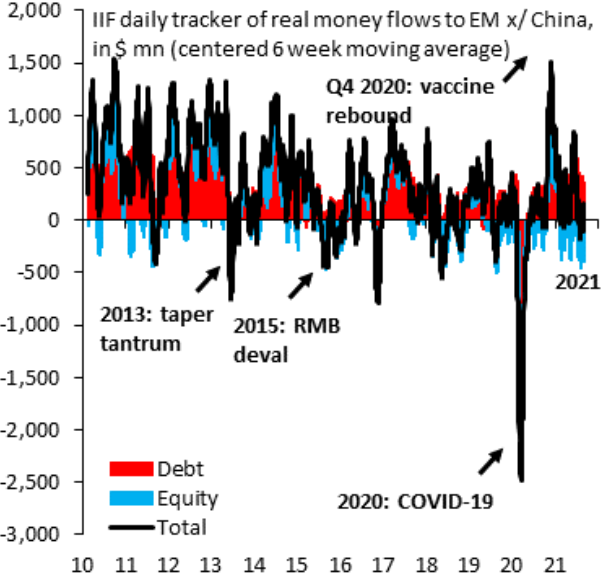 Source: IIF/Robin Brooks
Fourth, with new 2021 highs recorded on a weekly basis, non-commercial (speculative) futures traders, asset managers and leveraged funds’ allocation to the U.S. dollar continues to accelerate.
Please see below:
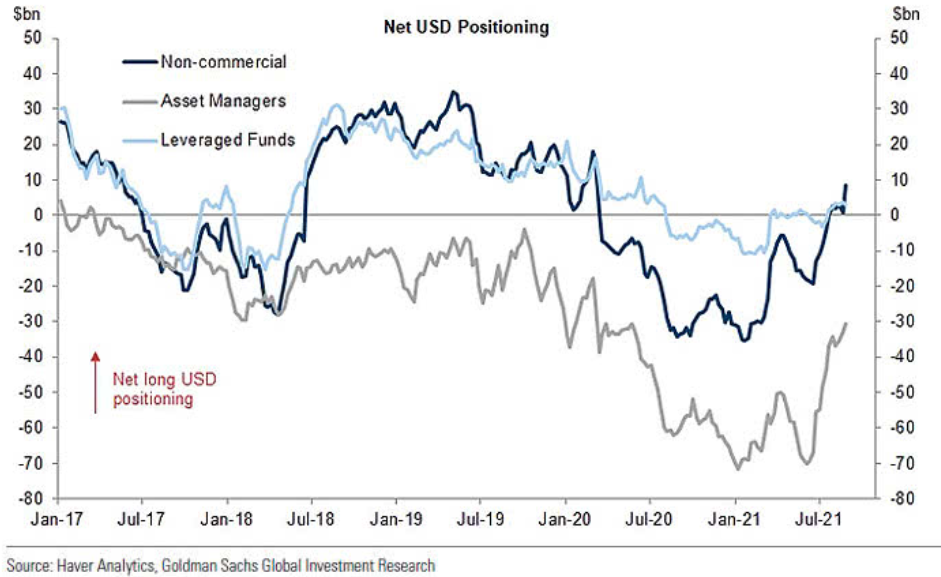
To explain, the dark blue, gray and light blue lines above represent net-long positions of non-commercial (speculative) futures traders, asset managers and leveraged funds. When the lines are falling, it means that the trio have reduced their net-long positions and are expecting a weaker U.S. dollar. Conversely, when the lines are rising, it means that the trio have increased their net-long positions and are expecting a stronger U.S. dollar. And if you analyze the right side of the chart, you can see that all three upped their bullish bets last week. As a result, a continuation of the theme should uplift the U.S. dollar and negatively impact the performance of the PMs.
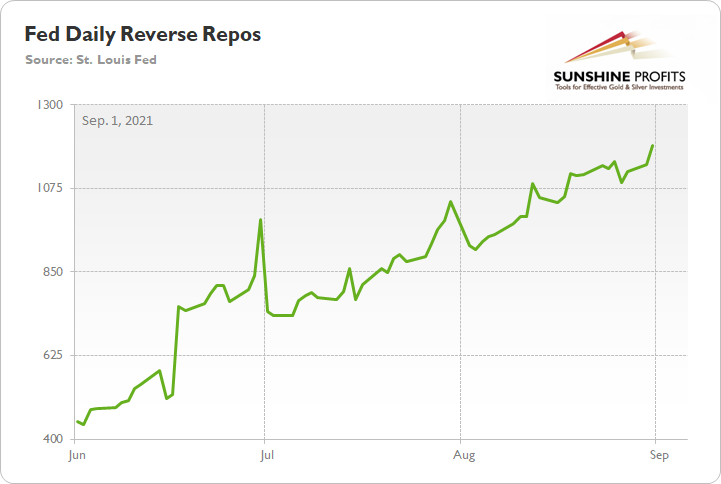
Fifth, while sentiment has abandoned the U.S. dollar in recent days, the greenback’s fundamentals remain robust. For example, with 82 counterparties draining nearly $1.19 trillion out of the U.S. financial system on Aug. 31, the Fed’s daily reverse repurchase agreements hit another all-time high.
Please see below:
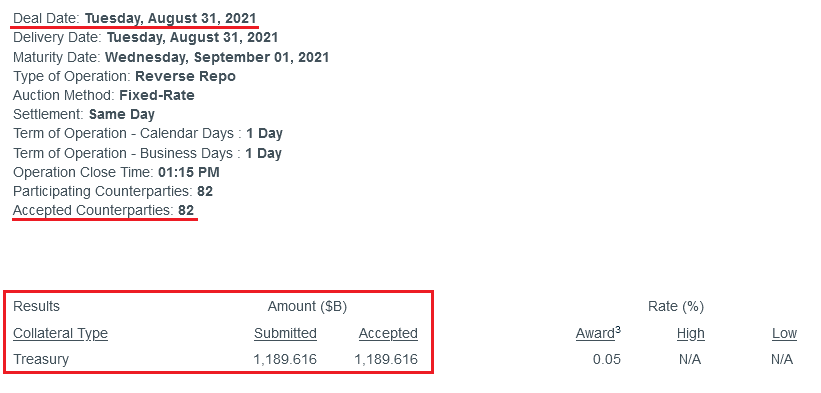 Source: New York Fed
To explain, a reverse repurchase agreement (repo) occurs when an institution offloads cash to the FED in exchange for a Treasury security (on an overnight or short-term basis). And with U.S. financial institutions currently flooded with excess liquidity, they’re shipping cash to the FED at an alarming rate. And while I’ve been warning for months that the activity is the fundamental equivalent of a taper – due to the lower supply of U.S. dollars (which is bullish for the USD Index) – the psychological effect is not the same. However, as we await a formal taper announcement from the Fed, the U.S. dollar’s fundamental foundation remains quite strong.
To that point, with the Fed’s daily reverse repos averaging $642 billion in June, $848 billion in July and $1.053 trillion in August, the shrinking supply of U.S. dollars should uplift the USD Index over the medium term.
Shadow Rates
Finally, despite Fed Chairman Jerome Powell’s dovish dance on Aug. 27, global shadow rates are still marching higher. For example, economists normally use the federal funds rate to construct their economic models. However, after the initiation of QE pushed some overnight lending rates below zero (like the ECBs), shadow rates became a substitute for the federal funds rate. And when Jing Cynthia Wu and Fan Dora Xia created the metric, the relationship meant that when the Fed increased its asset purchases by 1%, the shadow rate decreased by 0.0183%. More importantly, though, with the script now flipped, reduced liquidity is leading to a rise in global shadow rates.
Please see below:
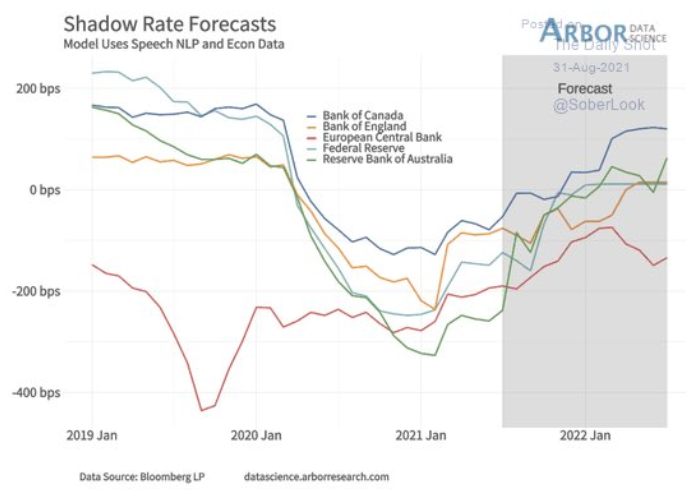
To explain, the various lines above track the recent uptrend in the central bank’s shadow rates, while the shaded gray area tracks Arbor Data Science’s 2021 (what’s left) and 2022 forecasts. If you analyze the middle of the chart, you can see that a global tightening cycle is already underway. Moreover, if you follow the light blue line, you can see that the Fed’s shadow rate is now at a 2021 high, and it’s poised to move higher over the medium term. And in the process, the USD Index will likely follow suit.
In conclusion, the PMs bounced on Aug. 31, but their daily optimism wasn’t enough to offset their poor monthly performance. And with the USD Index poised for a medium-term uprising and economic outperformance poised to widen the interest rate spread between the U.S. and the Eurozone, the PMs will likely come under pressure over the next few months. As a result, caution is warranted as we approach a fall season that often exhibits heightened volatility.
Overview of the Upcoming Part of the Decline
- It seems to me that the corrective upswing in gold is over or close to being over, and the big decline seems to be already underway.
- It seems that the first stop for gold will be close to its previous 2021 lows, slightly below $1,700. Then it will likely correct a bit, but it’s unclear if I want to exit or reverse the current short position based on that – it depends on the number and the nature of the bullish indications that we get at that time.
- After the above-mentioned correction, we’re likely to see a powerful slide, perhaps close to the 2020 low ($1,450 - $1,500).
- If we see a situation where miners slide in a meaningful and volatile way while silver doesn’t (it just declines moderately), I plan to switch from short positions in miners to short positions in silver. At this time, it’s too early to say at what price levels this could take place, and if we get this kind of opportunity at all – perhaps with gold close to $1,600.
- I plan to exit all remaining short positions when gold shows substantial strength relative to the USD Index while the latter is still rallying. This might take place with gold close to $1,350 - $1,400. I expect silver to fall the hardest in the final part of the move. This moment (when gold performs very strongly against the rallying USD and miners are strong relative to gold after its substantial decline) is likely to be the best entry point for long-term investments, in my view. This might also happen with gold close to $1,375, but it’s too early to say with certainty at this time. I expect the final bottom to take place near the end of the year, perhaps in mid-December.
- As a confirmation for the above, I will use the (upcoming or perhaps we have already seen it?) top in the general stock market as the starting point for the three-month countdown. The reason is that after the 1929 top, gold miners declined for about three months after the general stock market started to slide. We also saw some confirmations of this theory based on the analogy to 2008. All in all, the precious metals sector is likely to bottom about three months after the general stock market tops.
- The above is based on the information available today, and it might change in the following days/weeks.
You will find my general overview of the outlook for gold on the chart below:
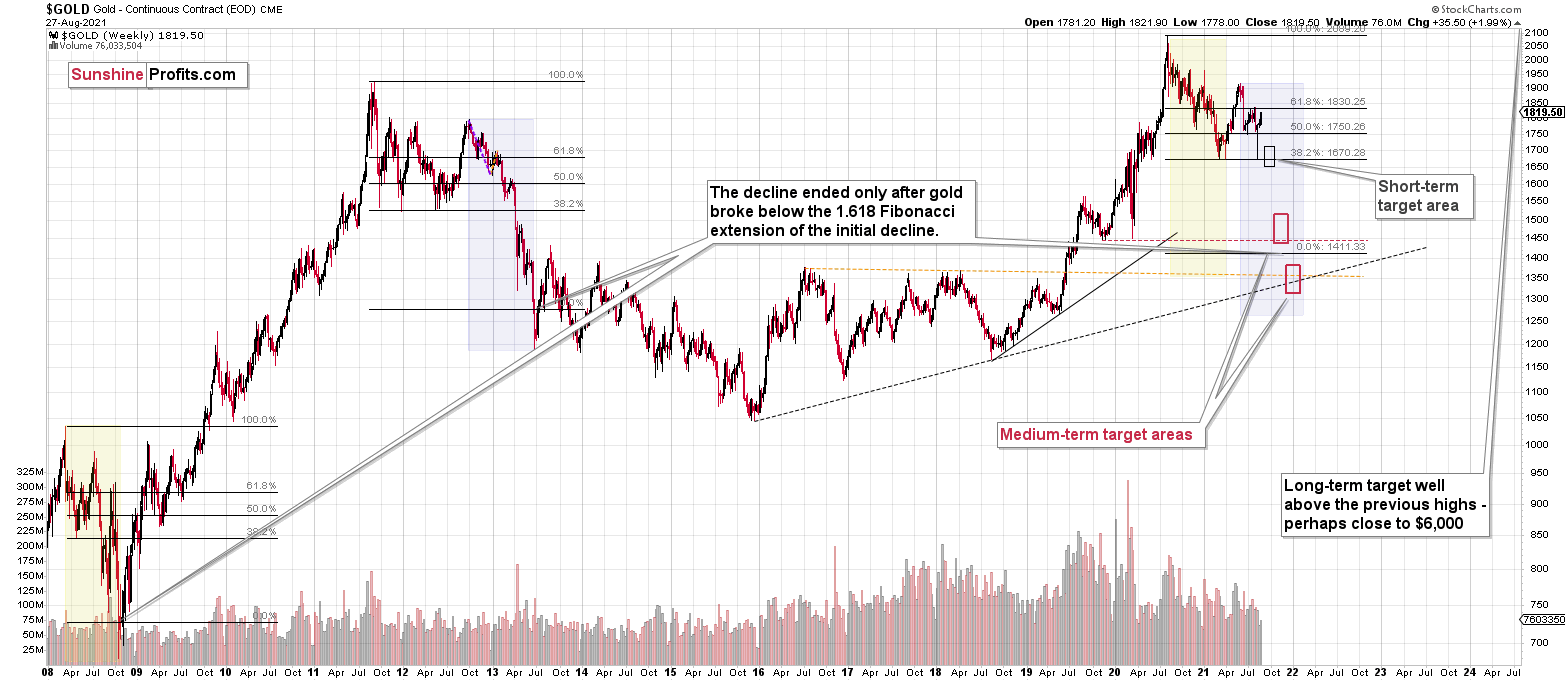
Please note that the above timing details are relatively broad and “for general overview only” – so that you know more or less what I think and how volatile I think the moves are likely to be – on an approximate basis. These time targets are not binding or clear enough for me to think that they should be used for purchasing options, warrants or similar instruments.
Letters to the Editor
Q: How far does the GDXJ have to rise before the big drop happens? If you bought it at 39.50 a week ago, you are down almost 10%. Should we be adding new short positions now when the GDXJ is 43? How far will the GDXJ hack?
A: The GDXJ doesn’t have to rise at all. In fact, it seems that it found resistance at its previous lows, and it’s unwilling to move above it. Even if it does, unless it’s accompanied by multiple bullish factors, I’m not planning to exit the current short position in it. Why? The long-term indications are much more important than the short-term ones. Based on what we see on the long-term HUI Index chart, the current correction is likely just a tiny blip on the radar screen, and as the trend simply resumes, it’s likely to be quickly forgotten. It’s missing the big move that I think should be avoided, not making sure that one catches each and every correction (such as the current one). Yes, one could have bought at a recent low, and thus at this time the position would not look good, but that’s true for most (all?) medium-term or long-term trades. In fact, please note how specifically ungrateful investing and trading is. If things go wrong with a trade, then you can think “Dammit, why did I buy this at all?!”, and when things go right with a trade, then you can think “Dammit, why did I not buy more of this?!”. And the truth is that you can’t earn all the money and you can’t catch each small trade. In my view, it’s best to focus on what is realistically achievable and not kick oneself for not being perfect with an entry point. It’s important to grow one’s portfolio over time, and if you align the positions with the key trends and pay attention to position sizing, that’s likely to happen.
But moving back to your question, I would add new short positions if I didn’t have any or I didn’t have them as big as I wanted them to be. If I already had my position established and in tune with how big I wanted it to be, I wouldn’t add more to it.
Do I think that the profit potential for this short trade in the GDXJ remains huge? Of course. I think it’s enormous, and I have a large position in the JDST myself (note: I’m not recommending using leveraged instruments, including but not limited to the JDST – I’m not saying that they should be avoided by everyone either, but I want to emphasize that it’s not appropriate for everyone).
Q: I wonder if there is a game being played by Fed members leaking their “we will tighten soon” message to the press to keep the will-he won’t-he circus going?
It seems that everything is an illusion. It honestly does feel like The Matrix at times.
The S&P has its own PUT. Every time it slips to the 50MA, the market gets bought. One day that won’t happen, but people have been saying that since last August. This market is where bears bleed out.
A: It seems to me that what is being presented as economic analyses (by the officials) is quite often (not everything, of course) marketing and smoke and mirrors aimed at shifting the blame when the inevitable hits the fan. Perhaps Powell simply doesn’t want to allow anything bad to happen to the stock market until his term ends in early 2022…
Q: Just a quick question. You hardly mention the Afghanistan issue in your articles — does it mean, in your opinion, that this issue is irrelevant to the direction of the PMs? Especially now, when President Biden has made some pretty strong comments regarding the Afghanistan issue, won’t it impact the PMs in the next few weeks?
[Note: I received a few similar questions, but my reply to the link between gold and the situation in Afghanistan is the same for all of them]
A: I did mention it briefly while discussing gold’s reaction, which was surprisingly weak compared to what’s happening on the geopolitical level. Will the situation get much worse, or is the peak uncertainty behind us? It seems to me that the peak uncertainty is behind us, and thus the gold price has also likely peaked with regard to this event. And it didn’t soar – it just rallied a bit, which was a much smaller reaction than what one might have expected. This tells us that lower gold prices are to be expected even more.
I know it may seem unintuitive to mostly ignore the political analysis here, but it really boils down to how the gold market perceives it. If the gold market had reacted very strongly, then it would have become important to analyze the details of the situation. But it didn’t, so it’s better to focus on other factors – ones to which gold does react.
Q: Where is silver headed in the short-, medium-, and long term?
A: In the short term, it’s $19 - $20 in my view (and you can see that on silver’s short-term chart), but the medium term and long term are unclear to me. I will watch gold for clues with regard to detecting the bottom in the silver market. Still, in the very long term, I expect silver to rally well above $100.
Naturally, I will report to you via Gold & Silver Trading Alerts (and intraday follow-ups when necessary) when the medium-term targets for silver become clearer.
Q: [I received a few questions about stop-losses for the current position and for the possible position in gold]
A: I’m not using stop-losses for this trade, as there is no single price that would change my mind on the market that would be close enough to be useful for trading purposes. So, yes, if gold soared and closed the day at $2,300, it would make me bullish on its price. But you wouldn’t want to wait for that level to be reached before closing the short position, right? Price levels are just that – they don’t need to change the outlook, as the moves in price can be accidental – especially in the case of silver.
In day-trading it’s imperative to have the stop-loss levels established, but in the case of long-term investments, they are rarely used at all. If you have myriads of factors pointing to a certain outcome in the market (which is usually the case with long-term investing), you likely won’t change your mind when the price moves in this or that way by a certain amount.
The current trade is not a long-term trade, but a hybrid of a short-term trade and a medium-term trade, and, at the same time, the analysis that it’s based on is somewhat similar to what is usually done for long-term investments, as it’s based on so many various factors.
Since the analysis – the foundation for the trade – is based on so many factors, at least some of them should be invalidated or supplemented by factors of opposite implications before the outlook changes. Reaching a certain price level – just by itself – is not enough.
Moreover, please note that when preparing the analysis, I’m discussing multiple markets, ratios and links between them. And yet, stop-losses are generally used just for the asset that is being traded. The invalidation could come not from the prices of PMs, but from a (for example) ratio between the HUI and S&P or from a relative volume performance…. Also, the above could make implications of a reaching certain price level (stop-loss) useless.
The bottom line is, for the majority of trading styles, stop-loss levels are useful and needed. But most trading styles focus just on the market that one is trading. The price itself is the key factor, and therefore, when it reaches a certain level, it’s very meaningful. And my trading style is not like the majority of trading styles – I take into account far more markets and indications. Some of them might (and usually are) more important than the price of a given asset itself.
Consequently, using stop-loss levels for my trades (in general) might do more harm than good. And the history confirms it. My best trading years were the ones when I was using stop-loss levels only when I viewed it as really justified for a specific trade, but I was not forced into using them because of the “trades have to be accompanied by stop-loss levels” mantra.
“If you know the enemy and know yourself, you need not fear the result of a hundred battles. If you know yourself but not the enemy, for every victory gained you will also suffer a defeat. If you know neither the enemy nor yourself, you will succumb in every battle.”
― Sun Tzu, The Art of War
I think I know a thing or two about the markets, and I strive to get to know myself. The thing that I learned about myself is that what I do works best without stop-loss levels as the default go-to solution. This is when I’m at my best, and it’s my best that I’m going to deliver to you.
Having said that, you are free to use my insights and analyses in any way you want (keeping in mind that it’s not investment advice, of course). For example, you can combine it with your own, more short-term oriented, analysis and then place stop-loss levels based on this combination.
“But what about the risk control?” – one might ask, and it would be a great question. “Position sizes!” would be the short and best answer. Determining the right position size (there’s a section “Position sizes” in that report) is where people have most control, as that depends entirely on them, not on some news or technical development. Is a $5 move higher in the GDXJ too much for one to handle? What if you decreased the position size 20-fold – would it still be too much to handle? That’s what I mean.
Using my analyses and following my approach but at the same time expecting every move to be in the “right” direction and having a very nearby stop-loss is not a recipe for success. In fact, the odds are that one would get thrown out of their positions right before the price moved in the “right” direction in a given way. After all, trends are called trends and not straight lines for a reason. And for one’s trend-based position to bring huge profits usually some time needs to pass. And during part of that time, the price will likely move back and forth, or even in the opposite direction – that’s just what markets do. As long as the trend is intact, and the position is based on sound, thorough research, patience with regard to a given position is likely to be very well-rewarded.
Summary
To summarize, even though we saw a sizable upswing on Friday, it doesn’t seem that it changes anything with regard to the bearish medium-term trend on the precious metals market. The key breakdowns / breakdowns were either not invalidated (euro, USD Index, silver, GDXJ) or were invalidated in a way that’s suspicious / in tune with what happened during the powerful 2013 slide (GDX, HUI Index).
It seems that our profits from the short positions are going to become truly epic in the following weeks.
After the sell-off (that takes gold to about $1,350 - $1,500), I expect the precious metals to rally significantly. The final part of the decline might take as little as 1-5 weeks, so it's important to stay alert to any changes.
Most importantly, please stay healthy and safe. We made a lot of money last March and this March, and it seems that we’re about to make much more on the upcoming decline, but you have to be healthy to enjoy the results.
As always, we'll keep you - our subscribers - informed.
By the way, we’re currently providing you with the possibility to extend your subscription by a year, two years or even three years with a special 20% discount. This discount can be applied right away, without the need to wait for your next renewal – if you choose to secure your premium access and complete the payment upfront. The boring time in the PMs is definitely over, and the time to pay close attention to the market is here. Naturally, it’s your capital, and the choice is up to you, but it seems that it might be a good idea to secure more premium access now while saving 20% at the same time. Our support team will be happy to assist you in the above-described upgrade at preferential terms – if you’d like to proceed, please contact us.
To summarize:
Trading capital (supplementary part of the portfolio; our opinion): Full speculative short positions (300% of the full position) in mining stocks are justified from the risk to reward point of view with the following binding exit profit-take price levels:
Mining stocks (price levels for the GDXJ ETF): binding profit-take exit price: $35.73; stop-loss: none (the volatility is too big to justify a stop-loss order in case of this particular trade)
Alternatively, if one seeks leverage, we’re providing the binding profit-take levels for the JDST (2x leveraged) and GDXD (3x leveraged – which is not suggested for most traders/investors due to the significant leverage). The binding profit-take level for the JDST: $16.96; stop-loss for the JDST: none (the volatility is too big to justify a SL order in case of this particular trade); binding profit-take level for the GDXD: $35.46; stop-loss for the GDXD: none (the volatility is too big to justify a SL order in case of this particular trade).
For-your-information targets (our opinion; we continue to think that mining stocks are the preferred way of taking advantage of the upcoming price move, but if for whatever reason one wants / has to use silver or gold for this trade, we are providing the details anyway.):
Silver futures upside profit-take exit price: unclear at this time - initially, it might be a good idea to exit, when gold moves to $1,683
Gold futures upside profit-take exit price: $1,683
HGD.TO – alternative (Canadian) inverse 2x leveraged gold stocks ETF – the upside profit-take exit price: $11.38
Long-term capital (core part of the portfolio; our opinion): No positions (in other words: cash
Insurance capital (core part of the portfolio; our opinion): Full position
Whether you already subscribed or not, we encourage you to find out how to make the most of our alerts and read our replies to the most common alert-and-gold-trading-related-questions.
Please note that we describe the situation for the day that the alert is posted in the trading section. In other words, if we are writing about a speculative position, it means that it is up-to-date on the day it was posted. We are also featuring the initial target prices to decide whether keeping a position on a given day is in tune with your approach (some moves are too small for medium-term traders, and some might appear too big for day-traders).
Additionally, you might want to read why our stop-loss orders are usually relatively far from the current price.
Please note that a full position doesn't mean using all of the capital for a given trade. You will find details on our thoughts on gold portfolio structuring in the Key Insights section on our website.
As a reminder - "initial target price" means exactly that - an "initial" one. It's not a price level at which we suggest closing positions. If this becomes the case (like it did in the previous trade), we will refer to these levels as levels of exit orders (exactly as we've done previously). Stop-loss levels, however, are naturally not "initial", but something that, in our opinion, might be entered as an order.
Since it is impossible to synchronize target prices and stop-loss levels for all the ETFs and ETNs with the main markets that we provide these levels for (gold, silver and mining stocks - the GDX ETF), the stop-loss levels and target prices for other ETNs and ETF (among other: UGL, GLL, AGQ, ZSL, NUGT, DUST, JNUG, JDST) are provided as supplementary, and not as "final". This means that if a stop-loss or a target level is reached for any of the "additional instruments" (GLL for instance), but not for the "main instrument" (gold in this case), we will view positions in both gold and GLL as still open and the stop-loss for GLL would have to be moved lower. On the other hand, if gold moves to a stop-loss level but GLL doesn't, then we will view both positions (in gold and GLL) as closed. In other words, since it's not possible to be 100% certain that each related instrument moves to a given level when the underlying instrument does, we can't provide levels that would be binding. The levels that we do provide are our best estimate of the levels that will correspond to the levels in the underlying assets, but it will be the underlying assets that one will need to focus on regarding the signs pointing to closing a given position or keeping it open. We might adjust the levels in the "additional instruments" without adjusting the levels in the "main instruments", which will simply mean that we have improved our estimation of these levels, not that we changed our outlook on the markets. We are already working on a tool that would update these levels daily for the most popular ETFs, ETNs and individual mining stocks.
Our preferred ways to invest in and to trade gold along with the reasoning can be found in the how to buy gold section. Furthermore, our preferred ETFs and ETNs can be found in our Gold & Silver ETF Ranking.
As a reminder, Gold & Silver Trading Alerts are posted before or on each trading day (we usually post them before the opening bell, but we don't promise doing that each day). If there's anything urgent, we will send you an additional small alert before posting the main one.
Thank you.
Przemyslaw Radomski, CFA
Founder, Editor-in-chief

