

Briefly: in our opinion, full (300% of the regular position size) speculative short positions in mining stocks are justified from the risk/reward point of view at the moment of publishing this Alert.
In yesterday’s analysis, I emphasized that Friday’s event-driven news was… well, exactly that. And nothing more than that. As such, it was unlikely to be a beginning of a new uptrend in the precious metals sector, but rather a daily reaction more or less separate from the current (down)trend.
What happened yesterday (and what’s happening today) is in perfect tune with the above. Let’s start with taking a look at the confirmations that came from the mining stocks.
The Invalidation’s Invalidation
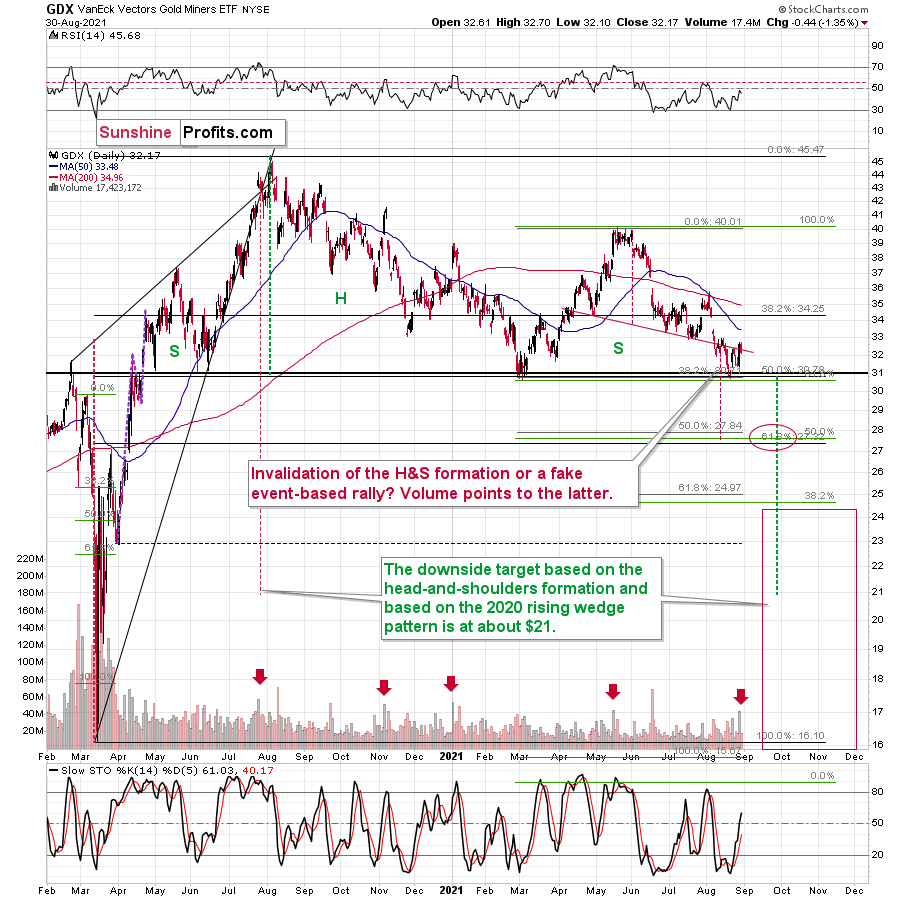
Remember the tiny move back above the neck level of the bearish head and shoulders pattern? Well, it’s been invalidated. Yes, the invalidation was invalidated. While it may sound odd, the really odd thing is that the miners managed to close the previous week above this level. If this move had been true, gold miners would have soared yesterday. Instead, they moved back down, correcting the action that was rather accidental.
And while the senior miners (GDX) invalidated their move higher, the junior miners (GDXJ) are verifying the previous breakdowns in a classic manner.
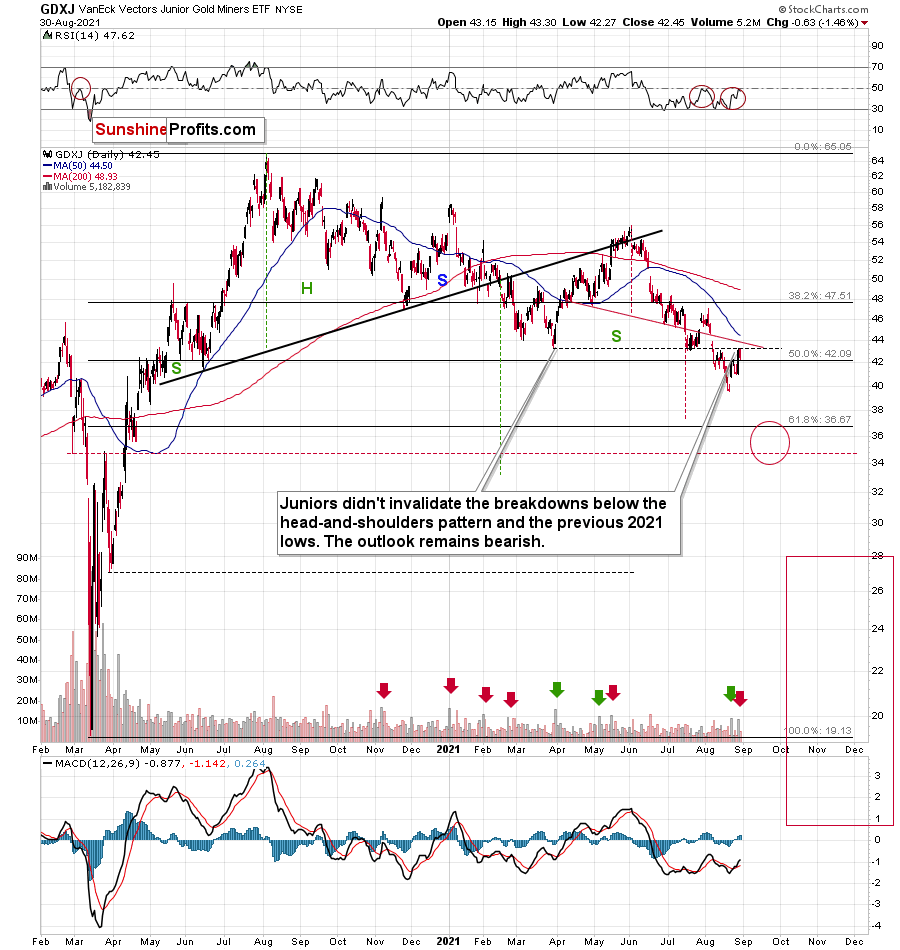
Namely, after moving below the previous lows, the GDXJ ETF moved back up to them and then declined once again. This is a common thing for an asset to do, and it’s called a breakdown’s verification. A final good-bye kiss to the previous support, which now proved to be resistance.
“Farewell, previous 2021 lows…” – the GDXJ ETF whispered gently, hesitated for no more than a second, and looked downward, excited about the upcoming jump into the unknown. (who said analyses have to be boring?)
In other words, the outlook remains bearish.
The Gold and Dollar Dance
What happened in today’s pre-market trading might make you think that the move higher in the PMs could actually have legs. That’s because the USD Index moved lower.
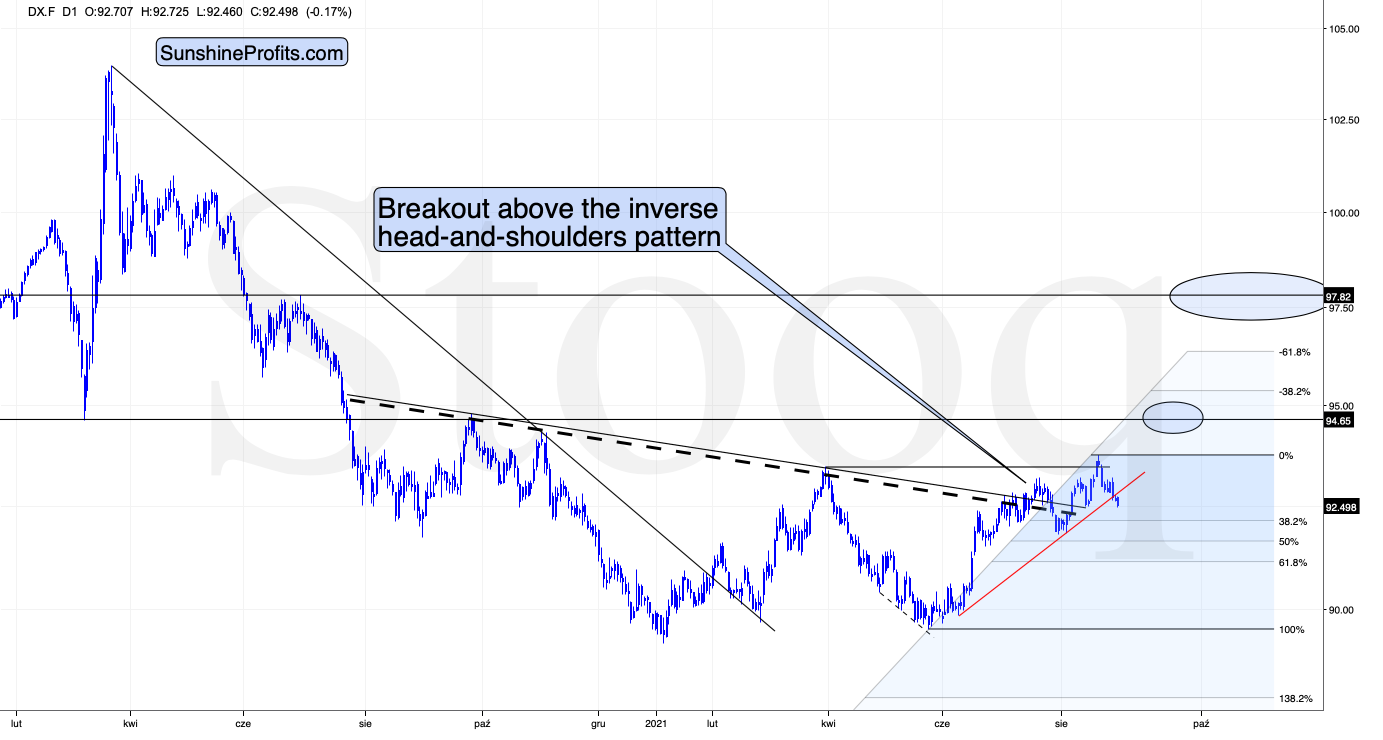
The USDX not only moved lower, but it even managed to break below the rising red support line. But does it change much?
- I previously wrote that the USDX could fall to about 92.5, and it wouldn’t change much.
- The previous short-term lows were touched but not broken.
- The 38.2% Fibonacci retracement level based on the most recent upswing is close but hasn’t been reached yet. This level (based on a smaller rally) stopped the previous decline in the USD Index and triggered a huge slide in gold, silver, and mining stocks.
In other words, it doesn’t change much for the outlook for the USDX, it might simply delay the rally for several days.
And it changes even less for gold.
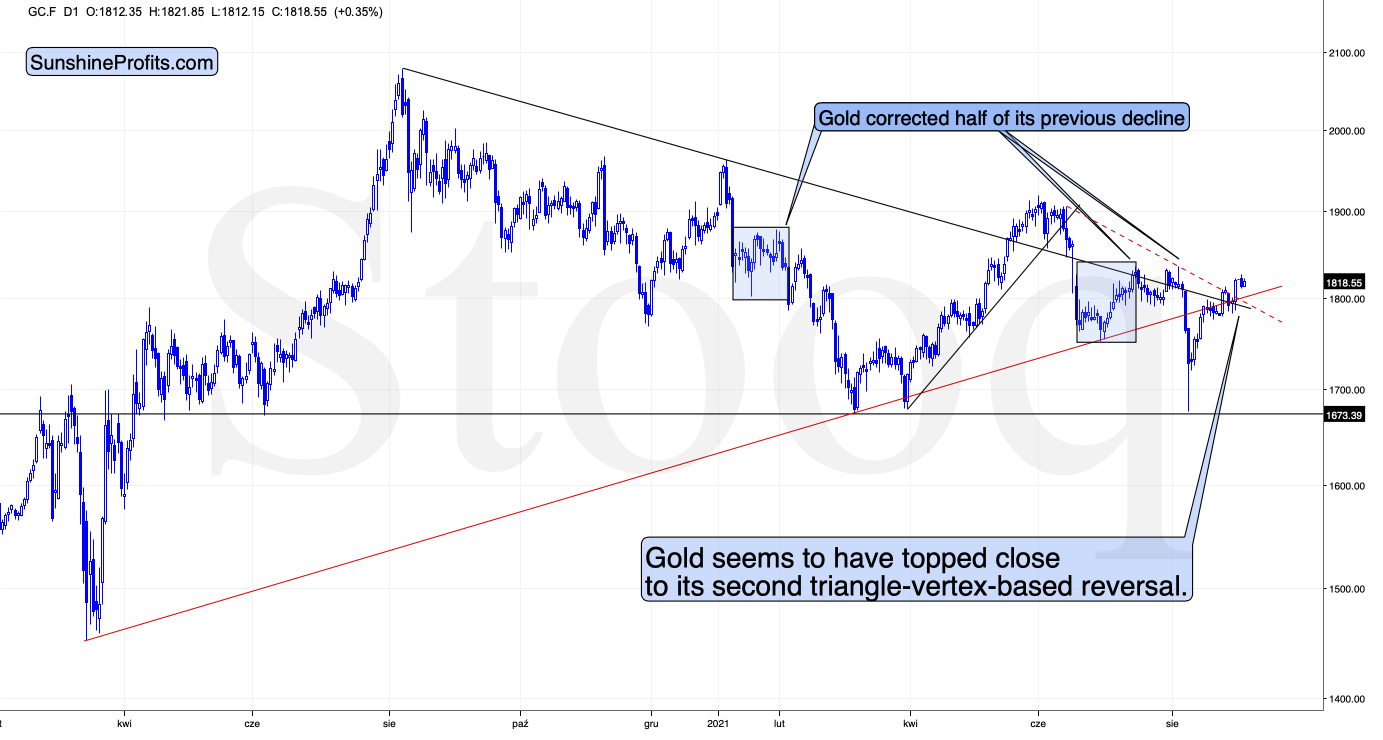
Please note that the yellow metal didn’t move to new highs, even though the USDX moved to new very short-term lows. So, gold is not really willing to react to the USD’s weakness. This means that even if the latter declines a bit, it won’t change much (if anything) for the price of gold.
Gold formed a local top at its previous triangle-vertex-based reversal, and it seems that it also formed a top this week at its current triangle-vertex-based reversal.
U.S. Labor Day Cyclicality
Moreover, please note that we’re just one week away from the U.S. Labor Day, which is much more important for the gold market than it seems at first glance.
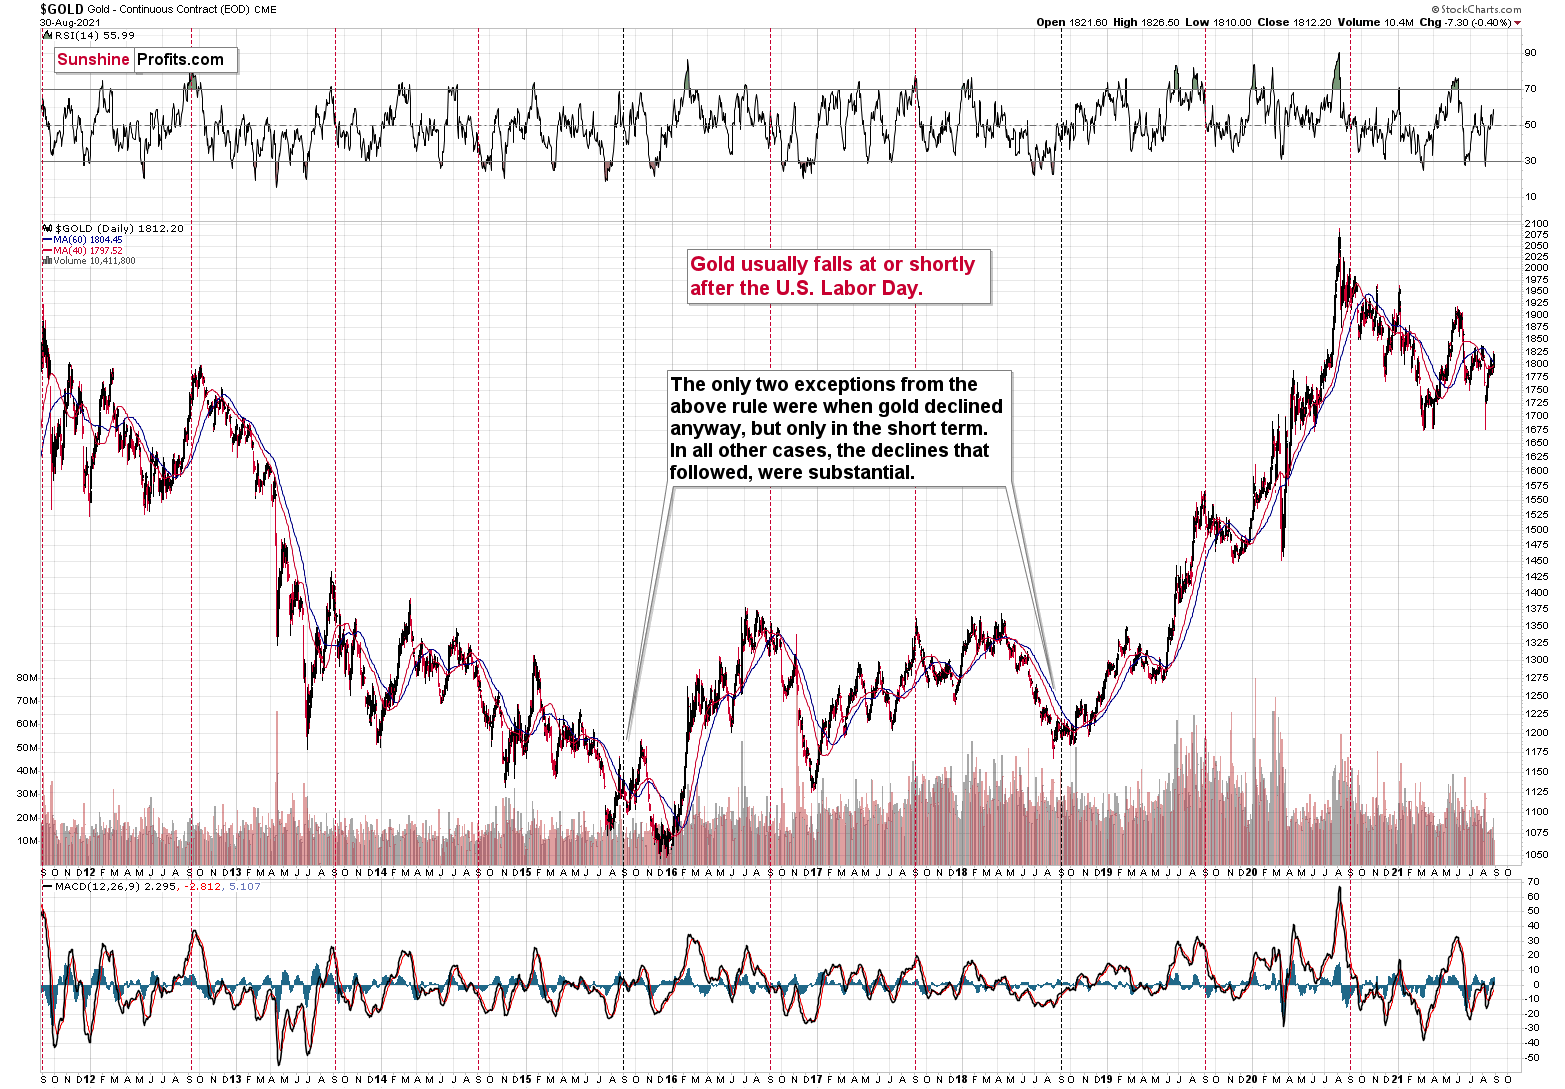
In the previous 10 years, gold almost always declined profoundly right after the U.S. Labor Day — I marked that on the above chart with red, dashed lines. There were only two cases (in 2015 and in 2018) when gold didn’t slide profoundly after that day, but… it was when gold was declining in the short term anyway. There was simply no major downswing later.
This is very important, as it tells us that even if gold doesn’t decline for a week from now, it will be very likely to do so based on this surprisingly accurate cyclicality.
All in all, the outlook for the precious metals sector remains very bearish for the following weeks, even though we might need to wait a few extra days for the big declines to follow.
Having said that, let’s take a look at the markets from a more fundamental point of view.
Playing With Fire
With Fed Chairman Jerome Powell threading the dovish needle on Aug. 27, investors rejoiced as he downplayed the consequences of surging inflation. However, while his perpetual patience may elicit comfort in the short term, the medium-term ramifications could end up shocking the financial markets. Case in point: while Powell allows the economy to run hot, his lack of prudence has left him far behind the inflation curve. And with one policy mistake liable to result in an accelerated rate hike cycle once the Fed finally moves, his ability to placate investors could come under immense pressure.
Expecting just that, Bridgewater Associates co-CIO Greg Jensen – who co-heads the world’s largest hedge fund – told Bloomberg on Aug. 26 that the cocktail of surging inflation and strong nominal GDP growth could force the Fed to raise interest rates at a much faster pace than investors expect.
Please see below:
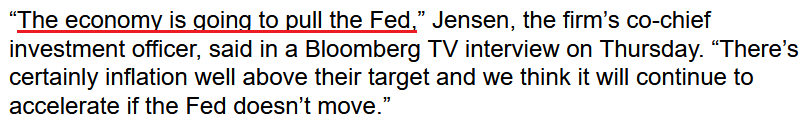 Source: Bloomberg
Sharing that sentiment, former Richmond Fed President Jeffrey Lacker told Bloomberg on Aug. 30 that “I think the Fed’s in a tough spot. The danger that they face from this inflation surge – we have inflation on a six-month basis higher than it’s been since 1983 – the danger is that that persists.”
And while Powell’s “transitory” narrative remains credible with investors right now, his reassurances that the Fed has the tools to tackle persistent inflation is like “a doctor telling you that you have gangrene in your leg and don’t worry we have the tools to deal with it, but the tools are the amputation kit and they include a big saw.” Thus, Lacker believes that Powell may end up learning a hard lesson.
Please see below:
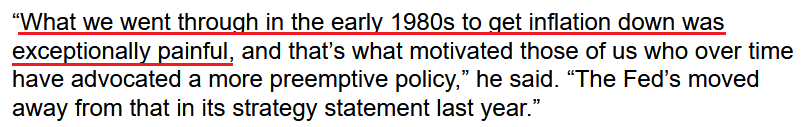 Source: Bloomberg
On the data front, the Kansas City Fed released its Tenth District Manufacturing Activity Survey on Aug. 26. And while the headline index declined from 30 in July to 29 in August, inflation remains abundant:
“The monthly index of prices paid for raw materials continued to increase for a majority of firms in August, and the index of prices received for finished goods rose to a new survey high. Price indexes vs. a year ago expanded near record levels. Moving forward, district manufacturing firms expected materials prices and finished goods prices to continue to rise over the next six months.”
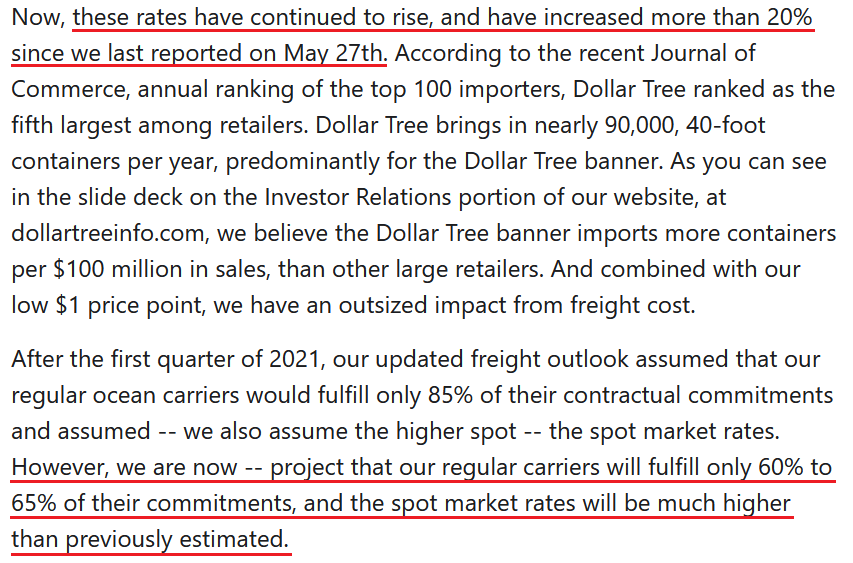
What’s more, after Dollar Tree’s stock plunged following disappointing second-quarter earnings on Aug. 26, management cited the recent surge in shipping costs. For context, Dollar Tree is an American chain of discount variety stores that sells items for $1 or less.
CEO Michael A. Witynski said:
“In recent quarters, we have spoken about the freight cost environment, both international and domestic. As you have certainly seen in the media and elsewhere, freight costs have reached unprecedented levels as a result of increased demand, limited capacity and shipping delays. For context, three months ago, the Shanghai Containerized Freight Index, which reflects spot rates on ocean freight from China, was already at an all-time high, up more than 280% year-over-year and more than 400% since 2019.”
And how has the situation evolved since then?
 Source: Dollar Tree/The Motley Fool
Also suffering from shipping woes, Abercrombie & Fitch – an American clothing retailer – warned that excess costs are eating into the company’s profit margins.
CFO Scott Lipesky told investors during the company’s Q2 earnings call on Aug. 26:
“We are seeing the increased freight coming into us on the third quarter. So it started to build here in the first half, some of that gets booked up in your inventory and then will start to flow that through here in the third quarter. So, it will be a little bit down there versus Q2. But the great thing is we're still talking about 300 basis points up versus 2019, and that's baking in 300 basis points to 400 basis points of pressure [on our third quarter gross margin] from, hopefully, transitory freight inflation that will hopefully sort itself out in the future, but will see when that happens.”
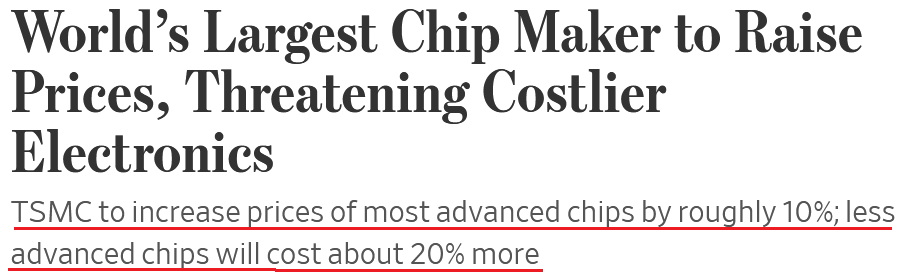
Adding to the inflationary pressures, Taiwan Semiconductor – which supplies chips to companies like Apple, AMD and Nvidia – announced on Aug. 26 that it’s raising its prices by 10% to 20%. For context, Apple is one of Taiwan Semiconductor’s largest customers and its iPhones use advanced microprocessors made in the company’s foundries.
Please see below:
 Source: The Wall Street Journal (WSJ)
Persistent Inflation Meter Goes Wild
Furthermore, while the Fed ignores the problem and the deflationists bury their heads in the sand, not only has Bank of America’s gauge of transitory inflation accelerated, but persistent inflation has also moved sharply higher.
Please see below:
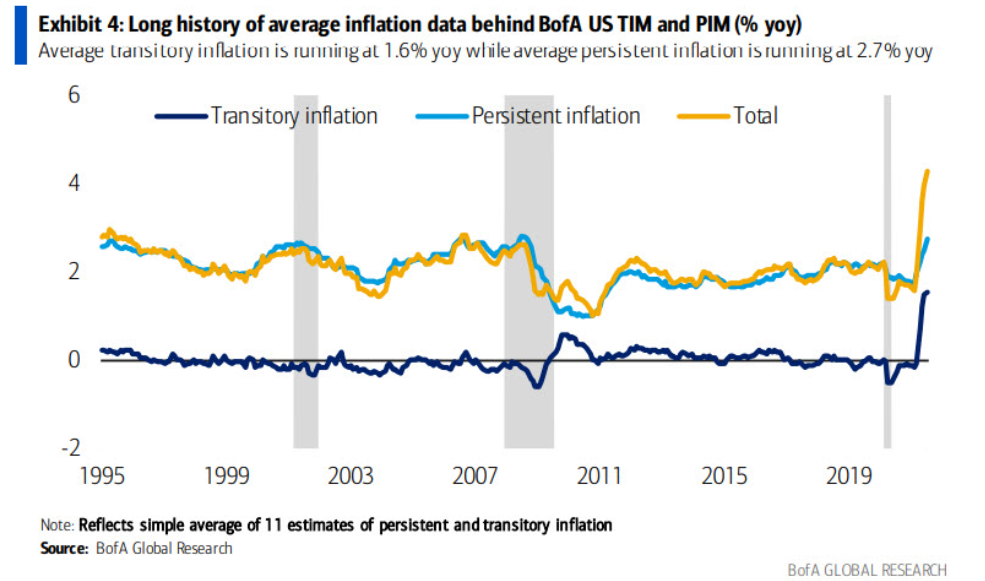
To explain, the dark blue line above tracks Bank of America’s measure of transitory inflation, while the light blue line above tracks its measure of persistent inflation. If you analyze the right side of the chart, you can see that both measures continue to seek higher ground. And while the deflationists focus all of their attention on items that should normalize in the coming months (like used car prices), sticky items remain unrelenting, and rent inflation is still largely understated.
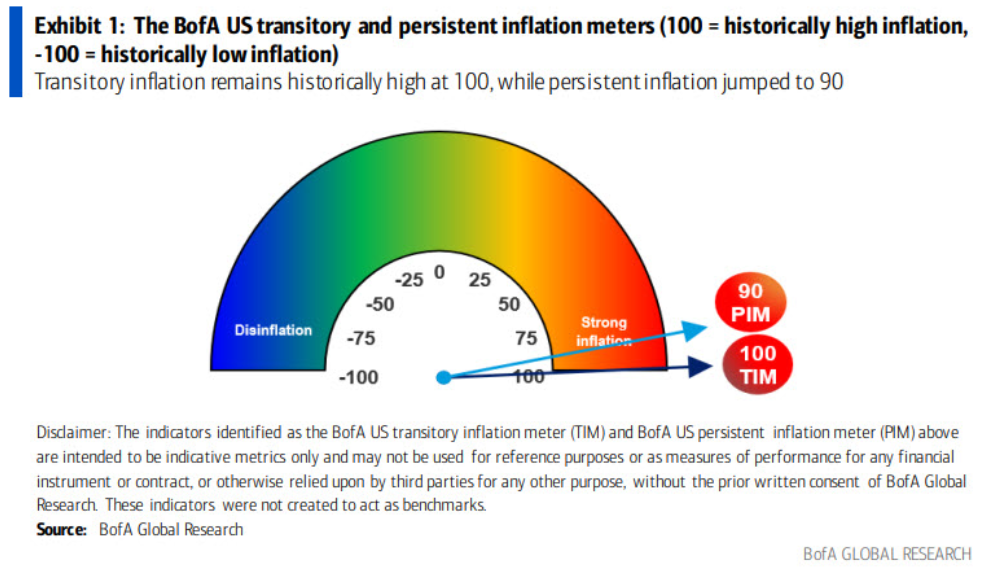
To that point, it was only two months ago that persistent inflation had a model score of 75. However, on Aug. 26, Bank of America revealed that its persistent inflation model score hit an all-time high of 90. Economist Alex Lin wrote:
“Owners’ equivalent rent (OER) and medical care services both rose 0.3% mom, and rent of primary residence increased 0.2% mom. As a result, the BofA US persistent inflation meter (PIM) strengthened to 90 in July. In other words, both transitory and persistent inflation are running at historically elevated levels.”
Please see below:
Finally, although the inflationary momentum continues to accelerate, U.S. Treasury yields still remain rangebound. And while a strong U.S. nonfarm payrolls print on Sep. 3 could be the catalyst for another rally (though the Delta variant may have slowed the employment momentum), seasonal signals support higher long-term interest rates in September and October.
Please see below:
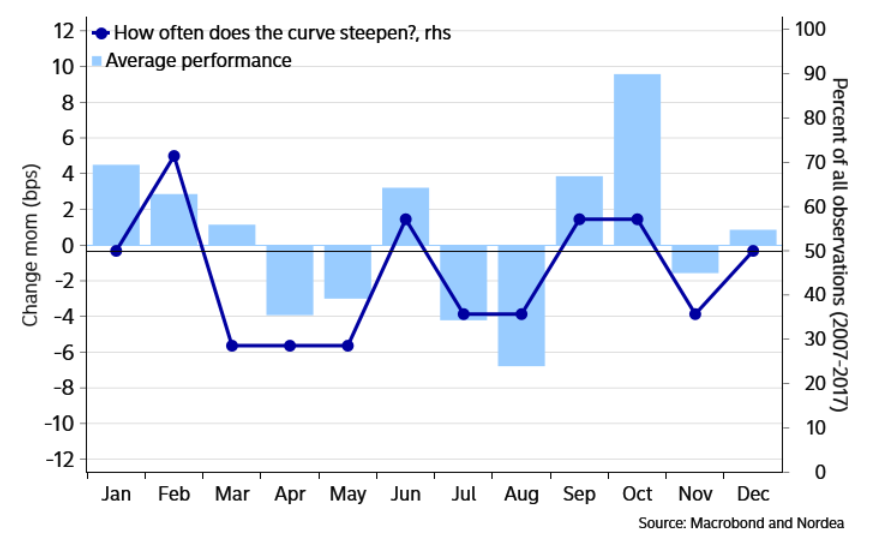
To explain, the light blue bars above track the average steepening of the U.S. yield curve during each month of the year. For context, ‘steepening’ means that long-term Treasury yields rise at a faster pace and/or fall at a slower pace than short-term Treasury yields. If you analyze the columns labeled “Sep” and “Oct,” you can see that late summer and early fall often coincide with higher long-term interest rates. Furthermore, if the seasonal patterns also coincide with rising U.S. nonfarm payrolls and deceleration of the Delta variant, it could create the perfect storm to lift the U.S. 10-Year Treasury yield materially higher.
In conclusion, the PMs confronted a sea of red on Aug. 30, as Friday’s (Aug. 28) Fed-induced momentum ran out of gas. Moreover, while the Fed ignores the pricing pressures and remains confident in its ability to control the inflationary wildfire, the burn continues to accelerate. And with persistent forces showing nearly as much fervor as transitory effects, an accelerated tightening of financial conditions could ignite volatility across nearly all assets. As a result, if this outcome unfolds, it could be a long way down before the PMs encounter medium-term support.
Overview of the Upcoming Part of the Decline
- It seems to me that the corrective upswing in gold is over or close to being over, and the big decline seems to be already underway.
- It seems that the first stop for gold will be close to its previous 2021 lows, slightly below $1,700. Then it will likely correct a bit, but it’s unclear if I want to exit or reverse the current short position based on that – it depends on the number and the nature of the bullish indications that we get at that time.
- After the above-mentioned correction, we’re likely to see a powerful slide, perhaps close to the 2020 low ($1,450 - $1,500).
- If we see a situation where miners slide in a meaningful and volatile way while silver doesn’t (it just declines moderately), I plan to switch from short positions in miners to short positions in silver. At this time, it’s too early to say at what price levels this could take place, and if we get this kind of opportunity at all – perhaps with gold close to $1,600.
- I plan to exit all remaining short positions when gold shows substantial strength relative to the USD Index while the latter is still rallying. This might take place with gold close to $1,350 - $1,400. I expect silver to fall the hardest in the final part of the move. This moment (when gold performs very strongly against the rallying USD and miners are strong relative to gold after its substantial decline) is likely to be the best entry point for long-term investments, in my view. This might also happen with gold close to $1,375, but it’s too early to say with certainty at this time. I expect the final bottom to take place near the end of the year, perhaps in mid-December.
- As a confirmation for the above, I will use the (upcoming or perhaps we have already seen it?) top in the general stock market as the starting point for the three-month countdown. The reason is that after the 1929 top, gold miners declined for about three months after the general stock market started to slide. We also saw some confirmations of this theory based on the analogy to 2008. All in all, the precious metals sector is likely to bottom about three months after the general stock market tops.
- The above is based on the information available today, and it might change in the following days/weeks.
You will find my general overview of the outlook for gold on the chart below:
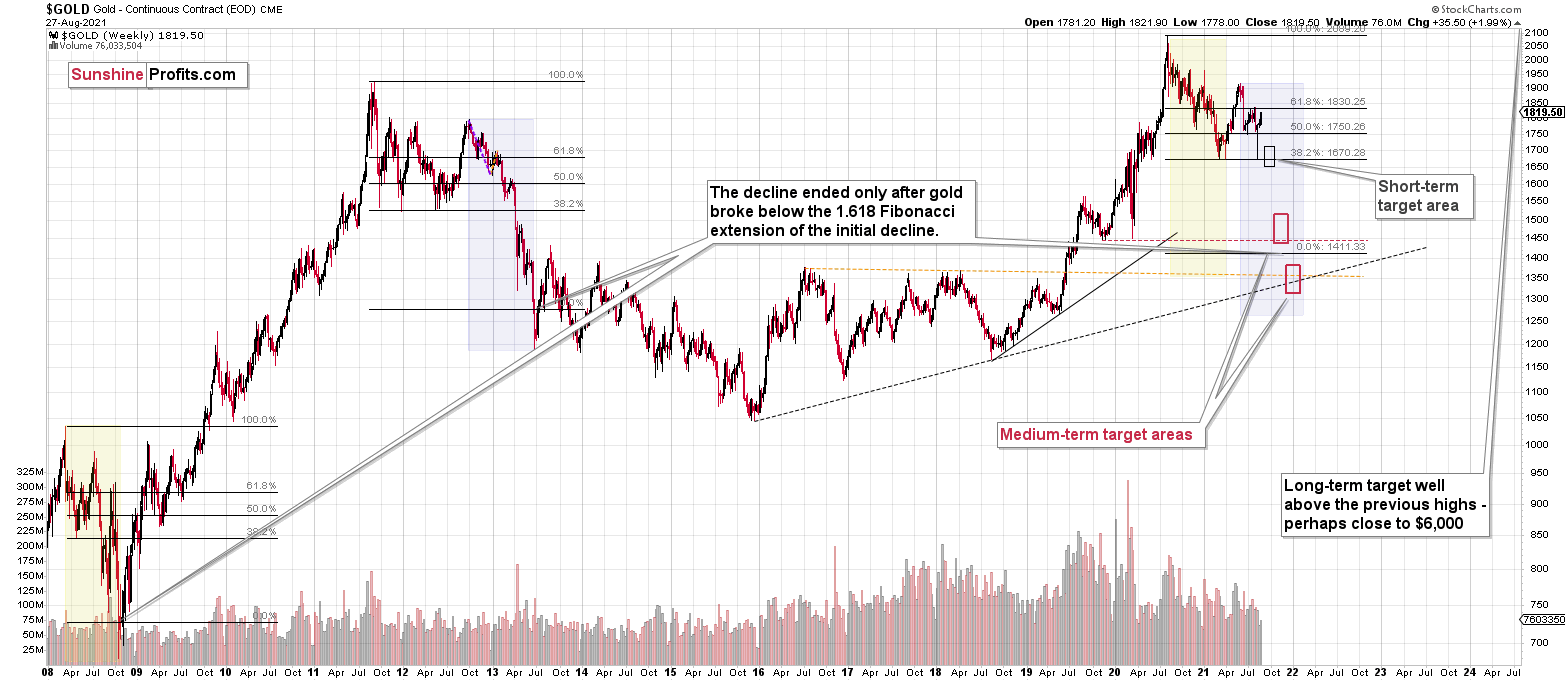
Please note that the above timing details are relatively broad and “for general overview only” – so that you know more or less what I think and how volatile I think the moves are likely to be – on an approximate basis. These time targets are not binding or clear enough for me to think that they should be used for purchasing options, warrants or similar instruments.
Summary
To summarize, even though we saw a sizable upswing on Friday, it doesn’t seem that it changes anything with regard to the bearish medium-term trend on the precious metals market. The key breakdowns / breakdowns were either not invalidated (euro, USD Index, silver, GDXJ) or were invalidated in a way that’s suspicious / in tune with what happened during the powerful 2013 slide (GDX, HUI Index).
It seems that our profits from the short positions are going to become truly epic in the following weeks.
After the sell-off (that takes gold to about $1,350 - $1,500), I expect the precious metals to rally significantly. The final part of the decline might take as little as 1-5 weeks, so it's important to stay alert to any changes.
Most importantly, please stay healthy and safe. We made a lot of money last March and this March, and it seems that we’re about to make much more on the upcoming decline, but you have to be healthy to enjoy the results.
As always, we'll keep you - our subscribers - informed.
By the way, we’re currently providing you with the possibility to extend your subscription by a year, two years or even three years with a special 20% discount. This discount can be applied right away, without the need to wait for your next renewal – if you choose to secure your premium access and complete the payment upfront. The boring time in the PMs is definitely over, and the time to pay close attention to the market is here. Naturally, it’s your capital, and the choice is up to you, but it seems that it might be a good idea to secure more premium access now while saving 20% at the same time. Our support team will be happy to assist you in the above-described upgrade at preferential terms – if you’d like to proceed, please contact us.
To summarize:
Trading capital (supplementary part of the portfolio; our opinion): Full speculative short positions (300% of the full position) in mining stocks are justified from the risk to reward point of view with the following binding exit profit-take price levels:
Mining stocks (price levels for the GDXJ ETF): binding profit-take exit price: $35.73; stop-loss: none (the volatility is too big to justify a stop-loss order in case of this particular trade)
Alternatively, if one seeks leverage, we’re providing the binding profit-take levels for the JDST (2x leveraged) and GDXD (3x leveraged – which is not suggested for most traders/investors due to the significant leverage). The binding profit-take level for the JDST: $16.96; stop-loss for the JDST: none (the volatility is too big to justify a SL order in case of this particular trade); binding profit-take level for the GDXD: $35.46; stop-loss for the GDXD: none (the volatility is too big to justify a SL order in case of this particular trade).
For-your-information targets (our opinion; we continue to think that mining stocks are the preferred way of taking advantage of the upcoming price move, but if for whatever reason one wants / has to use silver or gold for this trade, we are providing the details anyway.):
Silver futures upside profit-take exit price: unclear at this time - initially, it might be a good idea to exit, when gold moves to $1,683
Gold futures upside profit-take exit price: $1,683
HGD.TO – alternative (Canadian) inverse 2x leveraged gold stocks ETF – the upside profit-take exit price: $11.38
Long-term capital (core part of the portfolio; our opinion): No positions (in other words: cash
Insurance capital (core part of the portfolio; our opinion): Full position
Whether you already subscribed or not, we encourage you to find out how to make the most of our alerts and read our replies to the most common alert-and-gold-trading-related-questions.
Please note that we describe the situation for the day that the alert is posted in the trading section. In other words, if we are writing about a speculative position, it means that it is up-to-date on the day it was posted. We are also featuring the initial target prices to decide whether keeping a position on a given day is in tune with your approach (some moves are too small for medium-term traders, and some might appear too big for day-traders).
Additionally, you might want to read why our stop-loss orders are usually relatively far from the current price.
Please note that a full position doesn't mean using all of the capital for a given trade. You will find details on our thoughts on gold portfolio structuring in the Key Insights section on our website.
As a reminder - "initial target price" means exactly that - an "initial" one. It's not a price level at which we suggest closing positions. If this becomes the case (like it did in the previous trade), we will refer to these levels as levels of exit orders (exactly as we've done previously). Stop-loss levels, however, are naturally not "initial", but something that, in our opinion, might be entered as an order.
Since it is impossible to synchronize target prices and stop-loss levels for all the ETFs and ETNs with the main markets that we provide these levels for (gold, silver and mining stocks - the GDX ETF), the stop-loss levels and target prices for other ETNs and ETF (among other: UGL, GLL, AGQ, ZSL, NUGT, DUST, JNUG, JDST) are provided as supplementary, and not as "final". This means that if a stop-loss or a target level is reached for any of the "additional instruments" (GLL for instance), but not for the "main instrument" (gold in this case), we will view positions in both gold and GLL as still open and the stop-loss for GLL would have to be moved lower. On the other hand, if gold moves to a stop-loss level but GLL doesn't, then we will view both positions (in gold and GLL) as closed. In other words, since it's not possible to be 100% certain that each related instrument moves to a given level when the underlying instrument does, we can't provide levels that would be binding. The levels that we do provide are our best estimate of the levels that will correspond to the levels in the underlying assets, but it will be the underlying assets that one will need to focus on regarding the signs pointing to closing a given position or keeping it open. We might adjust the levels in the "additional instruments" without adjusting the levels in the "main instruments", which will simply mean that we have improved our estimation of these levels, not that we changed our outlook on the markets. We are already working on a tool that would update these levels daily for the most popular ETFs, ETNs and individual mining stocks.
Our preferred ways to invest in and to trade gold along with the reasoning can be found in the how to buy gold section. Furthermore, our preferred ETFs and ETNs can be found in our Gold & Silver ETF Ranking.
As a reminder, Gold & Silver Trading Alerts are posted before or on each trading day (we usually post them before the opening bell, but we don't promise doing that each day). If there's anything urgent, we will send you an additional small alert before posting the main one.
Thank you.
Przemyslaw Radomski, CFA
Founder, Editor-in-chief

