

Briefly: In our opinion, full (150% of the regular full position) speculative short positions in gold, silver and mining stocks are justified from the risk/reward perspective at the moment of publishing this alert.
While nothing happened during Thursday’s session last week and the session was extremely boring, Friday’s session was far from it. Gold and silver soared, while the USD Index closed at new lows. What are the implications for the following weeks and months?
Let’s start with the latter as the analysis of the USD Index will provide the critical context (chart courtesy of http://stockcharts.com).
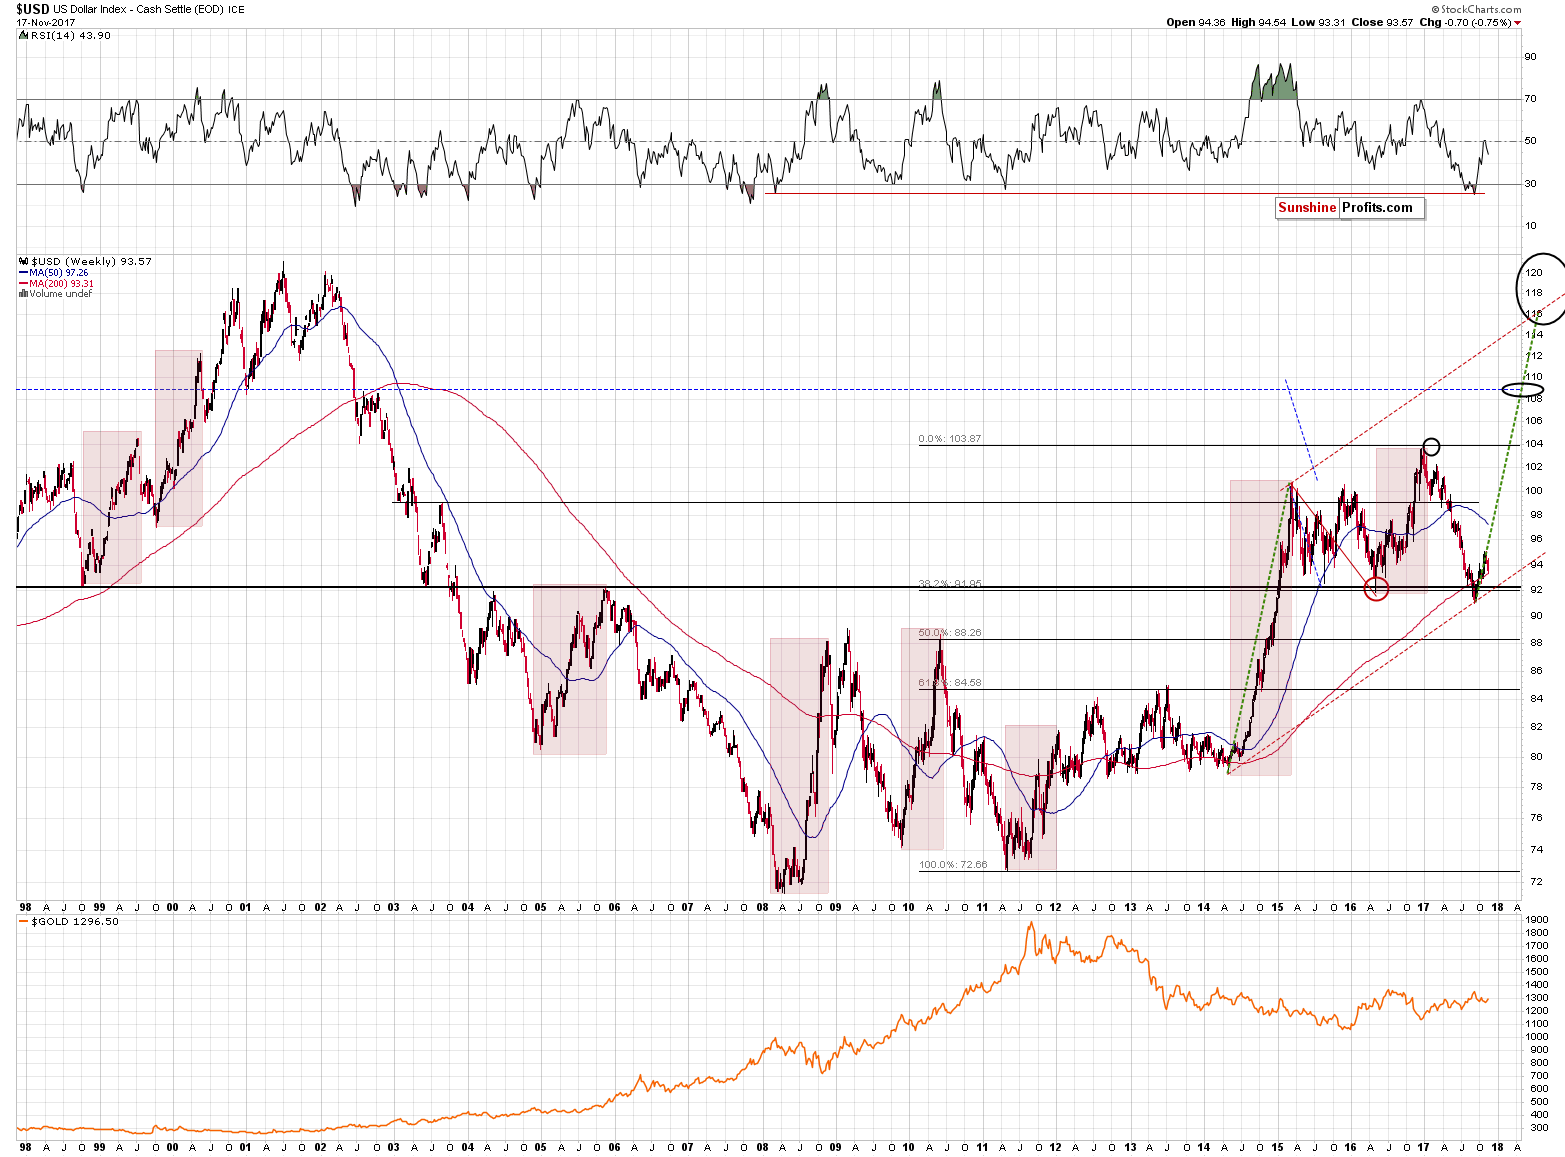
In light of the recent developments (namely, another week of lower prices instead of a rally toward the target area) we decided to take a closer look at the analogy to the previous major bottoms and the early parts of major rallies. It is often said that time is more important than price and we analyzed the previous upswings and the early corrections with the above in mind. Namely, we checked how long the initial rallies lasted and how long the USD was correcting. You will find the details below:
- 1998 – 1999: the initial rally: 6 weeks, followed by 2 weeks of declines
- 1999 - 2000 the initial rally: 7 weeks, followed by 5 weeks of declines
- 2005 - the initial rally: 6 weeks, followed by 4 weeks of declines
- 2008 - the initial rally: 7 weeks, followed by 5 weeks of declines
- 2009 – 2010 - the initial rally: 4 weeks, followed by 3 weeks of declines
- 2011 - the initial rally: 10 weeks, followed by 2-5 (unclear) weeks of declines
- 2014 - 2015 - the initial rally: 4 weeks, followed by 4 weeks of declines
- 2016 - the initial rally: 4 weeks, followed by 3 weeks of declines
- 2017 (current upswing) - the initial rally: 7? weeks, followed by 3? weeks of declines
The initial rallies lasted between 4 and 10 weeks with the 10 number being the outlier. The average is 6, while the most recent rally either took 7 weeks (quite in tune with the past patterns) or it’s not over yet with 10 weeks so far. If it’s not over, then it would need to rally for an additional week or two, thus making the entire rally even longer than the previous outlier at 11 or 12 weeks (or longer).
Is it therefore possible that the rally will still continue before a bigger correction is seen? Yes. Is it likely - no. Based on the above time analogies it’s more likely that the initial rally is already over and we are after 3 weeks of declines.
Is the above good or bad? Both. It’s good, because we’re likely closer to the big decline in the precious metals market than it first appeared, but it’s bad because we may not get a meaningful and tradable corrective upswing in the precious metals sector after the USD Index moves close to the 96 level. Ultimately, it’s not really a matter of deciding whether the current environment is better or worse, but adapting to it and tweaking the strategy so that it remains up-to-date with the most recent observations. After all, trading is like a game of poker - at times you will get a good hand and at times you will get a back hand, but by having a good strategy toward both situations you’ll likely come out ahead over time.
So, what’s the likely follow-up action from here? If we are indeed after 3 weeks of declines, then if we can estimate how long the rally is likely to last, we could check how long it should take, additionally, for the USD to bottom.
The average length of the correction is between 3.5 and 3.875 weeks depending on the interpretation of the 2011 action. We are already after 3 weeks and when you are reading this (we’re writing this over the weekend), we will already be in the fourth week.
What if instead of using the average, we take into account the most similar cases - where the initial rallies took 6 or 7 weeks. In this case we get an average of 4 weeks (based on 2, 5, 4, and 5 weeks). 5 weeks is the most common analogy (half of the cases), though.
Finally, what if we assume that the most recent rally (2016) is most likely to be repeated as it’s most similar fundamental-wise? In this case, we should expect the decline to take 3 weeks. In other words, it could be over.
All in all, if we average the above approaches, it seems that this week we are likely to see the bottom in the USD, but next week is also quite possible. There’s also a good change that the bottom was just formed.
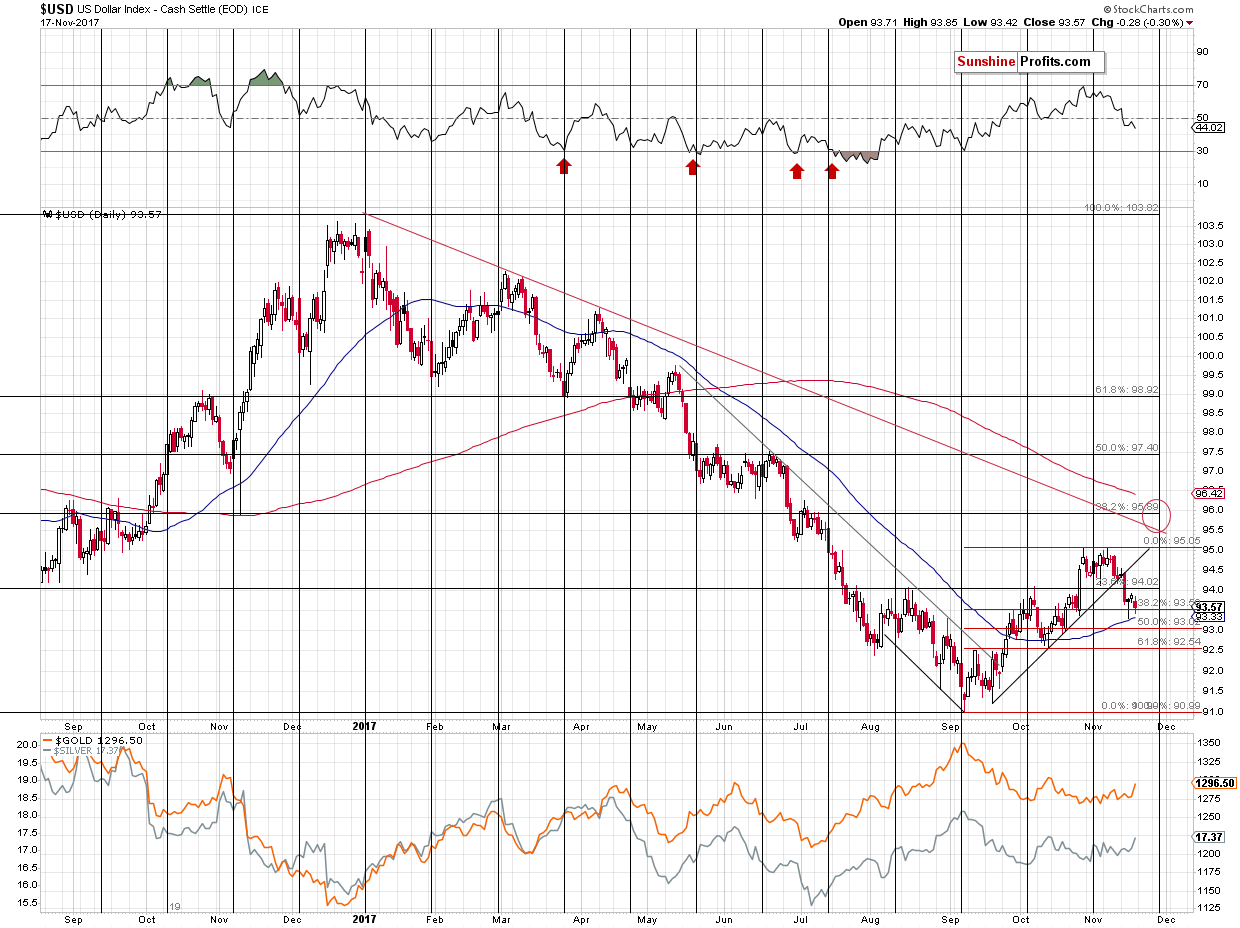
What about the price factor? The USD Index already moved to the 38.2% Fibonacci retracement level and it moved very close to the 50-day moving average. Technically, the bottom could be in. However, there are 2 additional support levels (50% and 61.8% Fibonacci retracements) that could be reached before the USD rallies further – that is if the USD Index didn’t bottom last week and we need to see the bottom this or (less likely) the next week.
What does it mean for the gold market? That the top in it could be in, or is at hand. The bottom part of the above chart allows you to see how gold has reacted to the USD’s decline so far. The reaction was rather small, despite Friday’s rally. The USD Index declined by about 1.5 index points and gold replied by rallying by only about $20. So, even if the USD was to move to 92.54 (about 1 index point lower) then this could translate into a $10 or $15 rally – certainly nothing to call home about.
What if the USD declines only to the 50% retracement and bottoms at about 93? In this case, gold would be likely to rally $7-$8 or so, which is next to nothing. If the bottom in the USD is already in, then the top in gold is in as well.
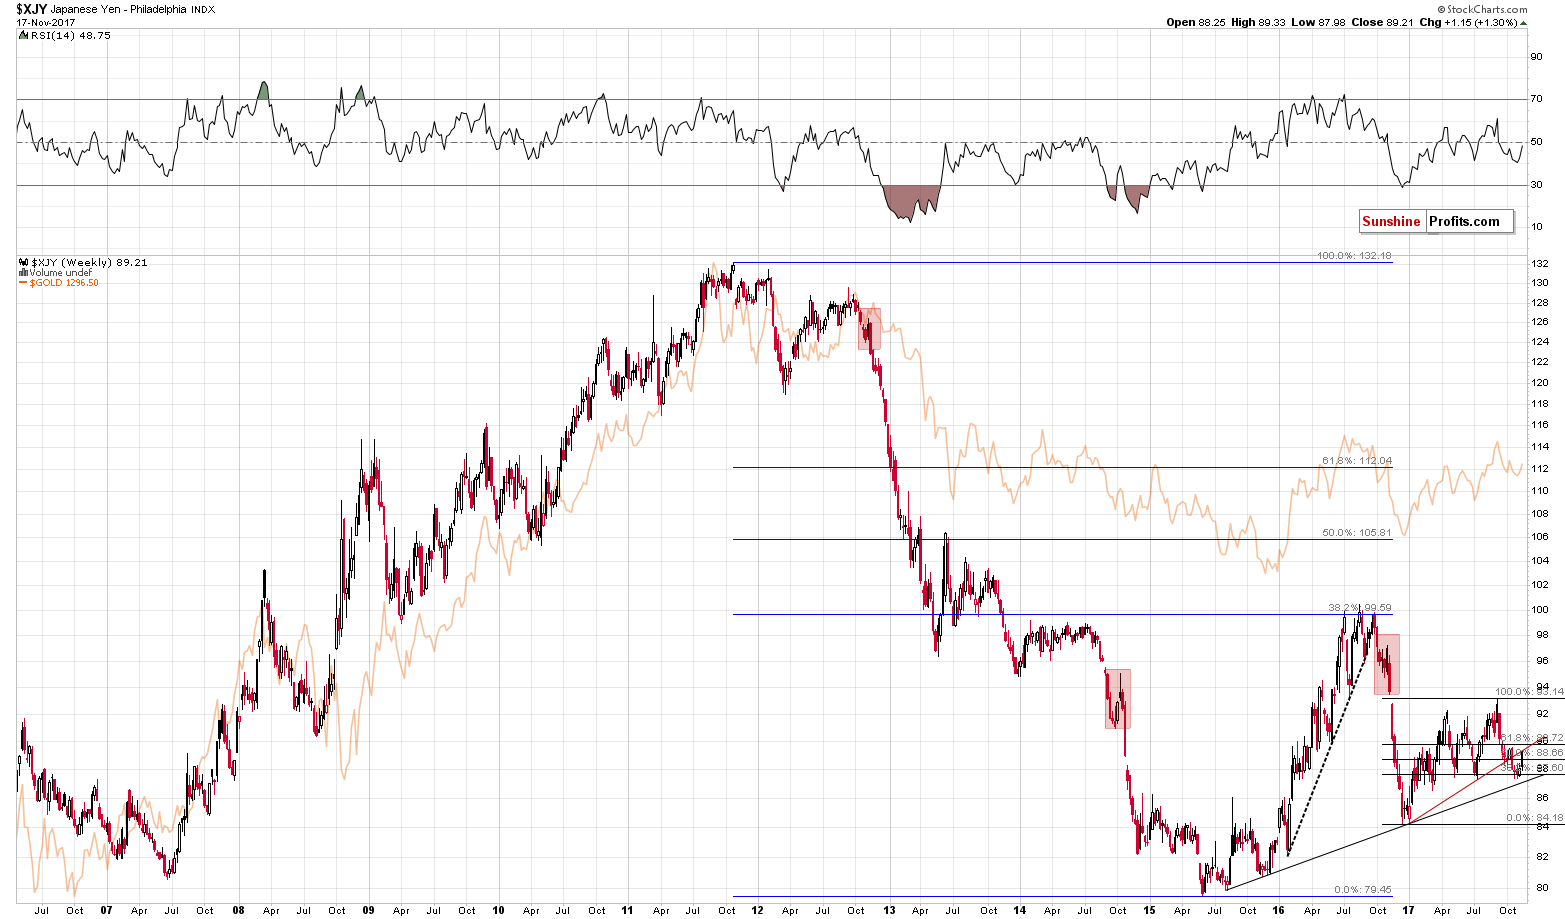
Gold’s big daily rally is likely linked to the sizable daily rally in the Japanese yen. What does it tell us? That the days of the rally could be numbered (and the remaining day count could be very close to 0) as the yen moved back to the previously broken rising support / resistance line based on the 2017 bottoms. A verification of a breakdown is rather normal, and it didn’t significantly change the outlook. This is especially the case if we note that the previous big downswings in the yen were characterized by sharp very short-term rallies in their early parts. We marked those situations with red rectangles.
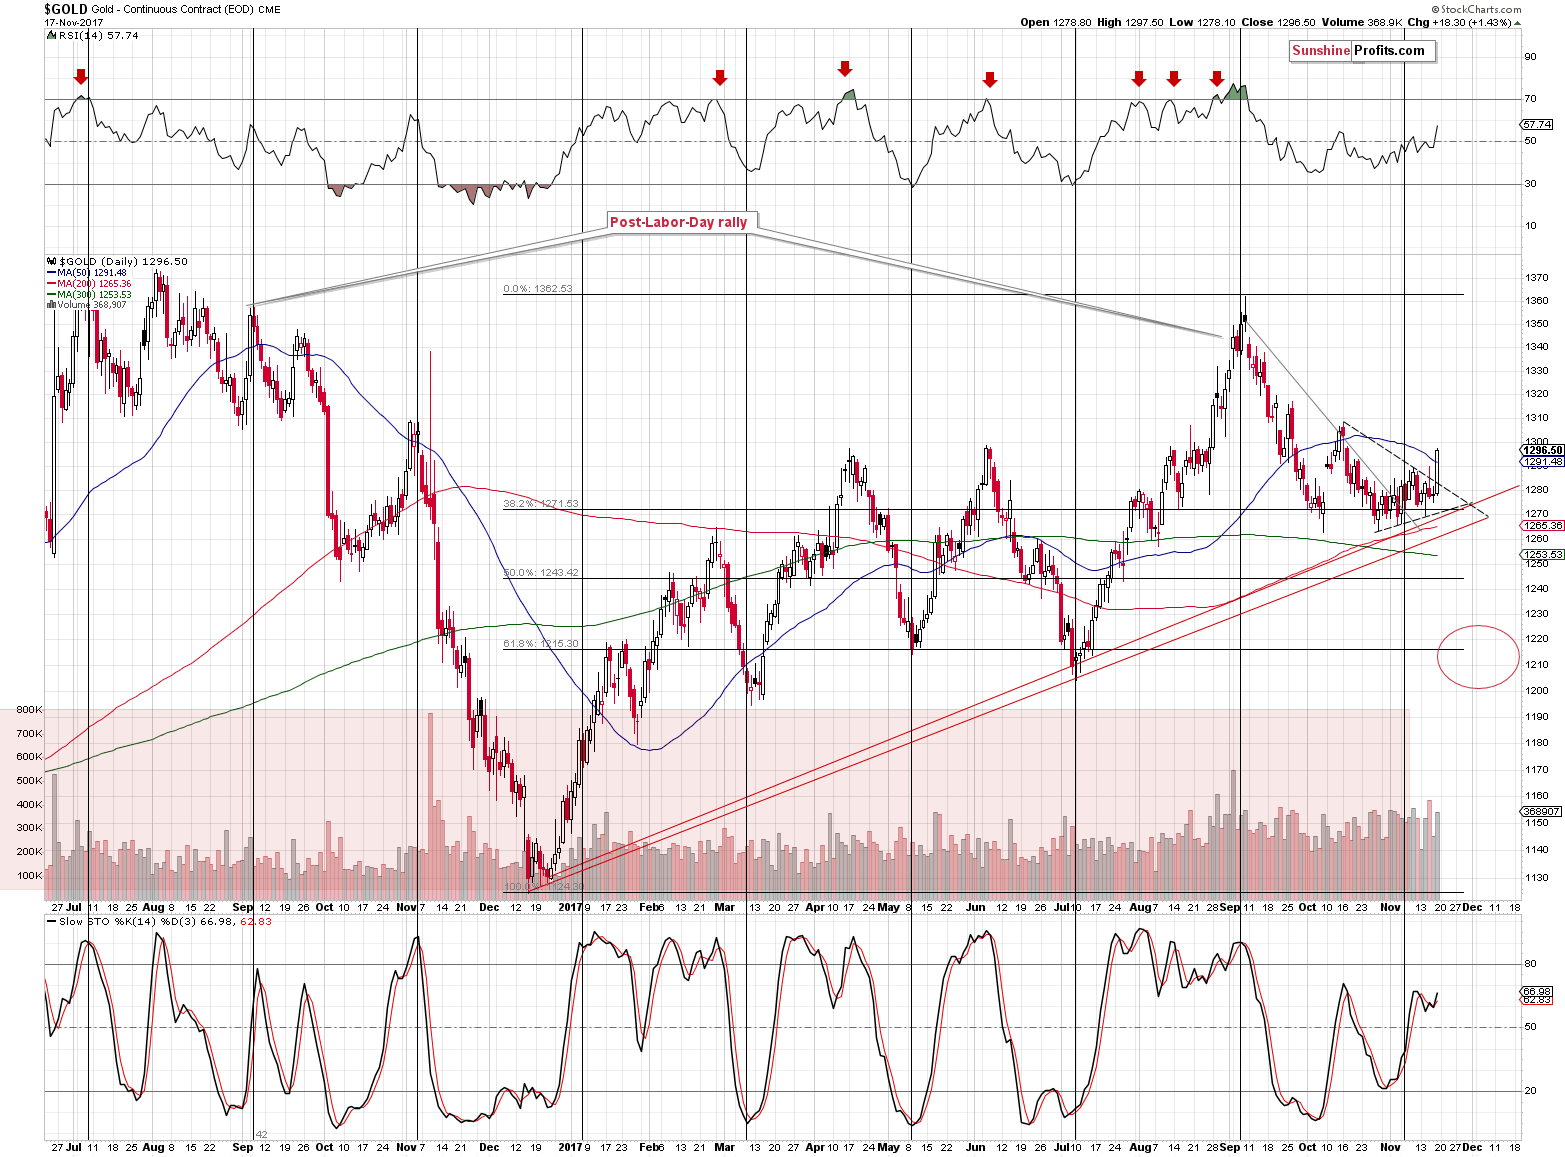
Looking at gold and taking the previous comments regarding the USD Index into account suggests that the yellow metal could move to its October high before moving south again. Alternatively, it could slide and invalidate Friday’s breakout just as it invalidated its upswing in November 2016.
Speaking of Friday’s breakout – it was quite visible and sharp, but it was just one daily close above the upper border of the triangle, so it’s not certain (or even likely) that it can be trusted.
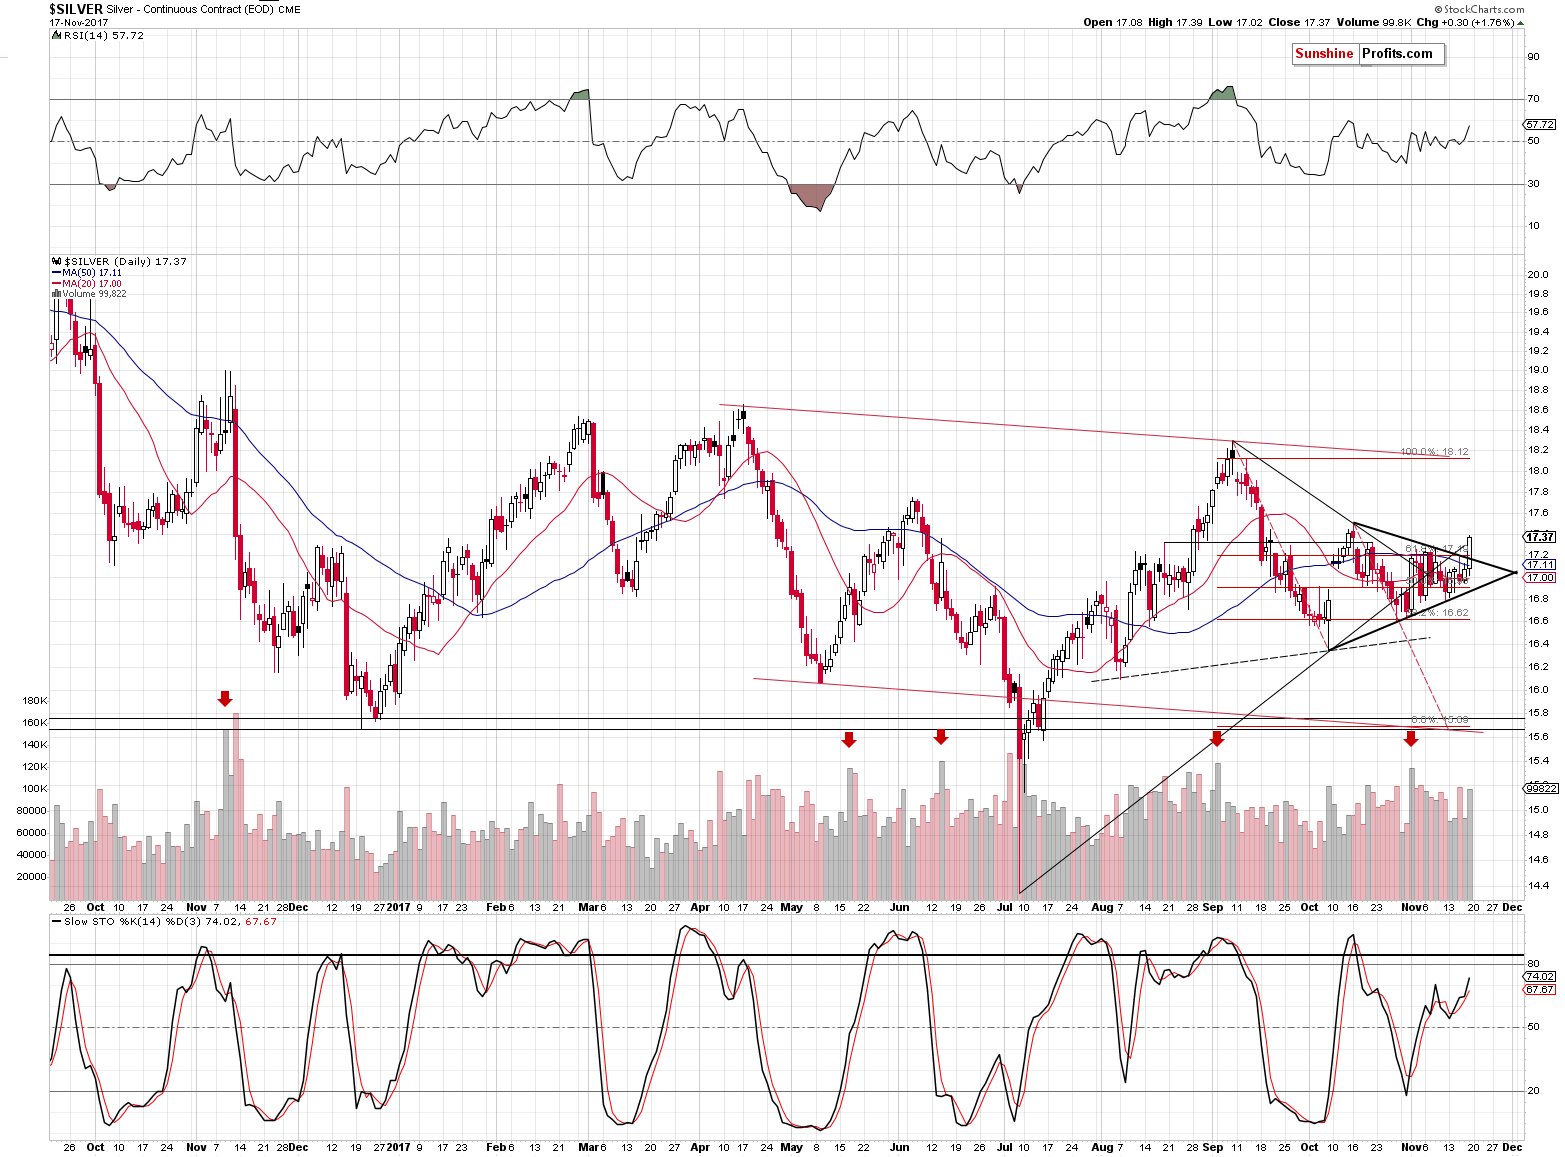
Silver is even closer to the October highs, outperforming gold once again. It’s usually not a bullish sign and the same is the case this time, however, let’s keep in mind that if the rally is not yet over, but about to be over, then silver could outperform gold some more before turning south. The price target for the upswing is unclear at this time, though.
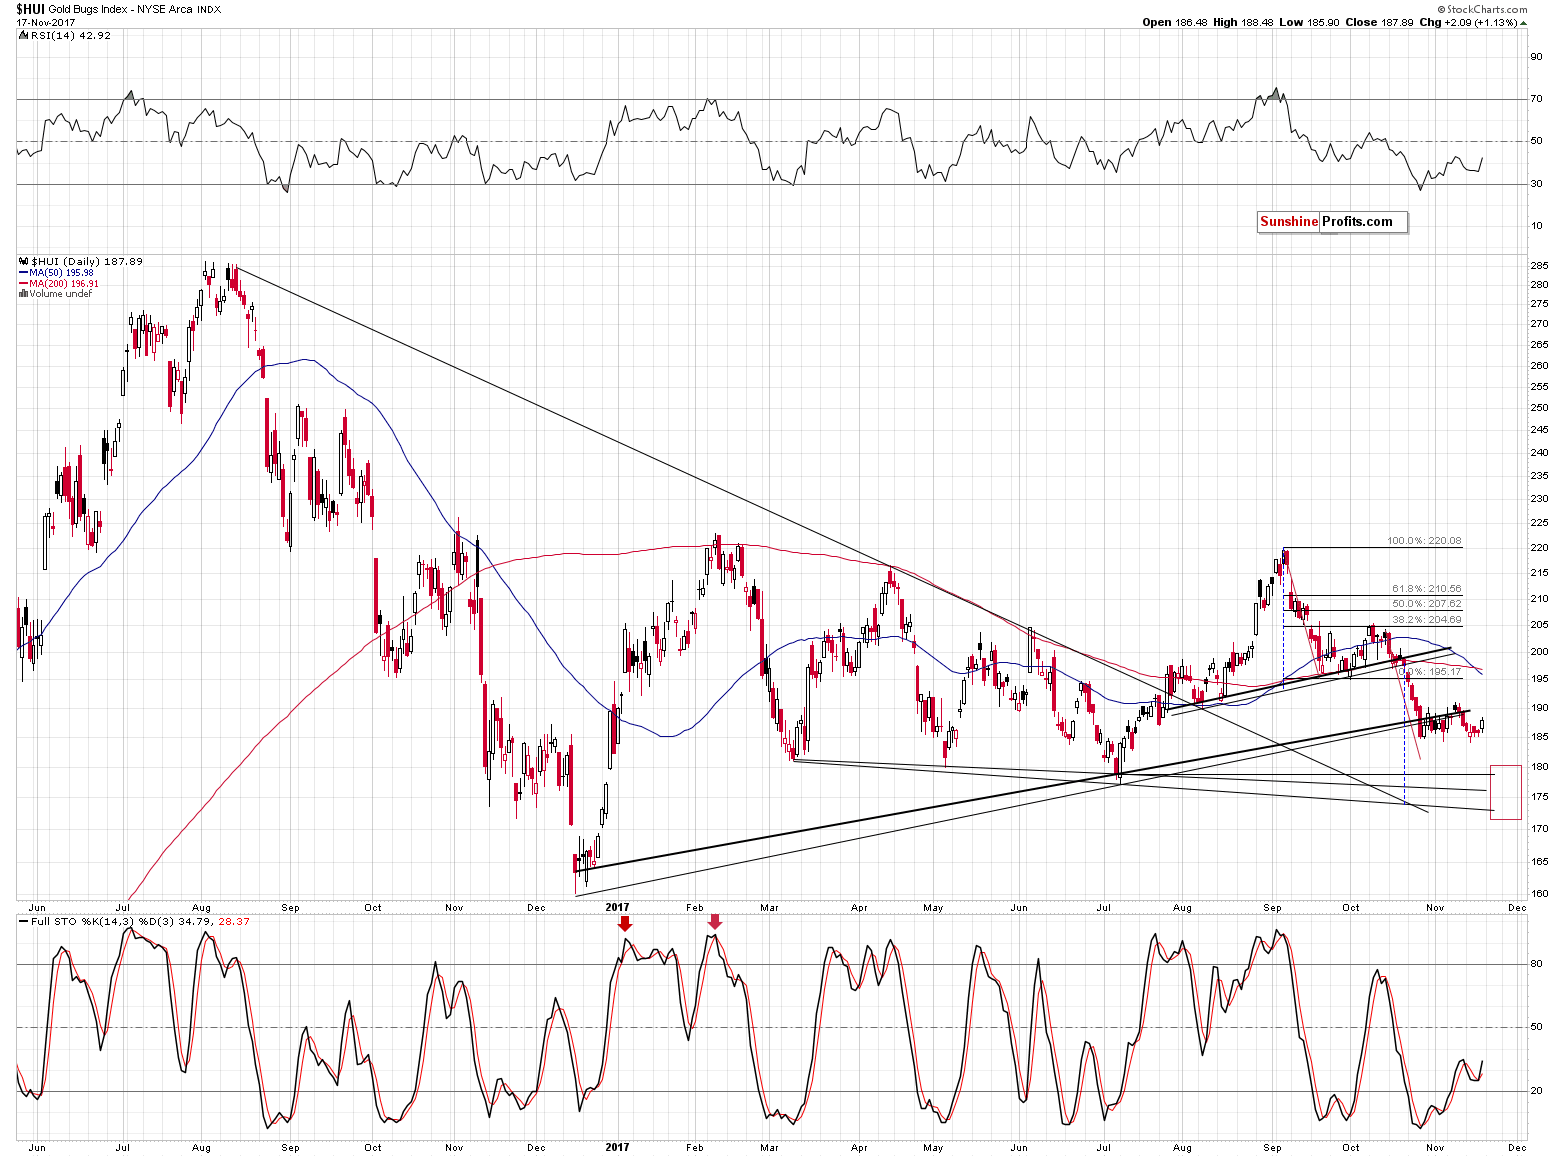
While silver is close to its October high, gold stocks are not even above their November high. Miners continue to underperform in a clear way and this suggests that one should be prepared for another big wave down, not up.
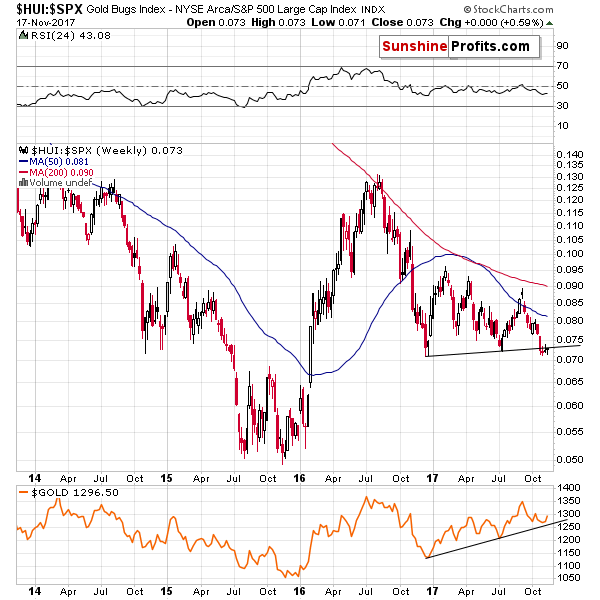
Moreover, the breakdown below the medium-term support line in the gold stocks to the general stock market ratio wasn’t invalidated, so we have another weekly close below it. The implications are clearly bearish for the following weeks and months.
Summing up, based on how the powerful rallies in the USD Index started and the characteristics of the initial corrections, it seems that the final decline in the precious metals market could accelerate sooner than previously expected, but the odds increased for no additional meaningful and tradable counter-trend rally beforehand. It could still be seen and gold’s breakout could be invalidated shortly, but the scenario in which the final visible correction is ending instead of being just around the corner, got more probable.
Naturally, the medium-term outlook remains bearish, especially that the analogy to the 2012-2013 decline remains in place and the previously discussed long-term signals remain in place: gold’s huge monthly volume, the analogy in the HUI Index, the analogy between the two most recent series of interest rate hikes, and the RSI signal from gold priced in the Japanese yen.
As always, we will keep you – our subscribers – informed.
To summarize:
Trading capital (supplementary part of the portfolio; our opinion): Short positions (150% of the full position) in gold, silver and mining stocks are justified from the risk/reward perspective with the following stop-loss orders and exit price levels / profit-take orders:
- Gold: exit price: $1,218; stop-loss: $1,366; exit price for the DGLD ETN: $51.98; stop-loss for the DGLD ETN $38.74
- Silver: exit price: $15.82; stop-loss: $19.22; exit price for the DSLV ETN: $28.88; stop-loss for the DSLV ETN $17.93
- Mining stocks (price levels for the GDX ETF): exit price: $21.23; stop-loss: $26.34; exit price for the DUST ETF: $29.97; stop-loss for the DUST ETF $21.37
In case one wants to bet on junior mining stocks' prices (we do not suggest doing so – we think senior mining stocks are more predictable in the case of short-term trades – if one wants to do it anyway, we provide the details), here are the stop-loss details and exit prices:
- GDXJ ETF: exit price: $30.28; stop-loss: $45.31
- JDST ETF: exit price: $66.27; stop-loss: $43.12
Long-term capital (core part of the portfolio; our opinion): No positions (in other words: cash)
Insurance capital (core part of the portfolio; our opinion): Full position
Important Details for New Subscribers
Whether you already subscribed or not, we encourage you to find out how to make the most of our alerts and read our replies to the most common alert-and-gold-trading-related-questions.
Please note that the in the trading section we describe the situation for the day that the alert is posted. In other words, it we are writing about a speculative position, it means that it is up-to-date on the day it was posted. We are also featuring the initial target prices, so that you can decide whether keeping a position on a given day is something that is in tune with your approach (some moves are too small for medium-term traders and some might appear too big for day-traders).
Plus, you might want to read why our stop-loss orders are usually relatively far from the current price.
Please note that a full position doesn’t mean using all of the capital for a given trade. You will find details on our thoughts on gold portfolio structuring in the Key Insights section on our website.
As a reminder – “initial target price” means exactly that – an “initial” one, it’s not a price level at which we suggest closing positions. If this becomes the case (like it did in the previous trade) we will refer to these levels as levels of exit orders (exactly as we’ve done previously). Stop-loss levels, however, are naturally not “initial”, but something that, in our opinion, might be entered as an order.
Since it is impossible to synchronize target prices and stop-loss levels for all the ETFs and ETNs with the main markets that we provide these levels for (gold, silver and mining stocks – the GDX ETF), the stop-loss levels and target prices for other ETNs and ETF (among other: UGLD, DGLD, USLV, DSLV, NUGT, DUST, JNUG, JDST) are provided as supplementary, and not as “final”. This means that if a stop-loss or a target level is reached for any of the “additional instruments” (DGLD for instance), but not for the “main instrument” (gold in this case), we will view positions in both gold and DGLD as still open and the stop-loss for DGLD would have to be moved lower. On the other hand, if gold moves to a stop-loss level but DGLD doesn’t, then we will view both positions (in gold and DGLD) as closed. In other words, since it’s not possible to be 100% certain that each related instrument moves to a given level when the underlying instrument does, we can’t provide levels that would be binding. The levels that we do provide are our best estimate of the levels that will correspond to the levels in the underlying assets, but it will be the underlying assets that one will need to focus on regarding the signs pointing to closing a given position or keeping it open. We might adjust the levels in the “additional instruments” without adjusting the levels in the “main instruments”, which will simply mean that we have improved our estimation of these levels, not that we changed our outlook on the markets. We are already working on a tool that would update these levels on a daily basis for the most popular ETFs, ETNs and individual mining stocks.
Our preferred ways to invest in and to trade gold along with the reasoning can be found in the how to buy gold section. Additionally, our preferred ETFs and ETNs can be found in our Gold & Silver ETF Ranking.
As a reminder, Gold & Silver Trading Alerts are posted before or on each trading day (we usually post them before the opening bell, but we don't promise doing that each day). If there's anything urgent, we will send you an additional small alert before posting the main one.
=====
Latest Free Trading Alerts:
Two weeks ago, the London Bullion Market Association published a new edition of its quarterly journal called “Alchemist”. What can we learn from this publication?
S&P 500 index lost 0.3% on Friday, as it retraced some of Thursday's rally. Is this a short-term topping pattern or just pause before another leg up?
Uncertainty Along Record Highs, Will Stocks Continue Higher?
=====
Hand-picked precious-metals-related links:
PRECIOUS-Gold slips on stronger dollar, but still near one-month high
Gold Speculators Slightly Lowered Bullish Net Positions This Week
Norilsk Nickel to increase 2017 palladium purchases
=====
In other news:
Goldman Sachs Sees Four 2018 Fed Rate Hikes as U.S. Growth Gains
Europe Faces a Hamstrung Germany as Merkel's Coalition Bid Fails
Euro Shrugs Off German Impasse as Stocks Rebound: Markets Wrap
Iran says majority of OPEC members support extending oil output cuts
Philippines' Duterte keeps open pit mining ban in policy clash
=====
Thank you.
Sincerely,
Przemyslaw Radomski, CFA
Founder, Editor-in-chief, Gold & Silver Fund Manager
Gold & Silver Trading Alerts
Forex Trading Alerts
Oil Investment Updates
Oil Trading Alerts

