

Briefly: In our opinion, full (150% of the regular full position) speculative short positions in gold, silver and mining stocks are justified from the risk/reward perspective at the moment of publishing this alert.
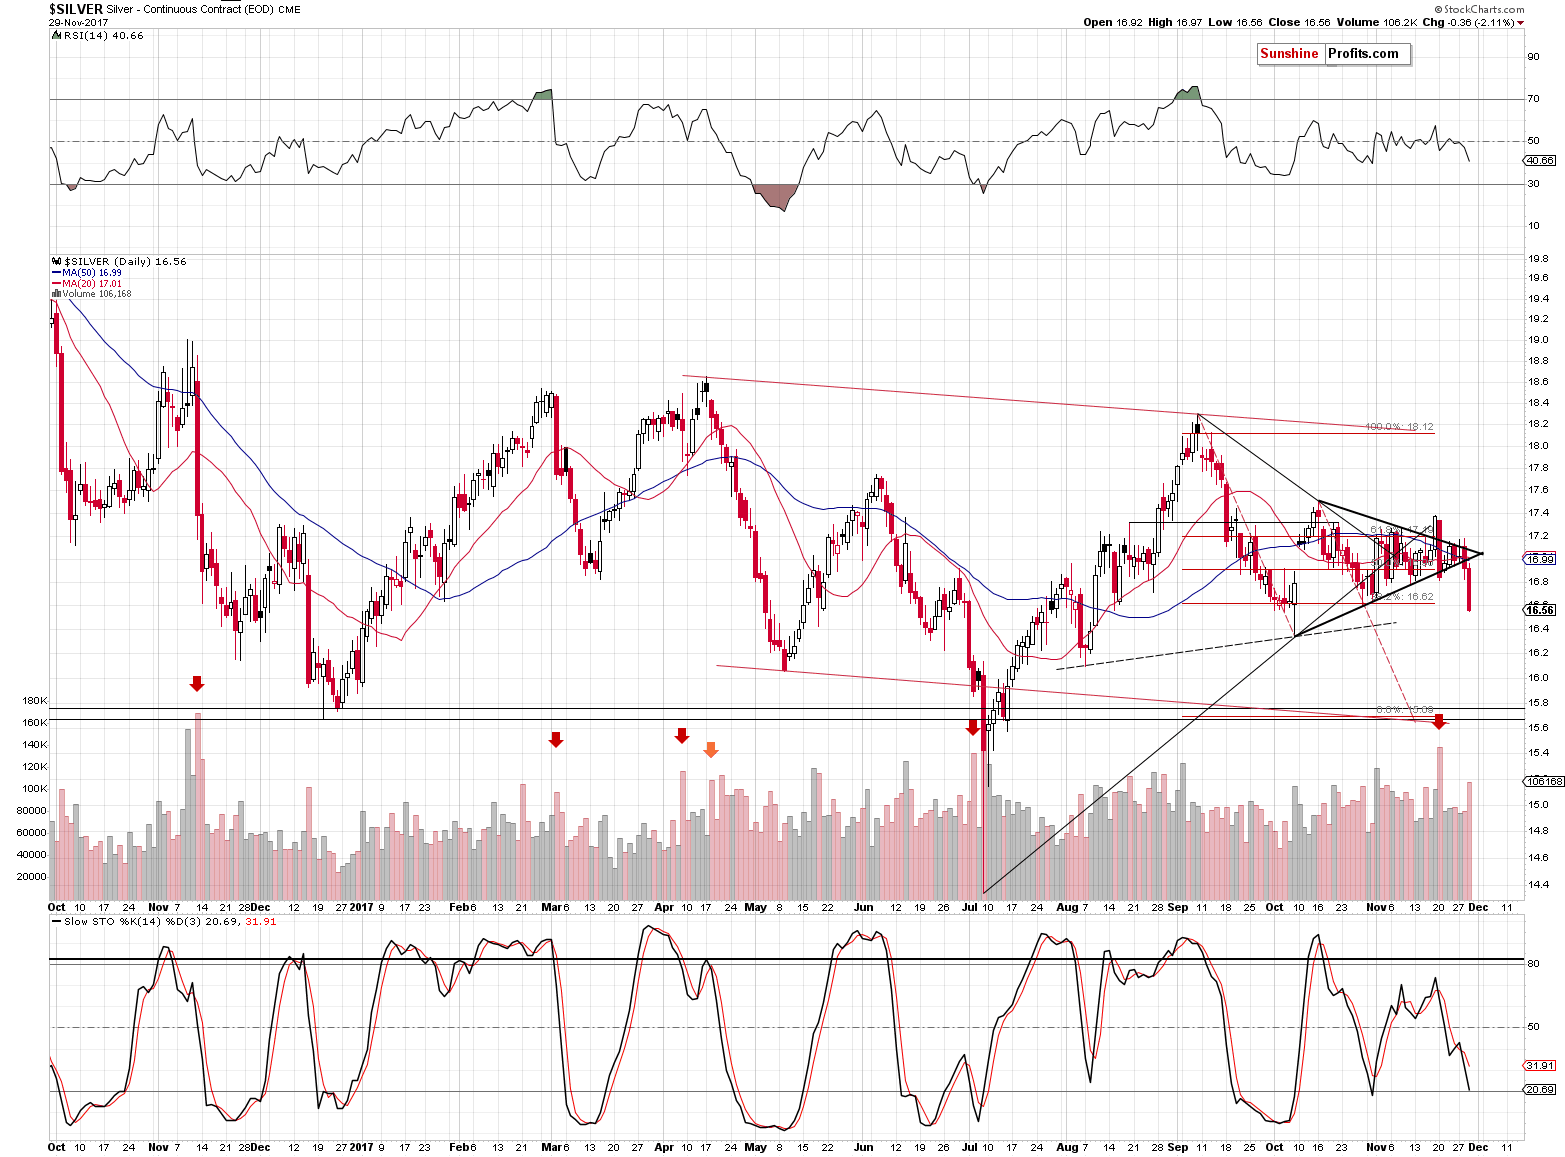
It was only two weeks ago when silver moved sharply higher, closed the day a little below $17.40 and broke above the triangle pattern. Two weeks was all it took for the white metal not only to invalidate this breakout, but to slide below the triangle pattern and end the day at the levels not seen since… August 8th. That’s right – even though silver moved temporarily lower in October, it never closed below the August 8th low. Until yesterday.
What’s exceptionally interesting is that while silver declined so visibly, gold didn’t even invalidate its breakout above its own triangle pattern – it closed over $10 above it. What should one make of all the above? Which market is giving false signals and which one is leading?
This case is quite difficult and complex, so let’s re-examine the clues that we have, starting with the two markets that we described above (chart courtesy of http://stockcharts.com).
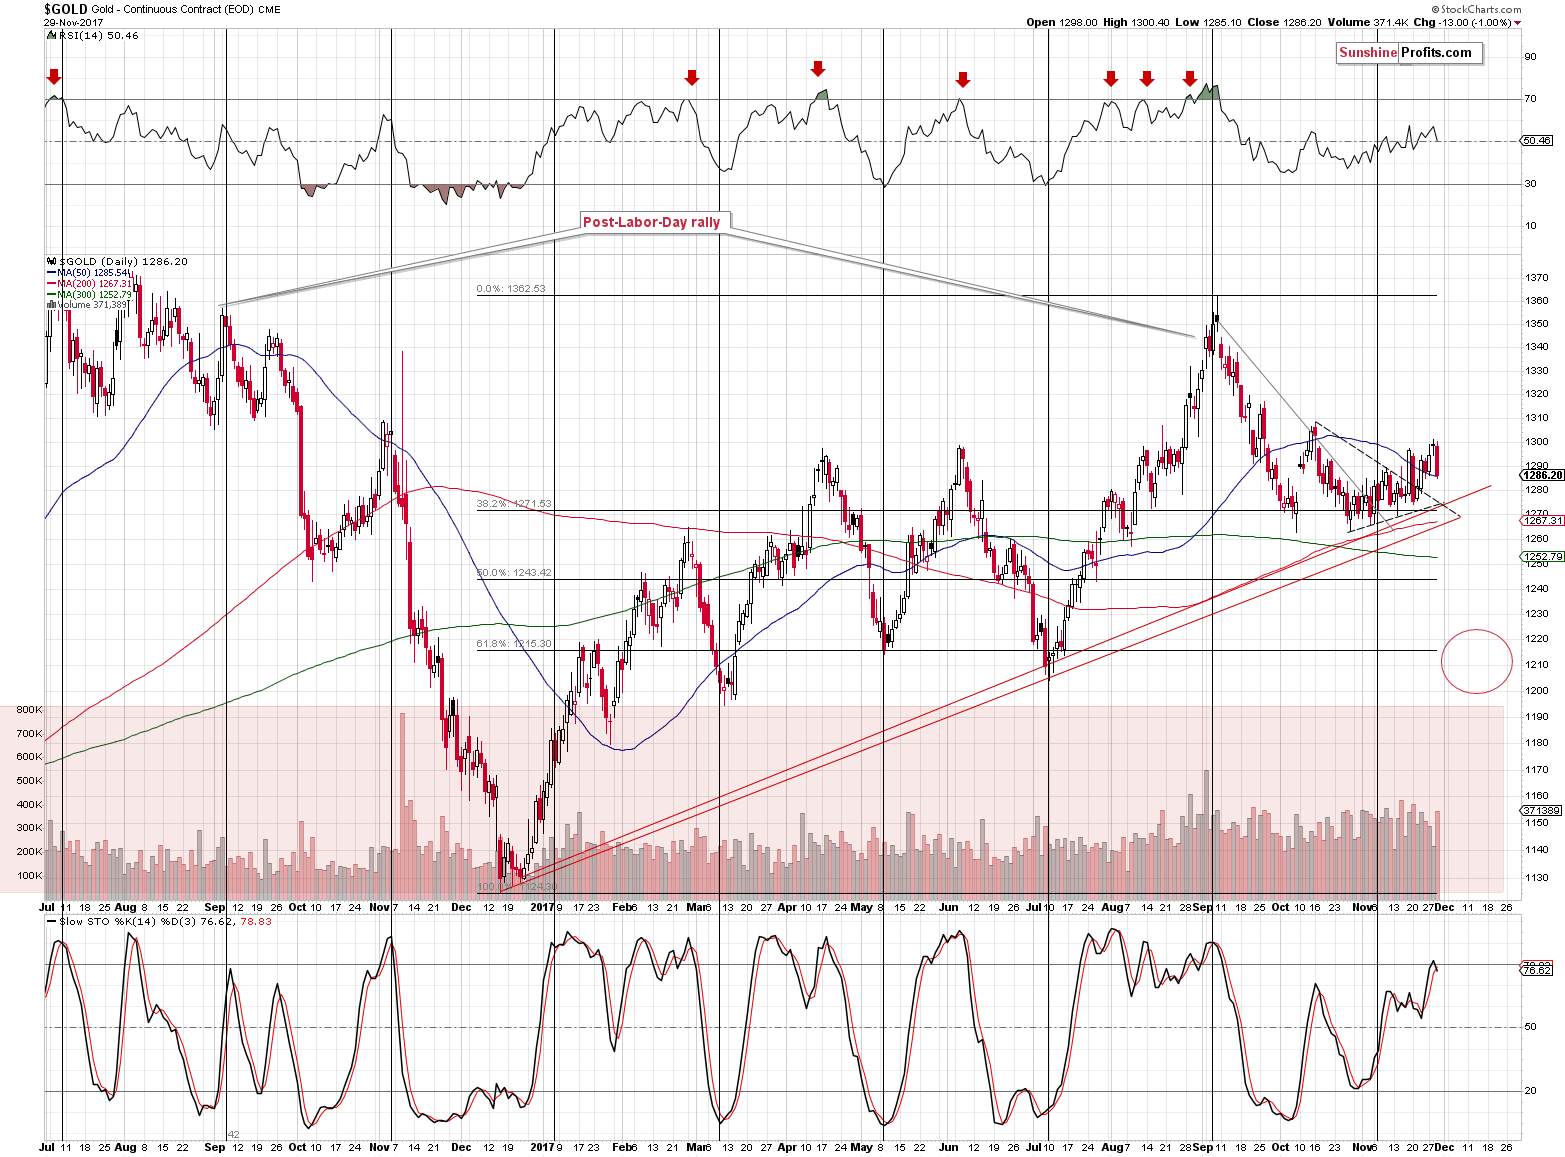
Two triangles, one breakout and one breakdown. So far the pictures are contradictory. But, who said that the analysis ends at just one pattern? Still, let’s stick to it for a while. The patterns are not identical – their apexes are a few days apart. What does it mean? Quite a lot, since these apexes are likely to mark a turnaround in each market.
In the case of gold, the apex was either yesterday or it is today and… It seems that we have seen a turnaround as well. In the case of silver, the apex is still a few days away.
Now, if this technique was to remain in place in the case of gold, then in light of the previous rally, the yellow metal shouldn’t start its decline until the apex day or in its very close proximity. That’s exactly what happened.
Silver’s apex day is still ahead, so if this technique were to work for the silver market, the white metal would need to either prolong the rally even longer than gold and top later or to start the decline sooner and form a local bottom at or close to the apex day.
What happened could be combination of the above and the way things developed in the USD Index. The latter declined and then reversed – the precious metals had all the reasons they needed to either move up or down. Based on differences in timing relative to the triangles and their apexes, different price paths followed.
Was it definitely as described above? No, there’s no way of knowing for sure why thousands of traders pressed the buy buttons while others were pressing sell buttons and all we can do is to speculate on the bigger reasons behind those moves. However, in the absence of other important explanations and in light of the recent rally in the general stock market, which “should have” made silver outperform gold due to the multitude of the former’s industrial applications, the above explanation seems to be most believable. What happened was not logical and it was likely emotional. The way to handle and measure emotionality in the market is technical analysis, and price patterns – like triangles – are part of it. Consequently, it could have been as described above.
What does it mean going forward? By having a technical explanation for gold’s outperformance, we can assume there’s nothing more about this divergence that would cause the precious metals to rally shortly. It is often the case that silver’s moves are fake if they are not confirmed by the rest of the precious metals market, so in general if gold points to one direction and silver points to the other, gold’s direction is the correct one. However, at this time, it seems that the entire divergence is rather neutral and no reason to adjust the current short positions.
Besides, there’s more to gold and silver analysis than just the triangles and there’s definitely more to the analysis of the entire precious metals sector.
We already described the price-volume details in the past few alerts and the implications of this link remain bearish also today.
The confirmations coming from mining stocks are even more important.
In the previous alerts, we wrote the following:
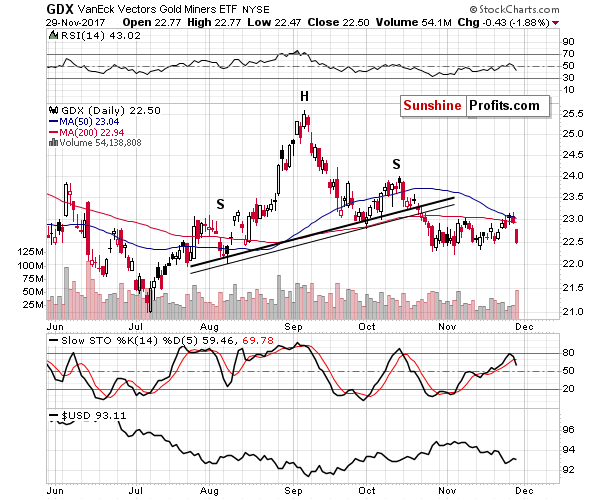
Mining stocks rallied on relatively low volume, which is a bearish sign in general. Another thing is that the Stochastic moved to the 80 level, which indicates topping action (just like it was the case in June and October). Finally, mining stocks moved to the 50-day moving average, without breaking above it. The latter could easily serve as the key resistance - that was more or less the case in June and October (just like it was the case with Stochastic).
Miners declined yesterday on volume that was slightly higher than what we had seen during Monday’s upswing and the implications are bearish. The same goes for the Stochastic indicator that just reversed after touching the 80 level.
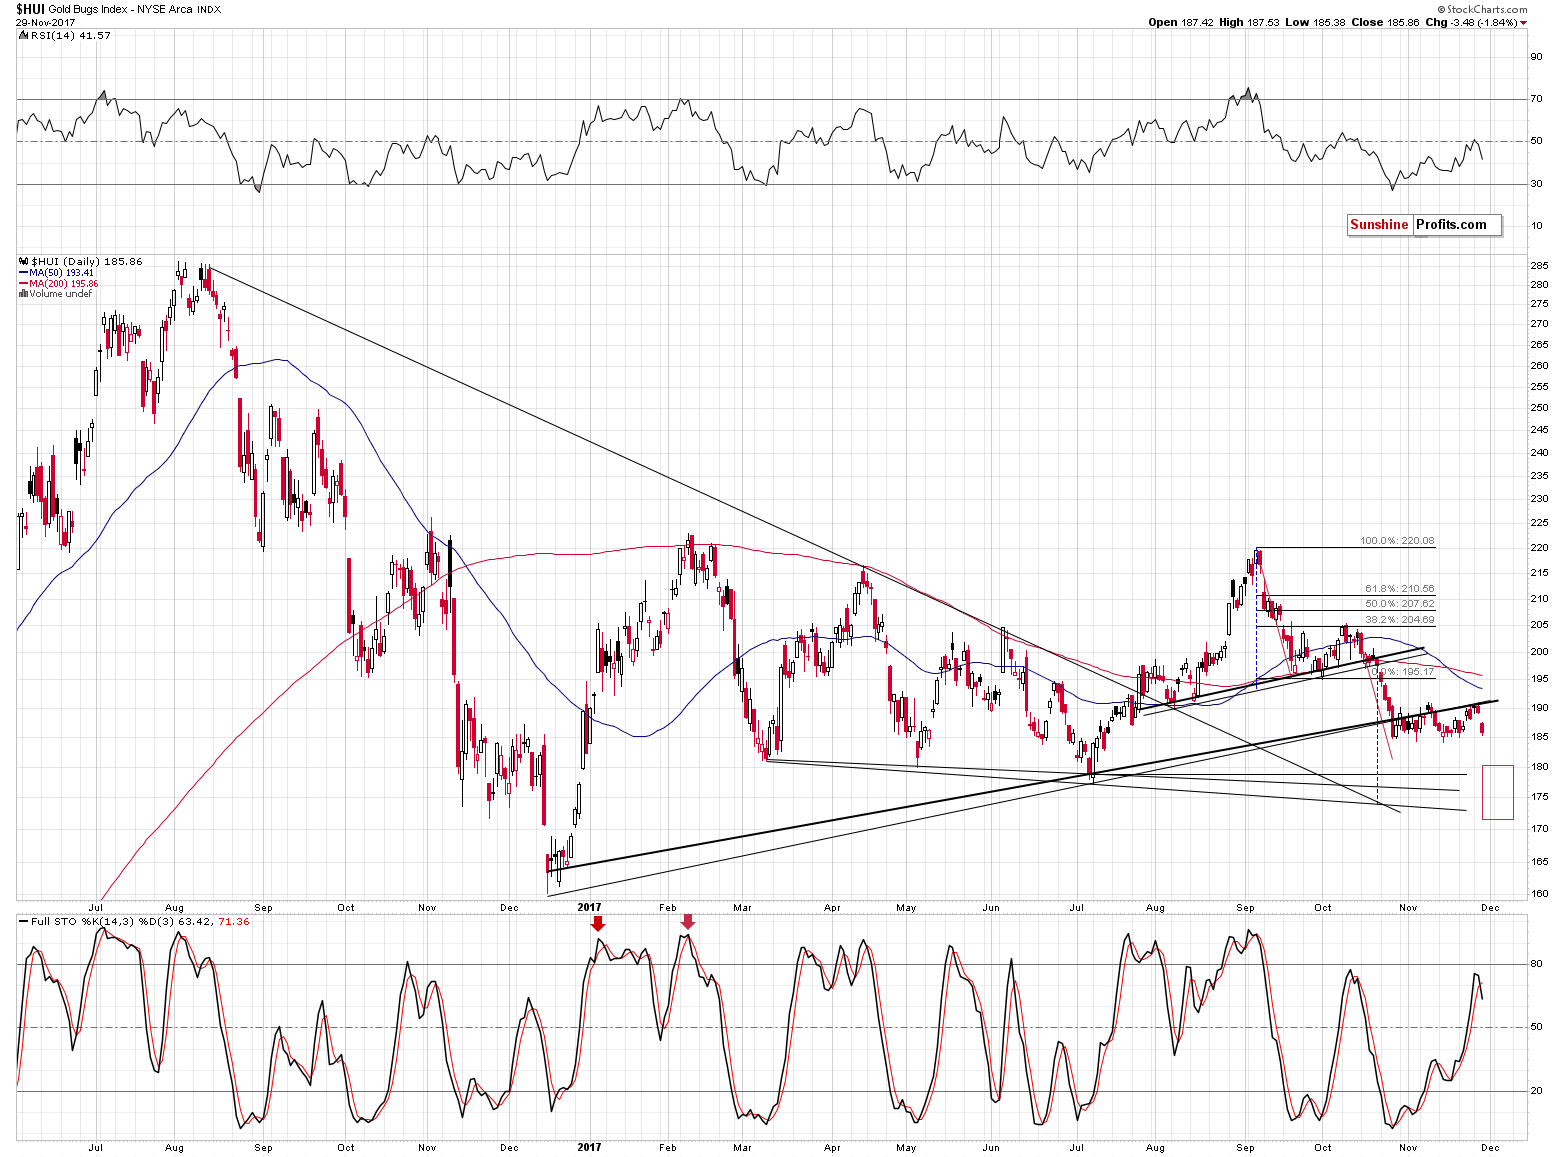
We can say almost the same about yesterday’s decline. Almost – because it was far from being slight. The decline took miners from their monthly high (Tuesday’s intraday high) to the levels of the October and November lows in terms of the closing prices. The volume was huge in absolute and relative terms.
In other words, mining stocks seem to have verified the breakdown below the rising support lines (as seen on the HUI Index chart) and the 50-day moving average, and at the same time they underperformed gold to a great extent. That’s a powerful bearish combination.
We usually include the USD Index in our analyses and this day will not be different, but today we will also add the euro index as we would like to get back to the topic of the “mutant” head and shoulders pattern.
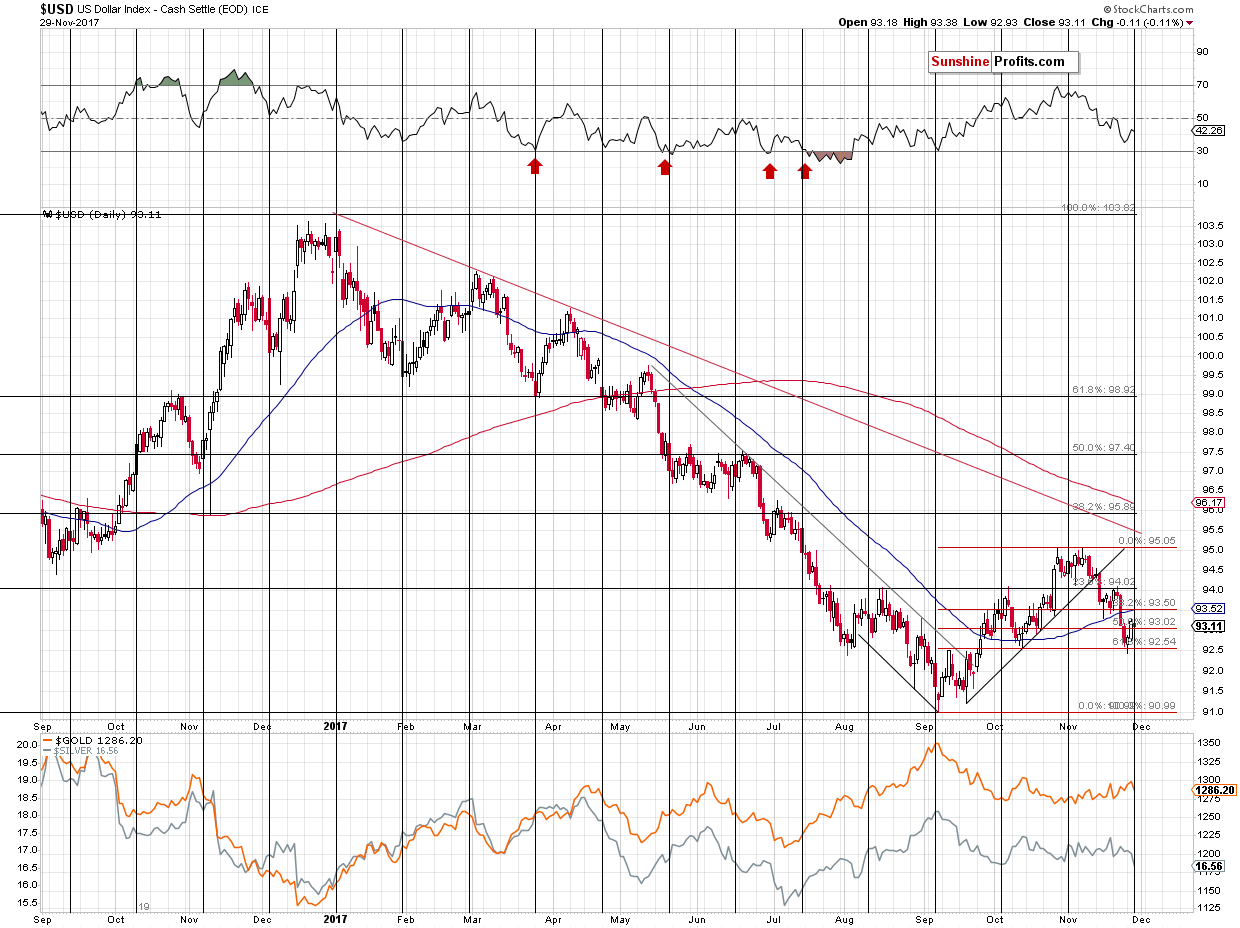
The USD Index didn’t do much yesterday and the outlook for precious metals and mining stocks is even more bearish, in light of this. The USD Index itself seems to have bottomed and our previous comments remain up-to-date:
In Monday’s alert, we wrote about a possible move below the 61.8% Fibonacci retracement level and a subsequent invalidation – that’s exactly what we saw during Monday’s session. Yesterday’s session further confirmed that the local bottom might be in.
The Monday reversal took place quite close to the cyclical turning point, which further increases the odds that the bottom is really in. Based on the analogy in terms of time to the previous corrections in the early parts of major rallies in the USD, this is likely.
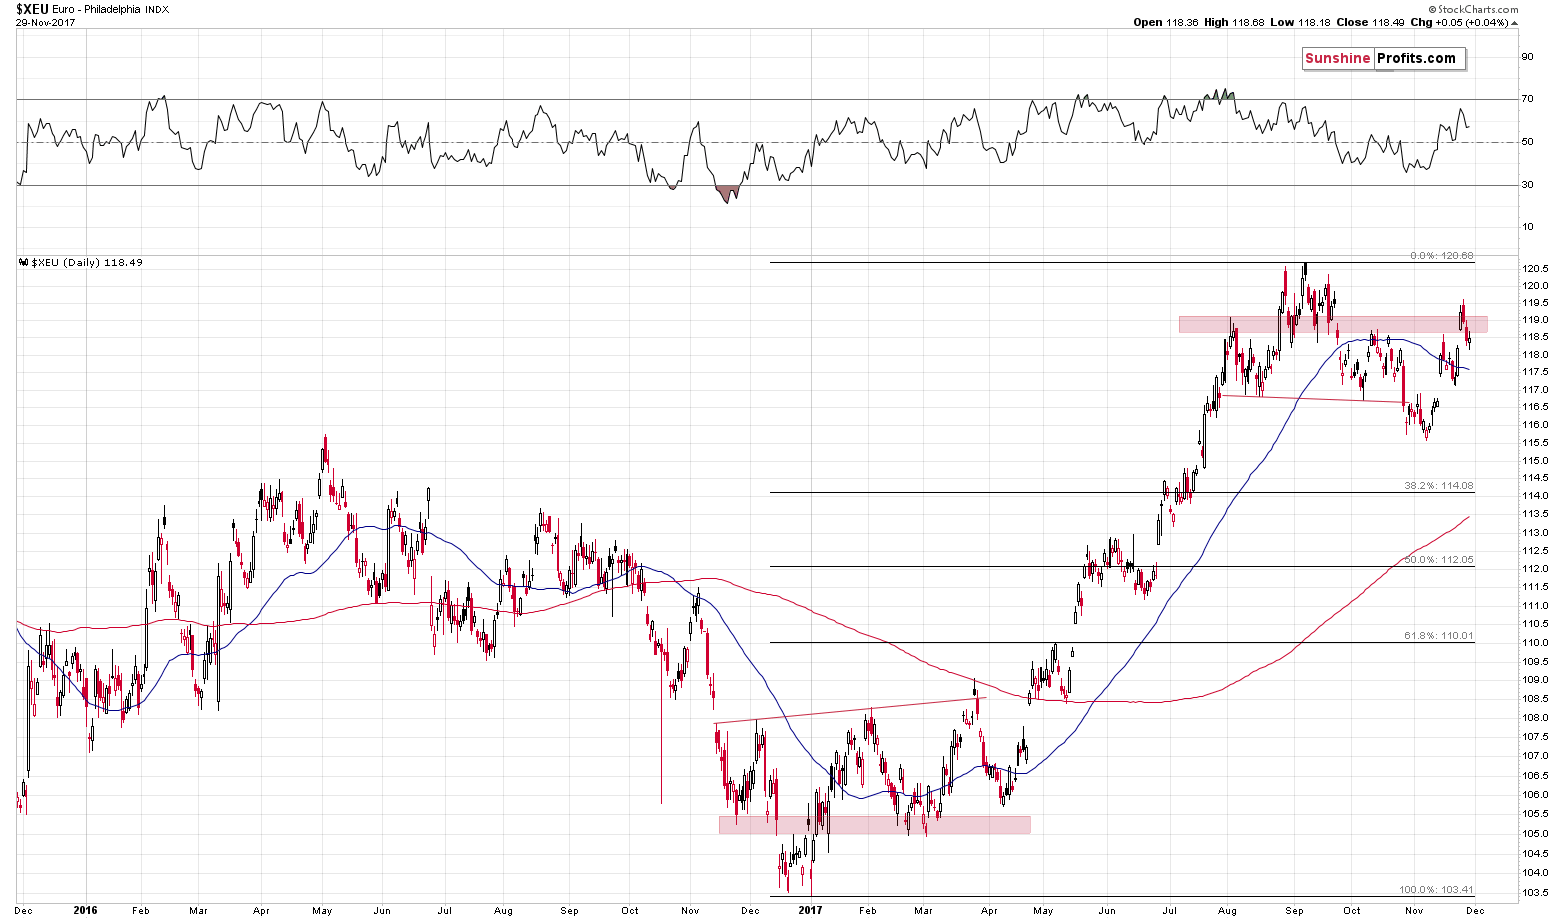
It was about two weeks ago when we wrote about the above euro chart, so it seems that quoting our previous analysis might be useful:
The euro soared back above the neck level of its head and shoulders formation and thus invalidating it. The invalidation was immediately followed by a rally (it’s usually prudent to wait for a confirmation of a breakdown, invalidations often result in immediate price moves) and a subsequent reversal that we saw yesterday. Are the implications going forward still bullish?
We have only one analogous situation in the recent past and that’s what happened between November 2016 and March 2017. Back then the formation was the reverse head and shoulders, which is analogous to the current one (only reversed). The size of the formation and the time that it took are similar, but that’s not all. That formation was also followed by an invalidation and a move close to the previous shoulders (red rectangle on the above chart). During this move the euro moved to the 50-day moving average and crossed it, but invalidated the move shortly.
So far the similarity continues. Please recall that the more similarities there are and the longer they continue, the more likely it is that the similarity will continue for the short term. If history is to rhyme, then what can we expect to happen next? Something analogous to what happened in April – a formation of another right shoulder (thus a “mutation”) and then a big move that was likely to happen based on the base version of the formation. In the current case, this means a downswing. Naturally, the implications are bullish for the USD Index and bearish for the prices of precious metals.
Even though the euro has moved higher since we wrote the above, the “mutant head and shoulders” pattern remains in place – the similarity has been upheld and in a way, the additional move higher has made the two patterns more alike. The reason is the position of the euro relative to its 50-day moving average. Back in April, the euro moved below the 50-day moving average and stayed there for about 10 trading days, so it’s not that surprising that it didn’t truly reverse in mid-November after moving above the moving average for just two days. However, now, two weeks after the breakout above the 50-day moving average, it seems that the true reversal could be taking place.
The implications are bearish for the euro and gold, but bullish for the USD Index.
Summing up, it seems that the divergence between gold and silver is based on technical grounds and is not a reason to get bullish on any of the precious metals. There are multiple other signs pointing to lower PM prices and the underperformance of mining stocks is the most visible one. In the recent alerts, we wrote that any short-term strength would be reversed sooner rather than later, especially if the decline in the USD Index was already over and we didn’t have to wait long for this to become reality. The big decline could already be underway.
Naturally, the medium-term outlook remains bearish, especially that the analogy to the 2012-2013 decline remains in place and the previously discussed long-term signals remain in place: gold’s huge monthly volume, the analogy in the HUI Index, the analogy between the two most recent series of interest rate hikes, and the RSI signal from gold priced in the Japanese yen.
As always, we will keep you – our subscribers – informed.
To summarize:
Trading capital (supplementary part of the portfolio; our opinion): Short positions (150% of the full position) in gold, silver and mining stocks are justified from the risk/reward perspective with the following stop-loss orders and exit price levels / profit-take orders:
- Gold: exit price: $1,218; stop-loss: $1,366; exit price for the DGLD ETN: $51.98; stop-loss for the DGLD ETN $38.74
- Silver: exit price: $15.82; stop-loss: $19.22; exit price for the DSLV ETN: $28.88; stop-loss for the DSLV ETN $17.93
- Mining stocks (price levels for the GDX ETF): exit price: $21.23; stop-loss: $26.34; exit price for the DUST ETF: $29.97; stop-loss for the DUST ETF $21.37
In case one wants to bet on junior mining stocks' prices (we do not suggest doing so – we think senior mining stocks are more predictable in the case of short-term trades – if one wants to do it anyway, we provide the details), here are the stop-loss details and exit prices:
- GDXJ ETF: exit price: $30.28; stop-loss: $45.31
- JDST ETF: exit price: $66.27; stop-loss: $43.12
Long-term capital (core part of the portfolio; our opinion): No positions (in other words: cash)
Insurance capital (core part of the portfolio; our opinion): Full position
Important Details for New Subscribers
Whether you already subscribed or not, we encourage you to find out how to make the most of our alerts and read our replies to the most common alert-and-gold-trading-related-questions.
Please note that the in the trading section we describe the situation for the day that the alert is posted. In other words, it we are writing about a speculative position, it means that it is up-to-date on the day it was posted. We are also featuring the initial target prices, so that you can decide whether keeping a position on a given day is something that is in tune with your approach (some moves are too small for medium-term traders and some might appear too big for day-traders).
Plus, you might want to read why our stop-loss orders are usually relatively far from the current price.
Please note that a full position doesn’t mean using all of the capital for a given trade. You will find details on our thoughts on gold portfolio structuring in the Key Insights section on our website.
As a reminder – “initial target price” means exactly that – an “initial” one, it’s not a price level at which we suggest closing positions. If this becomes the case (like it did in the previous trade) we will refer to these levels as levels of exit orders (exactly as we’ve done previously). Stop-loss levels, however, are naturally not “initial”, but something that, in our opinion, might be entered as an order.
Since it is impossible to synchronize target prices and stop-loss levels for all the ETFs and ETNs with the main markets that we provide these levels for (gold, silver and mining stocks – the GDX ETF), the stop-loss levels and target prices for other ETNs and ETF (among other: UGLD, DGLD, USLV, DSLV, NUGT, DUST, JNUG, JDST) are provided as supplementary, and not as “final”. This means that if a stop-loss or a target level is reached for any of the “additional instruments” (DGLD for instance), but not for the “main instrument” (gold in this case), we will view positions in both gold and DGLD as still open and the stop-loss for DGLD would have to be moved lower. On the other hand, if gold moves to a stop-loss level but DGLD doesn’t, then we will view both positions (in gold and DGLD) as closed. In other words, since it’s not possible to be 100% certain that each related instrument moves to a given level when the underlying instrument does, we can’t provide levels that would be binding. The levels that we do provide are our best estimate of the levels that will correspond to the levels in the underlying assets, but it will be the underlying assets that one will need to focus on regarding the signs pointing to closing a given position or keeping it open. We might adjust the levels in the “additional instruments” without adjusting the levels in the “main instruments”, which will simply mean that we have improved our estimation of these levels, not that we changed our outlook on the markets. We are already working on a tool that would update these levels on a daily basis for the most popular ETFs, ETNs and individual mining stocks.
Our preferred ways to invest in and to trade gold along with the reasoning can be found in the how to buy gold section. Additionally, our preferred ETFs and ETNs can be found in our Gold & Silver ETF Ranking.
As a reminder, Gold & Silver Trading Alerts are posted before or on each trading day (we usually post them before the opening bell, but we don't promise doing that each day). If there's anything urgent, we will send you an additional small alert before posting the main one.
=====
Latest Free Trading Alerts:
Yesterday, Yellen testified before the U.S. Congress. What do her remarks mean for the gold market?
Yellen’s Last Testimony before Congress and Gold
S&P 500 index was virtually flat on Wednesday, after reaching new all-time high. Is this a topping pattern or just pause before another leg up? Or will technology stocks weakness drive the broad stock market lower?
S&P 500 Fluctuates As Technology Stocks Sell Off
=====
Hand-picked precious-metals-related links:
Gold hits one-week low as dollar weighs
Gold production will grow in coming years: BMI
Robots will run mines within the next decade, Anglo says
UPDATE 1-Australia's new gold rush lures prospectors Down Under
=====
In other news:
Dollar rebounds off lows on policy hopes
Trump nominates Fed critic to board
Record high stocks? No problem yet, say U.S. asset managers: Reuters poll
Lucky 13? Stocks score longest run of monthly gains on record
Euro-Area Inflation Misses Estimates as Unemployment Falls
We’re being hurt by the fixation on economic growth at all costs
Goldman Says the Bitcoin Haters Just Don’t Get It
Mark Cuban: Bitcoin is more of a collectible than a currency
This Is What Could Pop the Bitcoin Bubble
A sign of the huge trade imbalance for global commodities: 45% of ships travel empty
=====
Thank you.
Sincerely,
Przemyslaw Radomski, CFA
Founder, Editor-in-chief, Gold & Silver Fund Manager
Gold & Silver Trading Alerts
Forex Trading Alerts
Oil Investment Updates
Oil Trading Alerts

