

Briefly: in our opinion, full (300% of the regular position size) speculative short positions in mining stocks are justified from the risk/reward point of view at the moment of publishing this Alert.
The technical part of today’s analysis is going to be definitely shorter than what I covered in yesterday's (Mar. 29) as the latter simply remains up-to-date and there’s no point in writing the same thing all over again. Nevertheless, I want to update you on the thing that has very likely caught your attention anyway – mining stocks’ strength relative to gold. Something very special has also just happened on the silver market, and I’d like to discuss that too.
In short, the GDX ETF moved higher yesterday, even though gold moved lower. This is a sign of strength of the former, which might be viewed as something bullish. But should it be viewed as such?
In my opinion – no. One swallow doesn’t make a summer, and a daily data outlier could be nothing more than that. Acting on gold’s daily, unconfirmed breakout, would have one buy gold at the end of the previous week. And as we’ll soon discuss, it wasn’t such a good idea after all.
1. What are Miners Up To?
So, why did miners rally?
Ultimately, it’s never possible to reply to the “why did a given market move” other than to say that “because buyers won over sellers”. It’s not particularly informative, though. The reason that seems most likely to me is that it was… a purely technical development that “needed” to happen for a formation to be complete.
This hypothesis would also explain the one odd thing that happened yesterday. Namely, while the GDX closed the day slightly higher, the GDXJ ended the day lower. This would make sense if the general stock market declined (junior mining stocks – GDXJ tend to follow its lead more than seniors – GDX) – but the point is that the general stock market ended yesterday’s session basically flat (declining by mere 0.09% decline).
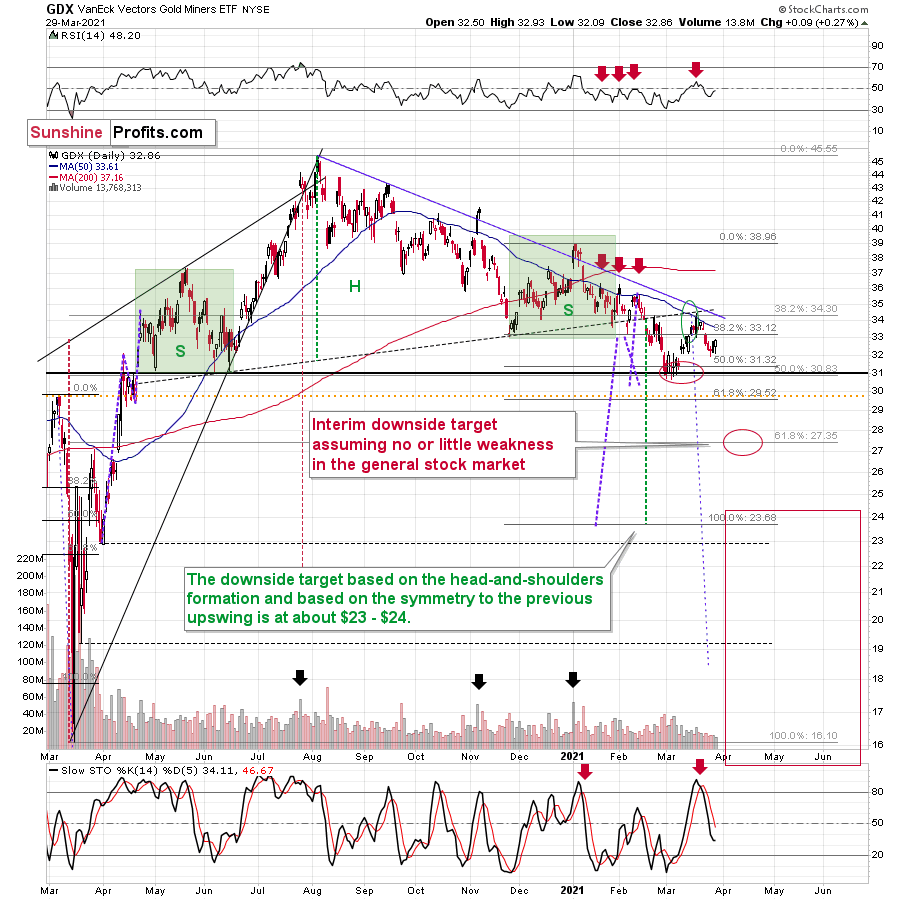
Ok, so what kind of formation are miners completing?
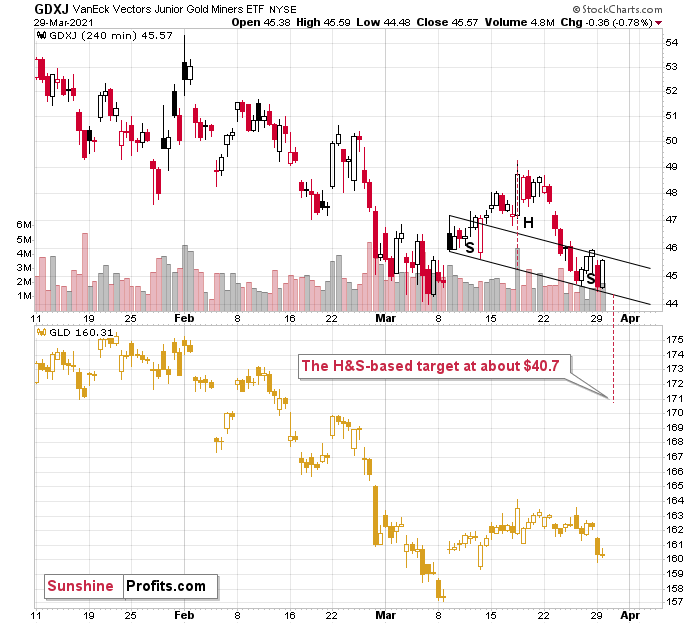
Quite likely the head and shoulders formations. The reason for yesterday’s underperformance of the GDXJ would be the fact that in case of this ETF’s head-and-shoulders formation, the neckline is descending much more visibly. These formations are more visible on the 4-hour charts – so, let’s zoom in.
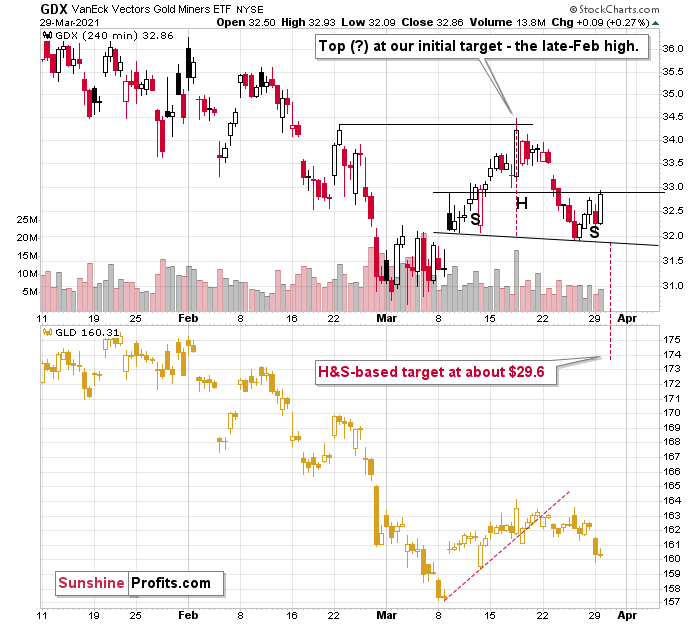
Currently – based on yesterday’s (Mar. 29) closing prices – the formations are not yet completed, so they should be viewed as “potential”. Still, given today’s (Mar. 30) pre-market decline in gold, it seems that they will be confirmed shortly, and the entire scenario outlined above will become reality (the recent decline will have turned out to be just the right shoulder of a bearish head-and-shoulders pattern).
The price targets based on those formations are $29.6 and $40.7 for GDX and GDXJ, respectively. However, let’s keep in mind that the H&S-based target should be viewed as “minimum” targets, not necessarily the final ones.
2. Gold is Invalidating its Breakout
Let’s take a look at gold.
In yesterday’s analysis, I wrote the following:
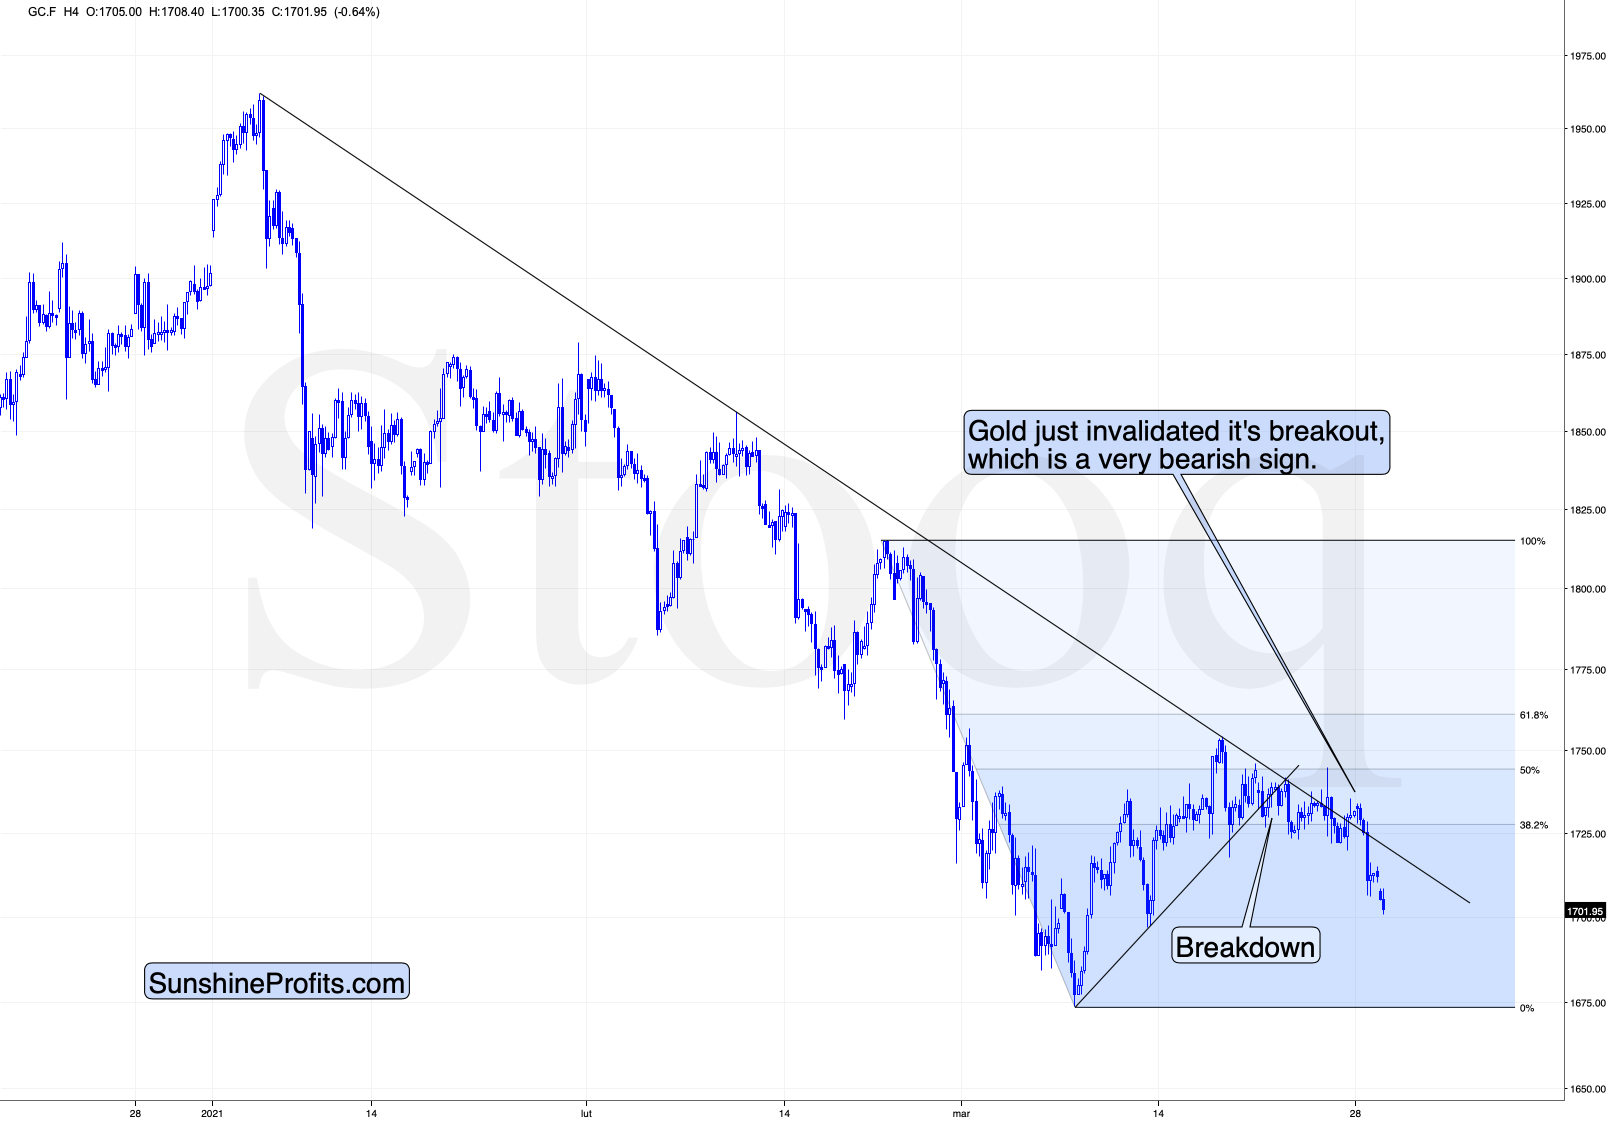
At the moment of writing these words, gold is trading once again very close to the previously broken line, ready to invalidate the breakout. If it does invalidate it (by moving below $1,725), then the bullish potential created by Friday’s rally will be gone.
Does the possibility (!) of seeing a temporary upswing imply that it’s a good idea to close our short positions? I don’t think so. In my view, the risk of missing the decline is too big and the situation in the USD Index is too bullish right now, to justify this action.
In short, gold just invalidated its small breakout above the declining resistance line. The previous breakout was small and thus it required a confirmation. It never got one, and instead gold plunged, invalidating the move. This is yet another sell sign.
It’s no wonder that gold is sliding. After all, gold tends to react more to breakouts and breakdowns in the USD Index than to its regular moves.
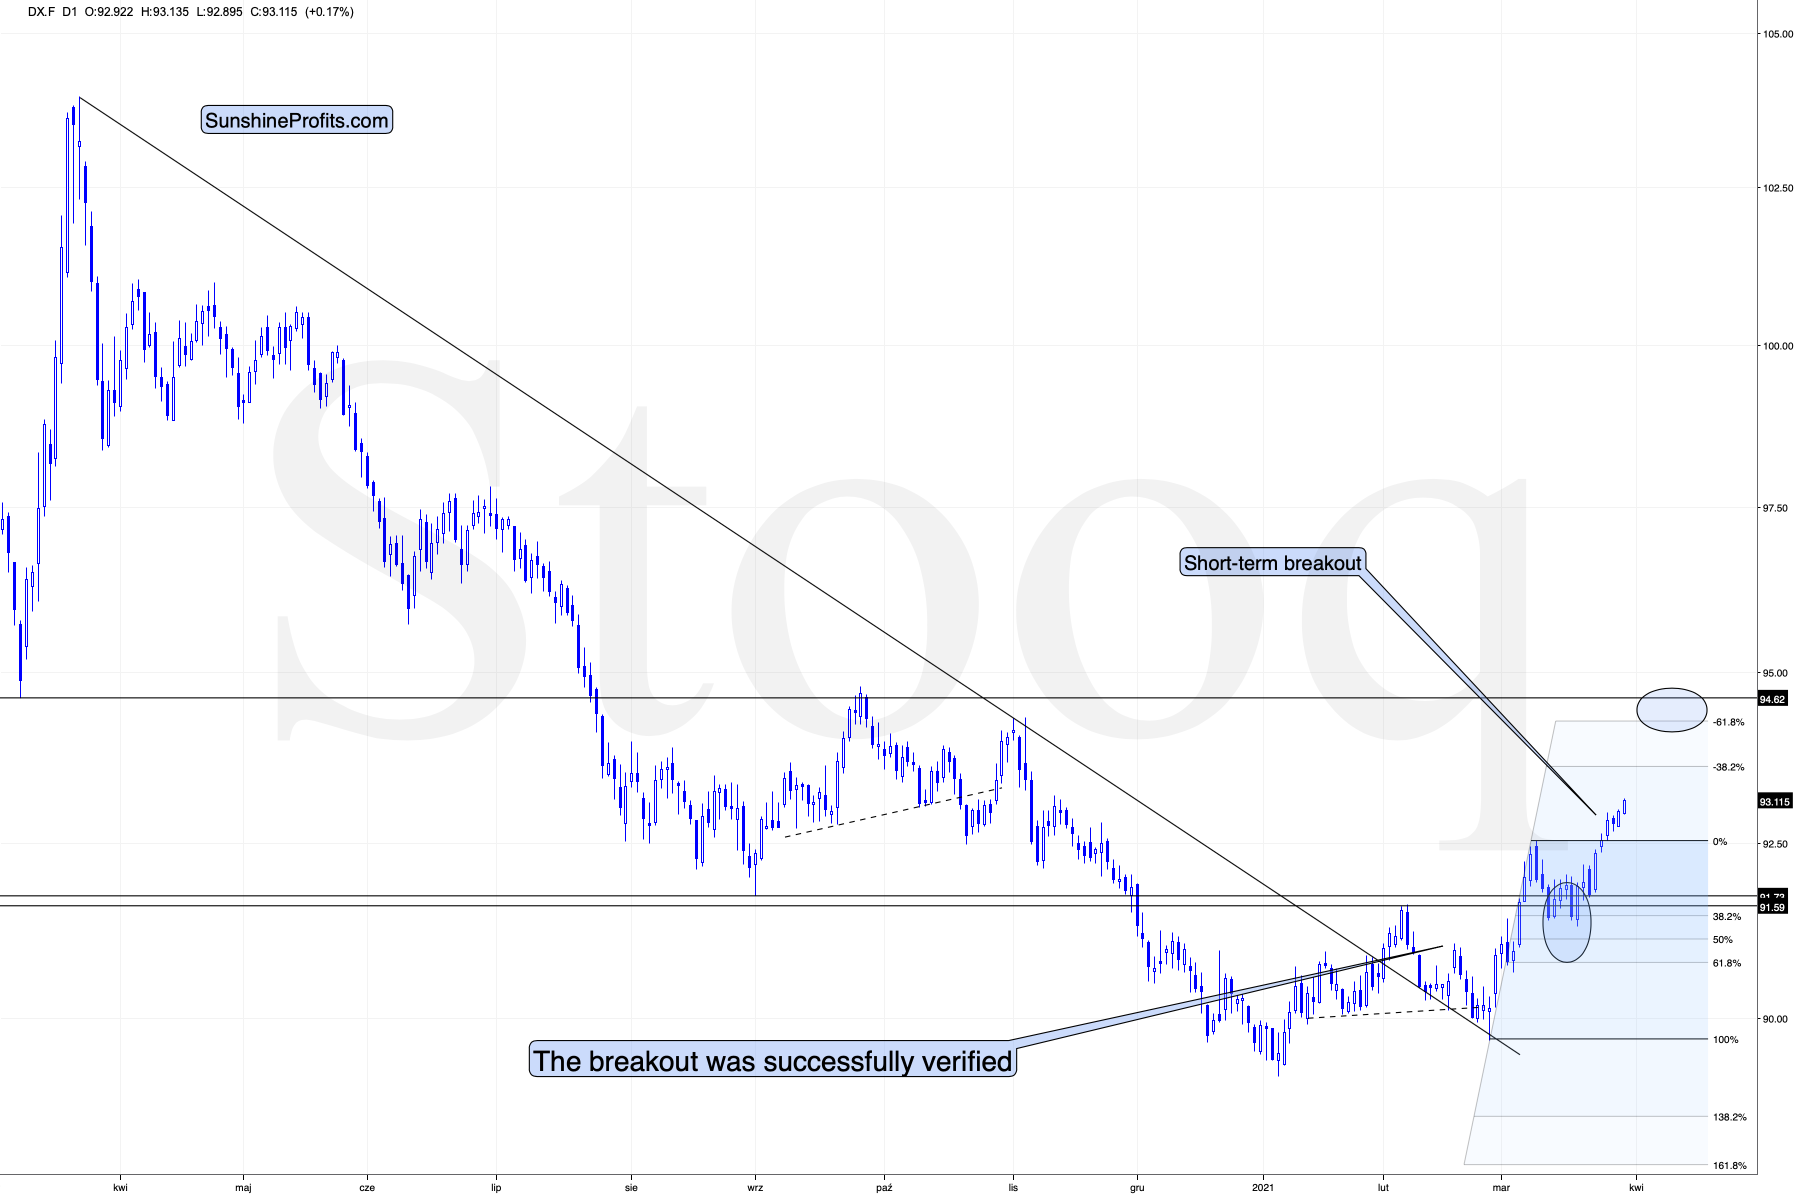
The thing is that the breakout to new yearly highs in the USD Index is now clearly visible. Yesterday’s close was the third consecutive daily close that we saw above the February high, which means that the breakout was confirmed. This a big deal from the short-term point of view, and it means that the road is now fully open for the U.S. currency index to soar to about 94.5 (before rallying even higher).
On Thursday (Mar. 25), I wrote the following:
(…) The breakout in the USD Index is not yet confirmed, but it seems quite likely that it will be confirmed shortly. I would not be surprised to see a weekly close near the previous yearly highs (the February highs) and then a powerful rally next week. This – if it happens in the above-mentioned way – would be likely to result in a major slide in the PMs next week.
The USD Index has indeed closed the week near the previous yearly highs (not right at them – apparently the USDX was too strong do decline right to them) and we see the beginning of a powerful rally this week. We also see the beginning of a major slide in the PMs this week. At the moment of writing these words, gold is already down by over $30 this week.
Ok, so what is so special about the silver market right now?
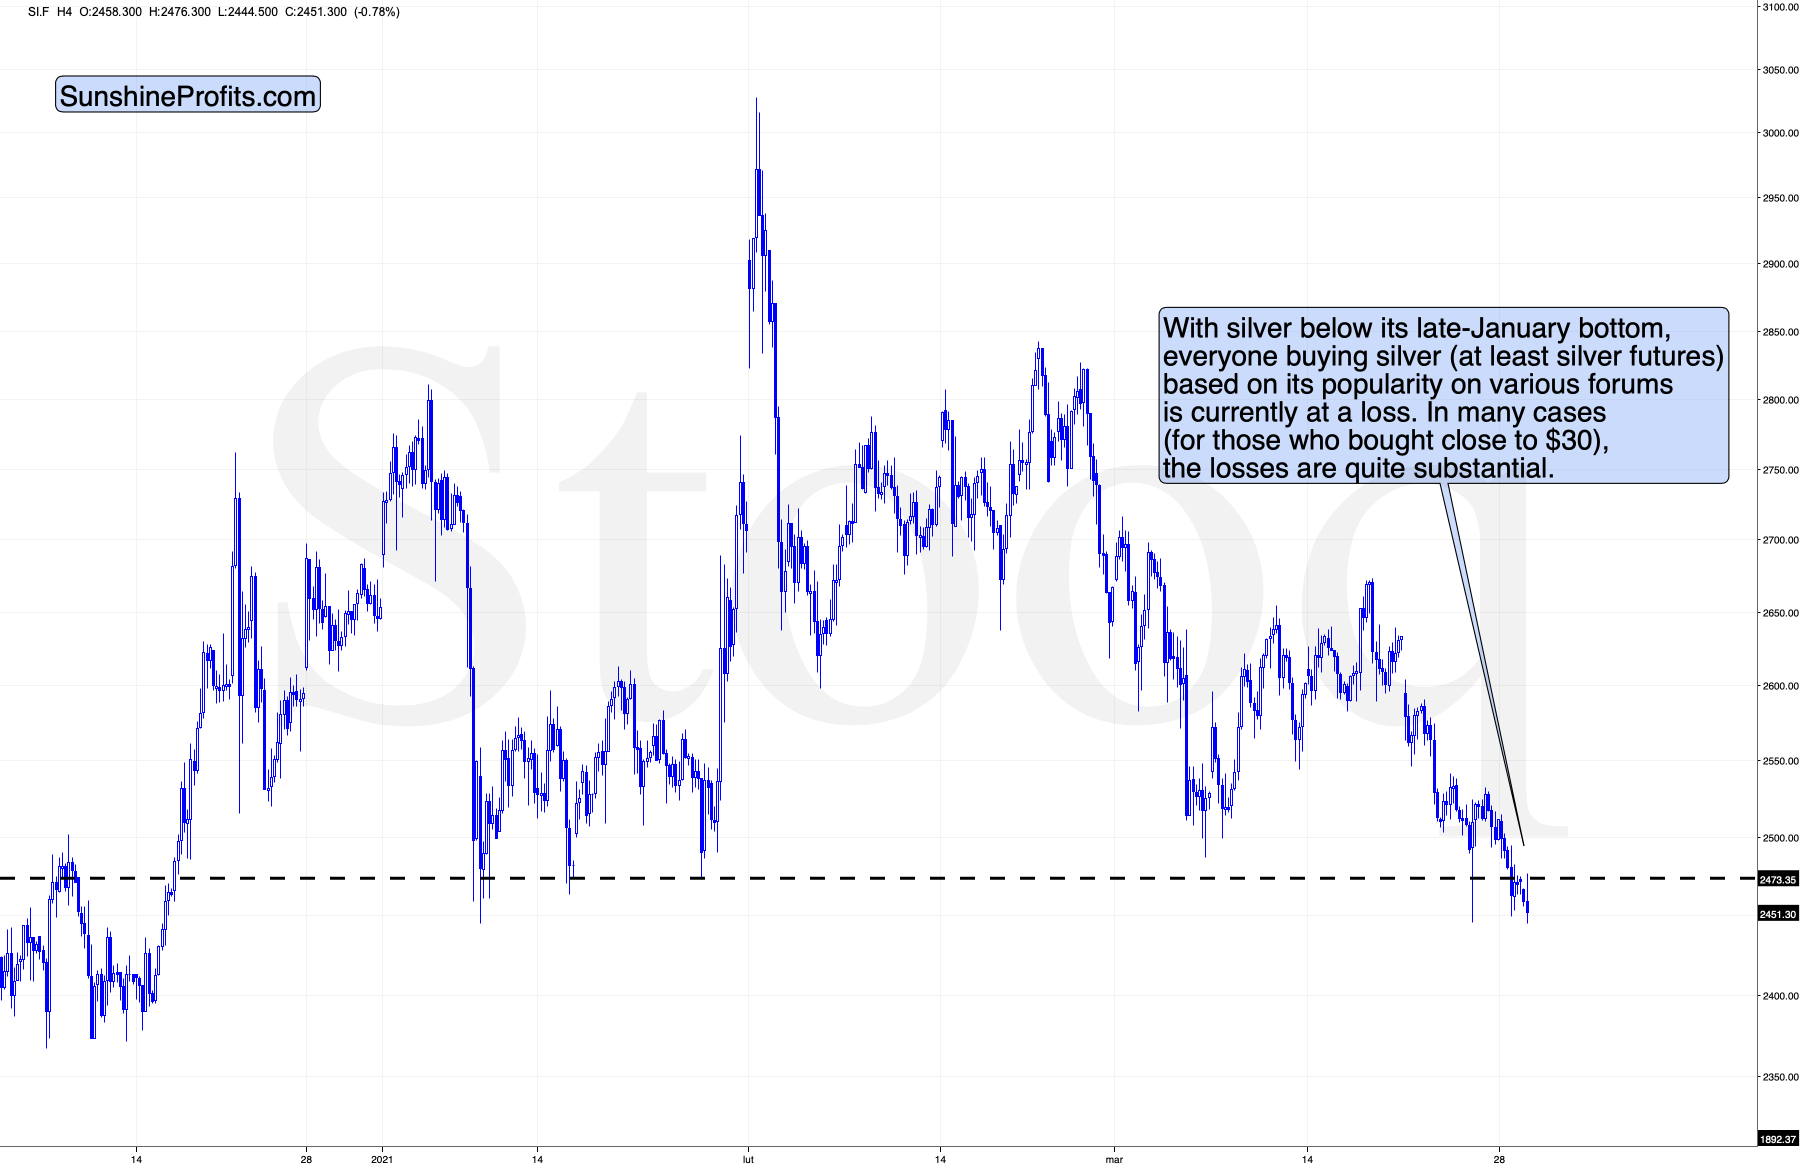
It’s the fact that at the moment of writing these words, silver is already below its late-Jan. lows. This means that everyone that bought around that time is already at a loss. Why would this be important? Because it means that everyone who jumped into the silver market with both feet based on just very brief research (“research”?) which in many cases was following instructions provided at various forums is in a losing position right now.
Sometimes the losses are small – for the very few, who were early, but in some cases, the losses are already quite visible – especially for those, who bought close to $30.
Why is this important? Because it emphasizes the need to verify the quality of the information that one chooses to act on, and because it’s a tipping point after which the previous buyers are likely to start becoming sellers, thus adding to decline’s sharpness.
The “new silver buyers” losses are not huge yet, but after another move lower, they will likely become such and the sales from those buyers would likely make these declines even bigger.
When everyone and their brother was particularly bullish on silver a few months ago, I wrote that they might be quite right, but the timing was terrible. So far, the losses for those, who bought silver earlier this year are not that big, but, in my opinion, they are likely to become much bigger in the following weeks.
Of course, I expect silver to soar in the following years (well over $100), but not without plunging first in the short and/or medium term.
Having said that, let’s take a look at the market from a more fundamental angle.
Hedge Fund Dies, Yields Rise, PMs Slide
Making Melvin Capital and GameStop look like amateur hour, Archegos Capital Management’s unhedged fun shook more than a few branches. To explain, the hedge fund levered up its equity portfolio, betting big on speculative stocks, while hedging its exposure by shorting the S&P 500. However, with ViacomCBS plunging and the S&P 500 rising, the correlation misstep led to a tsunami of margin calls, wiping out the fund and saddling one of its prime brokers (Nomura, the margin lender) with ~$2 billion in losses.
Please see below:
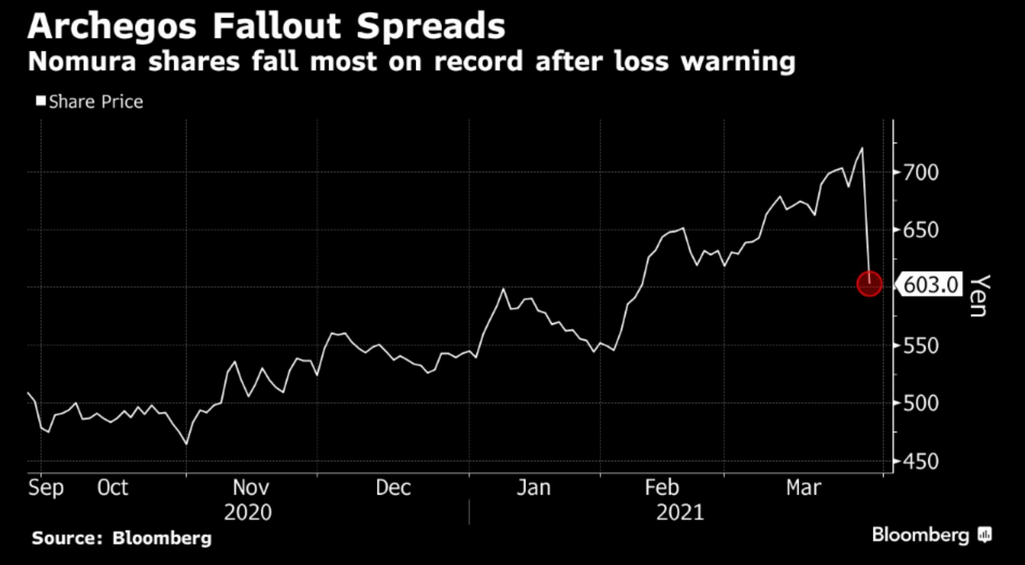
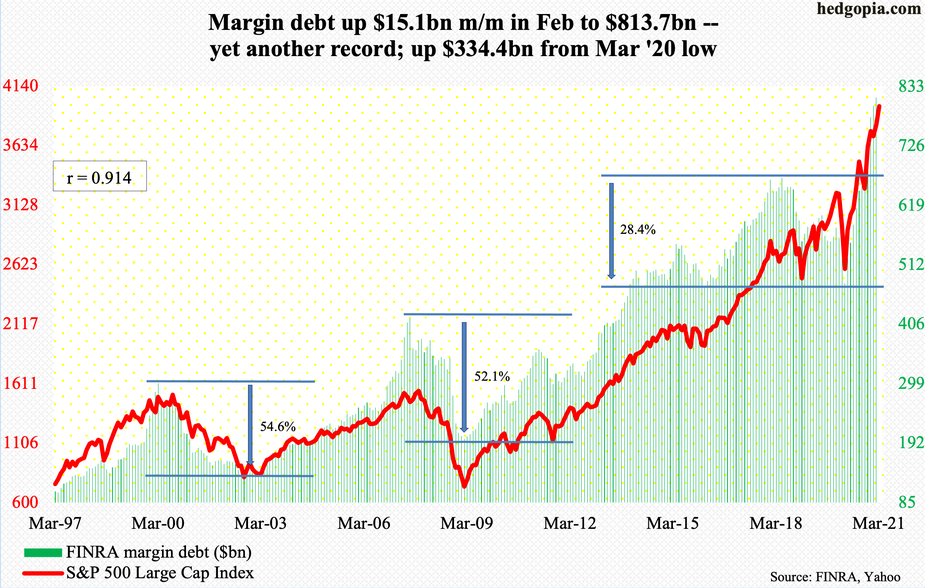
And while U.S. equity markets largely shrugged off the event on Mar. 29, the latest fiasco was another symptom of the U.S. Federal Reserve’s (FED) liquidity-induced sickness. Thus, with margin debt still at an all-time high, it’s only a matter of time before another explosion erupts.
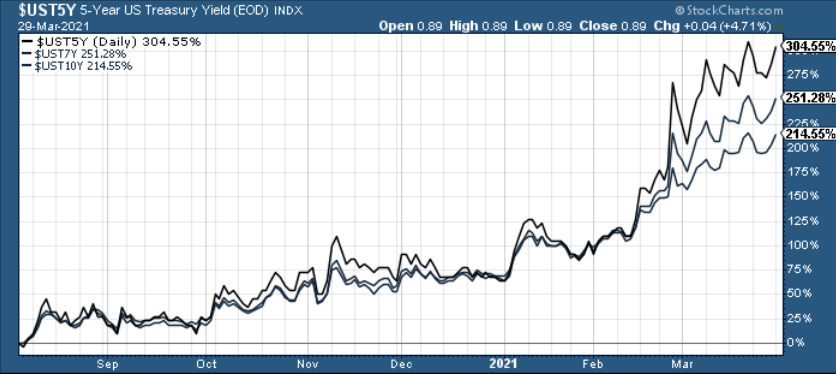
Moving on to more pressing issues, I’ve warned on several occasions that rising U.S. Treasury yields have the potential to sink the PMs. And continuing their surge on Mar. 29, the U.S. 5-Year, 7-Year and 10-Year Treasury yields remain on the fast track.
Please see below:
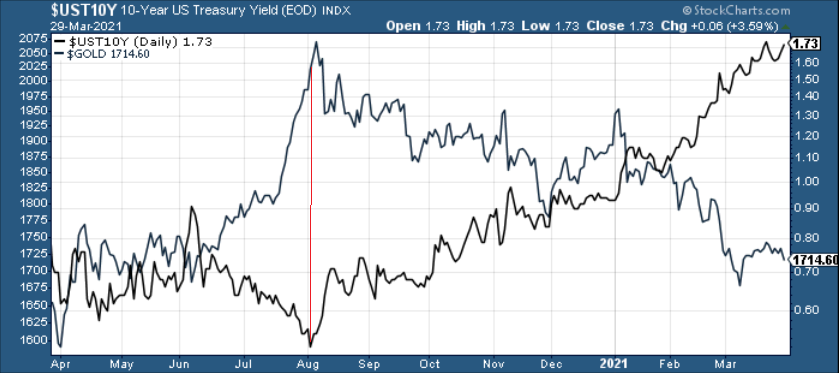
And suffering in silence, since early August, gold and the U.S. 10-Year Treasury yield have forged materially different paths.
But even more ominous for the yellow metal, the eight-month slide originally occurred without the influence of the USD Index. However, if you analyze the chart below, you can see that since the New Year, a reinvigorated greenback has begun to follow the U.S. 10-Year Treasury yield higher.
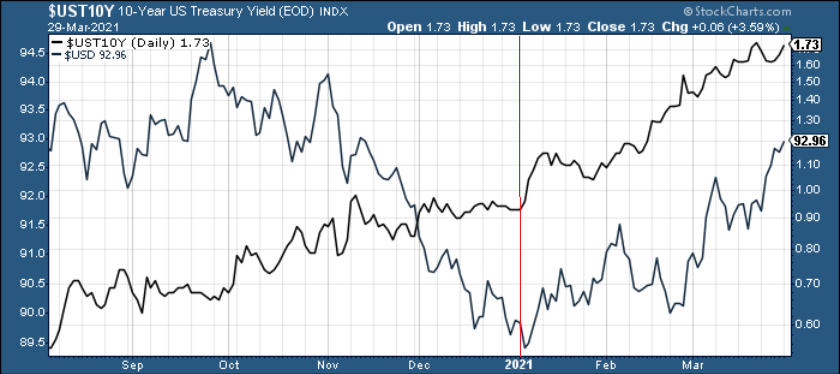
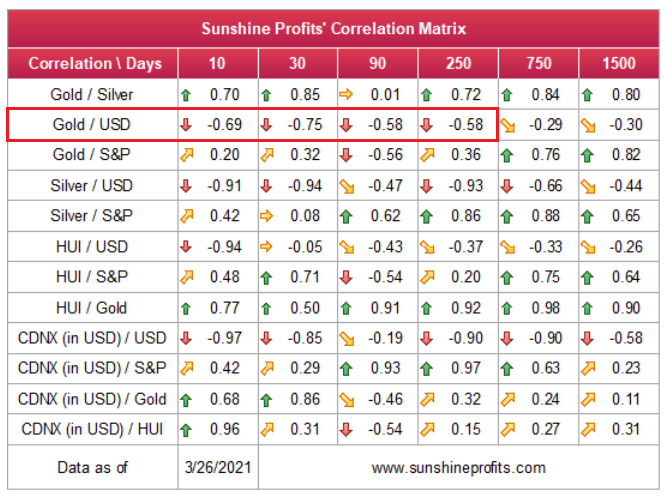
And because gold exhibits a strong negative correlation with the U.S. dollar, the deadly combination of higher U.S. Treasury yields and a stronger USD Index has the potential to suffocate the yellow metal.
Please see below:
In addition, the two-headed monster remains a catch-22 for gold. If the U.S. equity market suffers a severe correction, the safe-haven bid for U.S. Treasuries (which suppresses their yields) will likely be outweighed by a surge in the USD Index. Similarly, a continuation of ‘business as usual’ – where the U.S. 10-Year Treasury yield and the USD Index gradually move higher – will only result in a slow burn. Thus, for the time being, the yellow metal remains stuck between a rock and a hard place.
Furthermore, because the likelihood for the first scenario (stocks’ plunge) to materialize remains unclear in the short term (though excessive leverage will very likely pop equities’ bubble over the medium term), it’s prudent to focus our attention on the second.
On Jan. 15, I warned that the FED’s policies were analogous to putting out a fire by pouring on more gasoline. Despite Jerome Powell’s (Chairmen of the FED) obsession with controlling the U.S. yield curve, it was clear then, and it’s clear now, that the FED has lost control of the bond market.
I wrote:
- If they let yields rise, the cost of borrowing rises, the cost of equity rises and the U.S. dollar is supported (all leading to shifts in the bond and stock markets and destroying the halcyon environment they worked so hard to create).
- To stop yields from rising, the U.S. Federal Reserve (FED) has to increase its asset purchases (and buy more bonds in the open market). However, the added liquidity should have the same net-effect because it increases inflation expectations, which a precursor to higher interest rates.
And while the two-and-a-half month dance continues to unfold, it’s clear that the PMs aren’t enjoying the music. However, with no end in sight, the ‘same old, same old,’ remains profoundly bearish for the PMs.
Case in point: not long ago, market participants believed that the FED wouldn’t raise interest rates until 2024 (the gray line below) However, with rising inflation likely to force the central banks’ hand, investors are now bracing for several rate hikes in 2022 and 2023 (the blue line below).
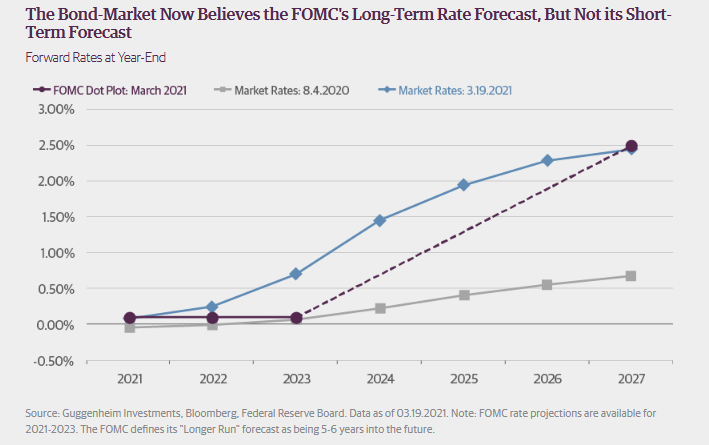
But didn’t Powell insist that near-term inflation was only “one-time” and “transient”?
Well, despite government-issued CPI data failing to capture the effect of the FED’s liquidity circus, pricing pressures are popping up everywhere.
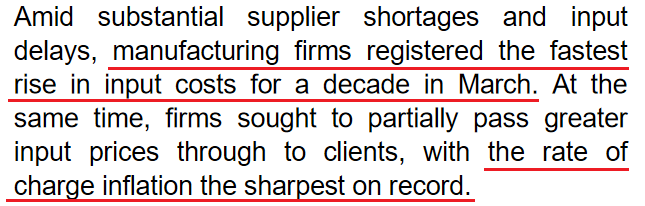
On Mar. 25, I wrote that IHS Markit’s Flash U.S. Composite PMI (released on Mar. 24) revealed that the rate of manufacturing input inflation was at an all-time high.
Please see below:
 Source: IHS Markit
Moving in lockstep, service sector inflation has also surged to its highest level on record.
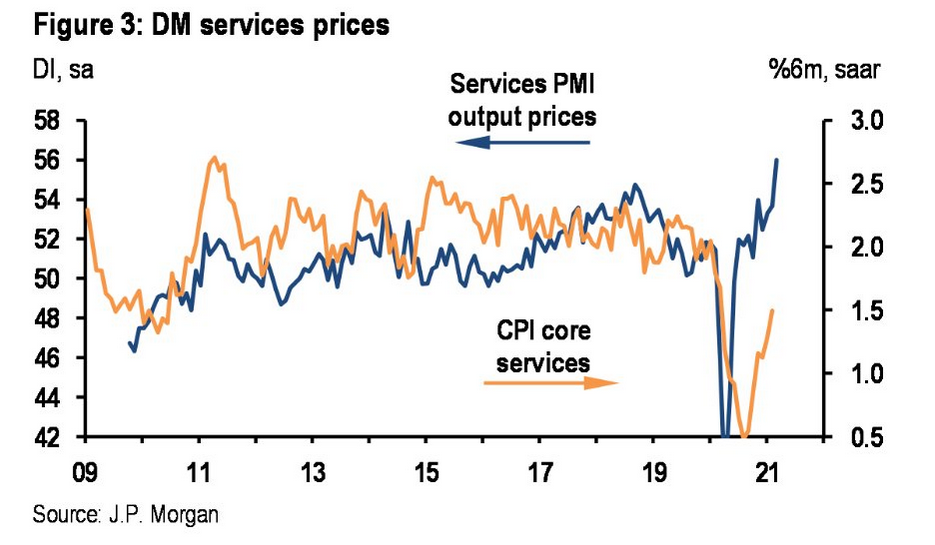
To explain, the blue line above measures price inflation in the service sector (think consulting, housekeeping, dentistry, hospitality, automotive repairs etc.), while the orange line measures service sector CPI (data released by the government). As you can see, the monumental gap has investors sensing that service sector CPI isn’t telling the whole story.
As further evidence, on Mar. 29, the Dallas FED’s Texas Manufacturing Outlook Survey surged by 28 points to its highest level ever.
Please see below:
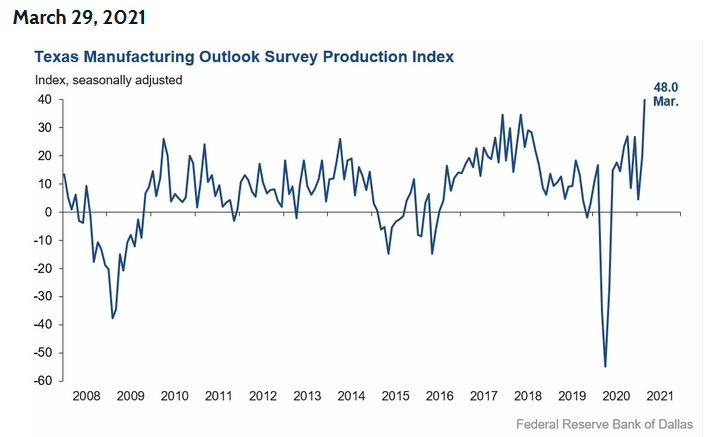
More importantly though, notice a recurring theme?
 Source: Dallas FED
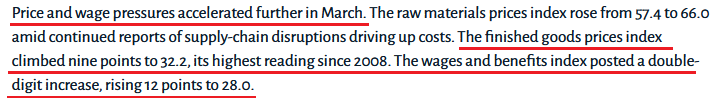
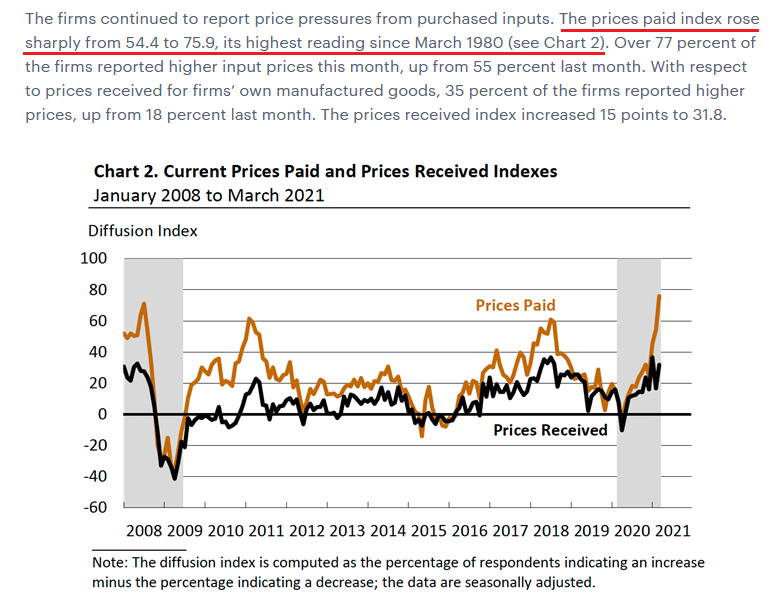
In similar fashion, the Philadelphia FED’s March 2021 Manufacturing Business Outlook Survey (released on Mar. 18) revealed that its prices paid index rose to its highest level in more than 40 years.
Please see below:
 Source: Philadelphia FED
Just as important, notice how prices received tend to follow prices paid? Think about it: with corporations’ decision tree left to raising prices or accepting lower margins, which one do you think they’re likely to choose?
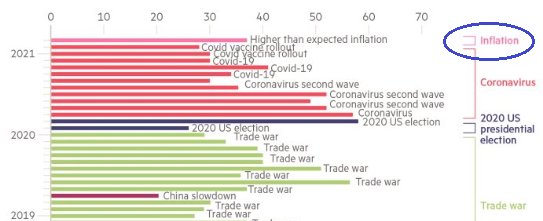
If that wasn’t enough, Bank of America’s latest survey revealed that “higher than expected inflation” has become investors’ highest perceived risk. As a result, market participants are finally starting to see the forest through the trees.
 Source: Bank of America
In conclusion, while rising inflation is extremely bullish for the PMs over the long term, the medium-term combination of higher U.S. Treasury yields and a stronger USD Index remains profoundly bearish. On several occasions, I’ve noted that rising inflation expectations are a precursor to higher interest rates. And absent an equity rout, with the above data continuing to support the former, we’re unlikely to see a slowdown in the latter. As a result, the PMs remain outmanned, outgunned and retreat is likely their only course of action. However, in time, the dynamic will reverse, and the precious metals will be one of the top-performing assets classes once again.
Overview of the Upcoming Part of the Decline
- It seems quite likely to me that we are already after the initial bottom and the initial correction. If not, then it seems likely to me that the corrective upswing will be completed within the next 2 weeks (with PMs topping in early April). It’s more likely that the next big move lower is already underway, though.
- After miners slide once again in a meaningful and volatile way, but silver doesn’t (and it just declines moderately), I plan to switch from short positions in miners to short positions in silver (this could take another 1-2 weeks to materialize). I plan to exit those short positions when gold shows substantial strength relative to the USD Index, while the latter is still rallying. This might take place with gold close to $1,450 - $1,500 and the entire decline (from above $1,700 to about $1,475) would be likely to take place within 1-12 weeks and I would expect silver to fall hardest in the final part of the move. This moment (when gold performs very strongly against the rallying USD and miners are strong relative to gold – after gold has already declined substantially) is likely to be the best entry point for long-term investments in my view. This might happen with gold close to $1,475, but it’s too early to say with certainty at this time. In other words, the entire decline could take between 1 and 12 weeks, while silver declines occuring particularly fast in the final 1-2 weeks.
- If gold declines even below $1,500 (say, to ~$1350 or so), then it could take another 10 weeks or so for it to bottom, but this is not what I view as a very likely outcome.
- As a confirmation for the above, I will use the (upcoming or perhaps we have already seen it?) top in the general stock market as the starting point for the three-month countdown. The reason is that after the 1929 top, gold miners declined for about three months after the general stock market started to slide. We also saw some confirmations of this theory based on the analogy to 2008. All in all, the precious metals sector would be likely to bottom about three months after the general stock market tops . If the mid-February 2020 top was the final medium-term top (based on NASDAQ’s top, then it seems that we might expect the precious metals sector to bottom in mid-May or close to May’s end. If, however, the mid-March 2021 top was the final medium-term top (based on the S&P 500), then we might expect the precious metals sector to bottom in mid-June or close to June’s end.
- The above is based on the information available today and it might change in the following days/weeks.
Summary
To summarize, the PMs’ medium-term decline is well underway, and based on the recent performance of the USD Index, gold and mining stocks, it seems that the corrective upswing is already over (or about to be over). The next big move lower seems to be already underway or about to start.
In addition, because we’re likely entering the “winter” part of the Kondratiev cycle (just like in 1929 and then the 1930s), the outlook for the precious metals’ sector remains particularly bearishduring the very first part of the cycle, when cash is king.
The confirmed breakout in the USD Index is yet another confirmation of the bearish outlook for the precious metals market.
After the sell-off (that takes gold to about $1,450 - $1,500), we expect the precious metals to rally significantly. The final part of the decline might take as little as 1-5 weeks, so it's important to stay alert to any changes.
Most importantly, please stay healthy and safe. We made a lot of money last March and it seems that we’re about to make much more on this March decline, but you have to be healthy to enjoy the results.
As always, we'll keep you - our subscribers - informed.
By the way, we’re currently providing you with a possibility to extend your subscription by a year, two years or even three years with a special 20% discount. This discount can be applied right away, without the need to wait for your next renewal – if you choose to secure your premium access and complete the payment upfront. The boring time in the PMs is definitely over and the time to pay close attention to the market is here. Naturally, it’s your capital, and the choice is up to you, but it seems that it might be a good idea to secure more premium access now, while saving 20% at the same time. Our support team will be happy to assist you in the above-described upgrade at preferential terms – if you’d like to proceed, please contact us.
To summarize:
Trading capital (supplementary part of the portfolio; our opinion): Full speculative short positions (300% of the full position) in mining stocks are justified from the risk to reward point of view with the following binding exit profit-take price levels:
Mining stocks (price levels for the GDXJ ETF): binding profit-take exit price: $24.12; stop-loss: none (the volatility is too big to justify a stop-loss order in case of this particular trade)
Alternatively, if one seeks leverage, we’re providing the binding profit-take levels for the JDST (2x leveraged) and GDXD (3x leveraged – which is not suggested for most traders/investors due to the significant leverage). The binding profit-take level for the JDST: $39.87; stop-loss for the JDST: none (the volatility is too big to justify a SL order in case of this particular trade); binding profit-take level for the GDXD: $94.87; stop-loss for the GDXD: none (the volatility is too big to justify a SL order in case of this particular trade).
For-your-information targets (our opinion; we continue to think that mining stocks are the preferred way of taking advantage of the upcoming price move, but if for whatever reason one wants / has to use silver or gold for this trade, we are providing the details anyway.):
Silver futures upside profit-take exit price: unclear at this time - initially, it might be a good idea to exit, when gold moves to $1,512.
Gold futures upside profit-take exit price: $1,512.
Long-term capital (core part of the portfolio; our opinion): No positions (in other words: cash
Insurance capital (core part of the portfolio; our opinion): Full position
Whether you already subscribed or not, we encourage you to find out how to make the most of our alerts and read our replies to the most common alert-and-gold-trading-related-questions.
Please note that we describe the situation for the day that the alert is posted in the trading section. In other words, if we are writing about a speculative position, it means that it is up-to-date on the day it was posted. We are also featuring the initial target prices to decide whether keeping a position on a given day is in tune with your approach (some moves are too small for medium-term traders, and some might appear too big for day-traders).
Additionally, you might want to read why our stop-loss orders are usually relatively far from the current price.
Please note that a full position doesn't mean using all of the capital for a given trade. You will find details on our thoughts on gold portfolio structuring in the Key Insights section on our website.
As a reminder - "initial target price" means exactly that - an "initial" one. It's not a price level at which we suggest closing positions. If this becomes the case (like it did in the previous trade), we will refer to these levels as levels of exit orders (exactly as we've done previously). Stop-loss levels, however, are naturally not "initial", but something that, in our opinion, might be entered as an order.
Since it is impossible to synchronize target prices and stop-loss levels for all the ETFs and ETNs with the main markets that we provide these levels for (gold, silver and mining stocks - the GDX ETF), the stop-loss levels and target prices for other ETNs and ETF (among other: UGL, GLL, AGQ, ZSL, NUGT, DUST, JNUG, JDST) are provided as supplementary, and not as "final". This means that if a stop-loss or a target level is reached for any of the "additional instruments" (GLL for instance), but not for the "main instrument" (gold in this case), we will view positions in both gold and GLL as still open and the stop-loss for GLL would have to be moved lower. On the other hand, if gold moves to a stop-loss level but GLL doesn't, then we will view both positions (in gold and GLL) as closed. In other words, since it's not possible to be 100% certain that each related instrument moves to a given level when the underlying instrument does, we can't provide levels that would be binding. The levels that we do provide are our best estimate of the levels that will correspond to the levels in the underlying assets, but it will be the underlying assets that one will need to focus on regarding the signs pointing to closing a given position or keeping it open. We might adjust the levels in the "additional instruments" without adjusting the levels in the "main instruments", which will simply mean that we have improved our estimation of these levels, not that we changed our outlook on the markets. We are already working on a tool that would update these levels daily for the most popular ETFs, ETNs and individual mining stocks.
Our preferred ways to invest in and to trade gold along with the reasoning can be found in the how to buy gold section. Furthermore, our preferred ETFs and ETNs can be found in our Gold & Silver ETF Ranking.
As a reminder, Gold & Silver Trading Alerts are posted before or on each trading day (we usually post them before the opening bell, but we don't promise doing that each day). If there's anything urgent, we will send you an additional small alert before posting the main one.
Thank you.
Przemyslaw Radomski, CFAFounder, Editor-in-chief

