

Briefly: in our opinion, full (300% of the regular position size) speculative short positions in junior mining stocks are justified from the risk/reward point of view at the moment of publishing this Alert.
Today is the day when the Fed decides and speaks. It’s also the day when the markets are likely to react. Since some market participants will presumably be surprised by whatever is said and done, reactions might be volatile.
However, the markets appear to be already indicating where they want to move. In particular, the USD Index. Let’s start by quoting what I wrote about USD’s 4-hour chart yesterday:
In short, the USD Index has been consolidating in one of the most classic ways possible. Namely, it formed a triangle. Triangles are generally “continuation patterns,” which suggests that the USDX is likely to break to the upside and rally.
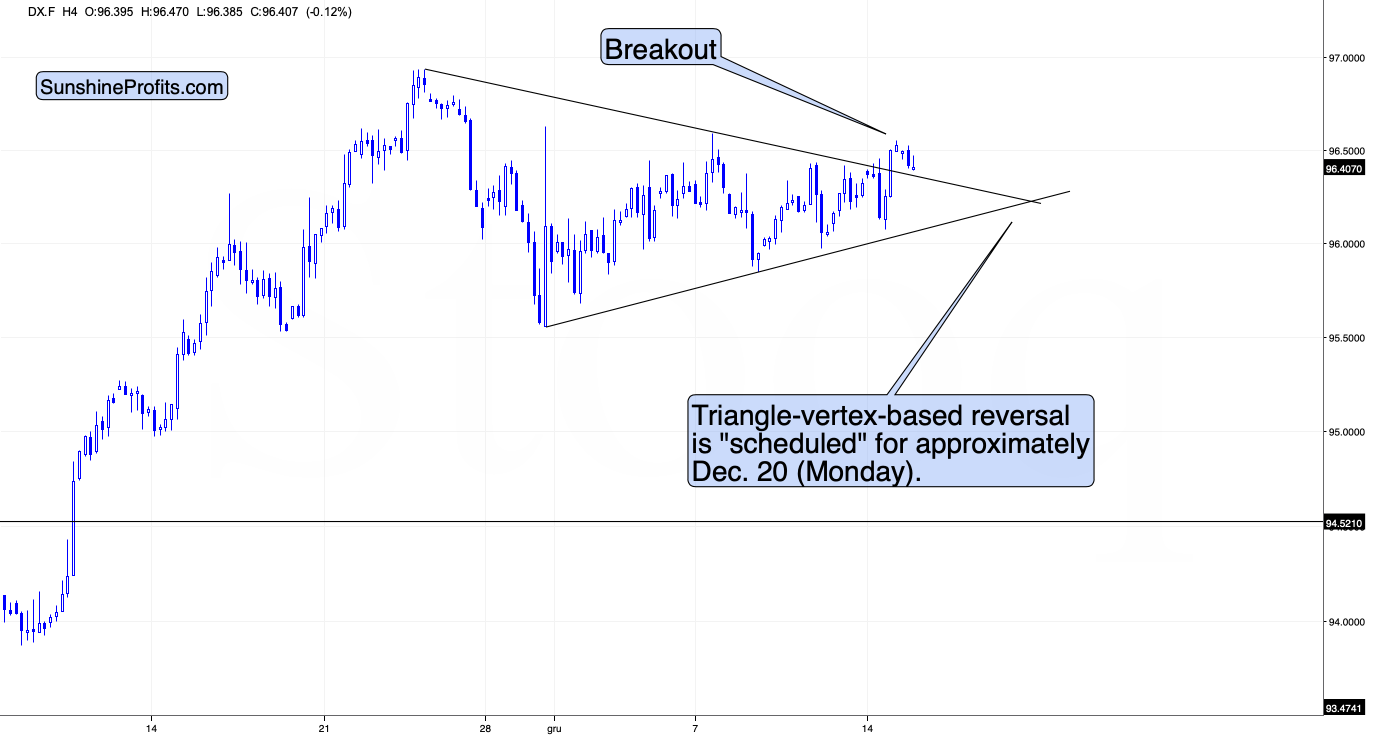
Taking a closer look at the triangle, we see that earlier today, the USD Index tried to move above it, but so far it was not successful. The move higher was really small, so I don’t view it as a major invalidation.
Still, I wouldn’t be surprised to see the USD Index continue its back-and-forth trading within the triangle until we get some news from the Fed. In other words, we’re likely to see some major price action tomorrow.
The above, plus the fact that gold has been consolidating below its rising support line, suggests that the next move in the USDX is going to be to the upside, while gold is going to decline.
Still, let’s keep in mind that it’s also possible that we see a fake move lower (USDX) and higher in gold right before or right after the FOMC. That kind of volatility around important news announcements is relatively normal. Whatever happens initially, please don’t take it at its face value. It might or might not be the market’s true reaction, especially if silver rallies much more than gold.
The trends support higher USDX values in the near and medium-term, and lower gold prices in the near and medium-term.
After I wrote the above, the USD Index moved lower, but then, at its next attempt, it managed to rally above the upper border of the triangle, and it’s now verifying the breakout. In short, this is bullish, and the short-term outlook for the USD Index improved based on that.
Again, we might see huge volatility in either direction today, but based on what we saw, the short-term outlook for the USDX is more bullish. It’s also more bearish for the precious metals sector.
In other news, based on yesterday’s price moves, the GDX ETF and the GDXJ ETF both closed at new monthly lows.
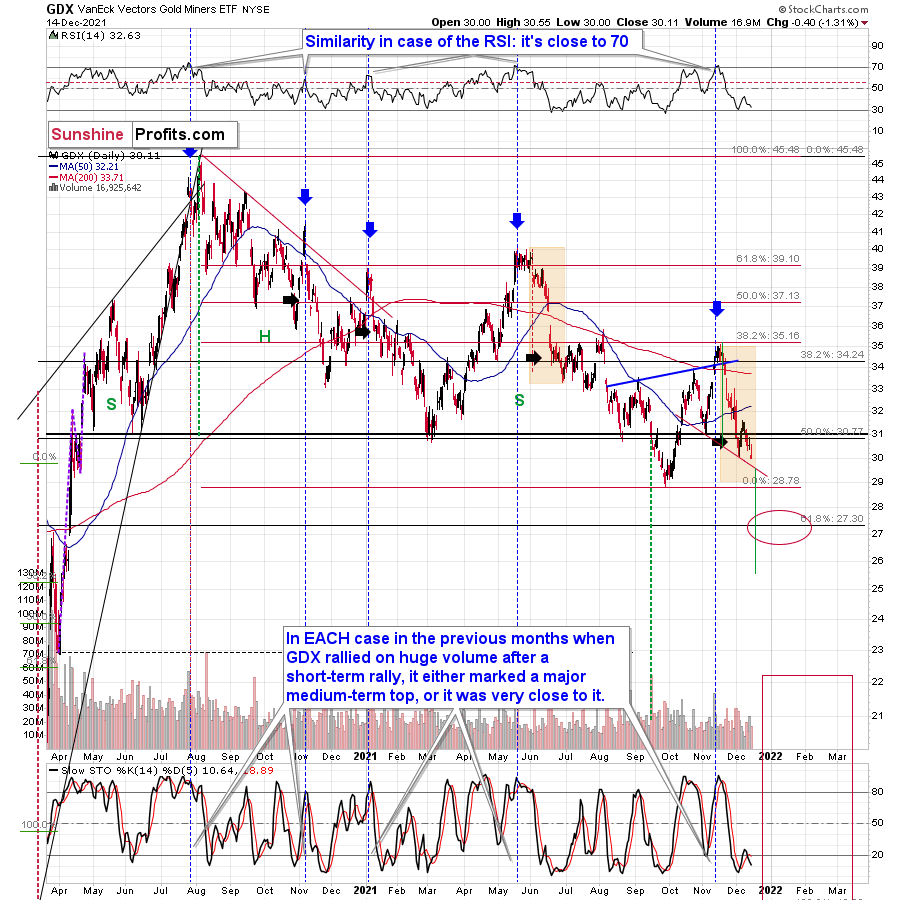
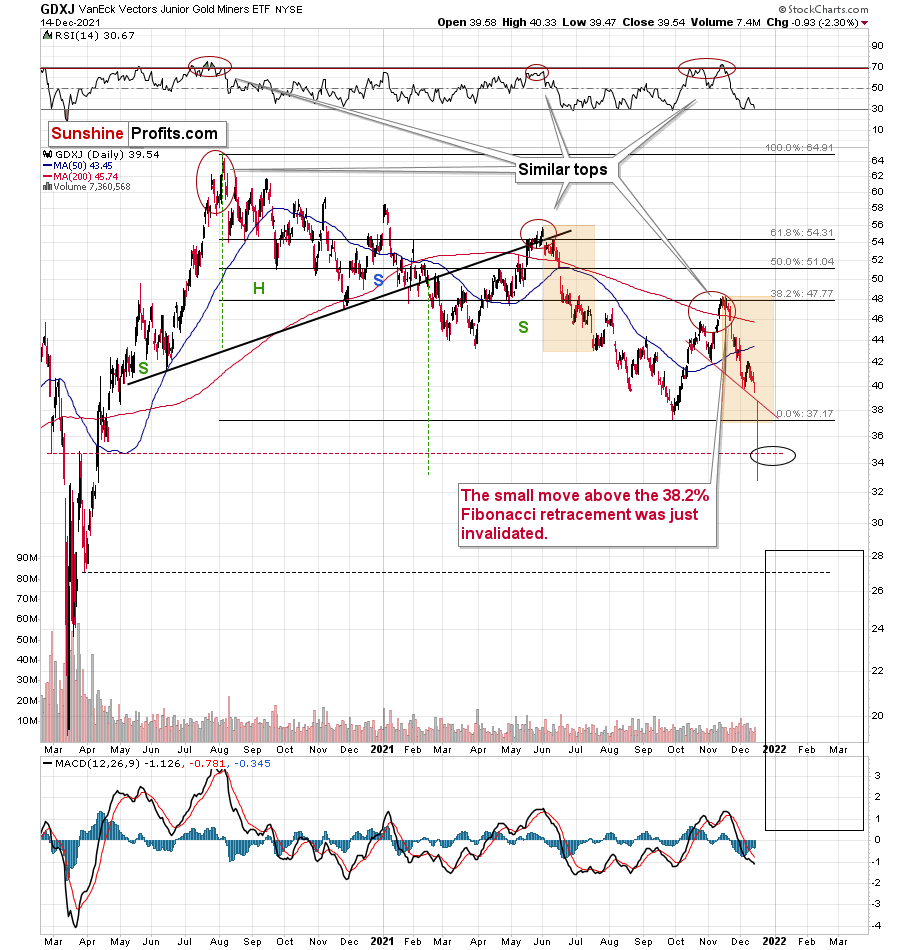
After they decline some more, they will break below their head and shoulders patterns (I marked the neck levels with red, solid lines). Those patterns will open doors to declines even below my previous interim bottoming targets. The implications, of course, are bearish.
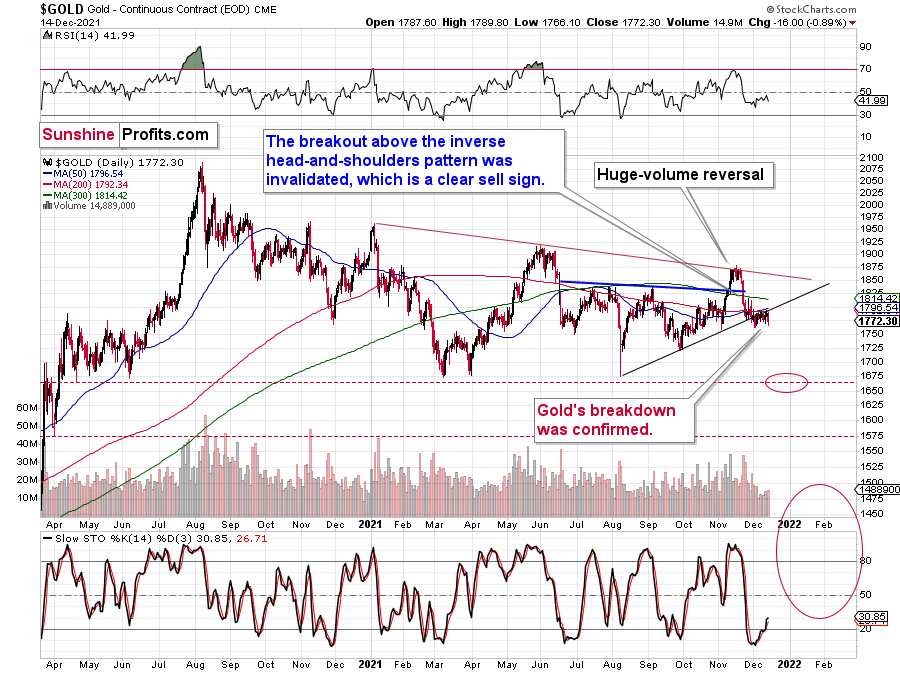
Gold didn’t decline below its previous December lows, but it’s now crystal-clear that the breakdown below its rising support line has been more than confirmed. Consequently, the next move is likely to be to the downside, even though we might (!) see a very quick rally after the news hits the markets later today.
Having said that, let’s take a look at the markets from a more fundamental point of view.
The Wait Is Over
With the FOMC releasing its monetary policy statement and its Summary of Economic Projections in the coming hours, the financial markets remained in front-run mode on Dec. 14. With inflation still accelerating and the Fed further behind the curve than it was previously, hawkish rhetoric should turn into hawkish policy later today.
To explain, the Commodity Producer Price Index (PPI) increased by 1.4% month-over-month (MoM) and by 22.8% year-over-year (YoY) on Dec. 14. With the latter, at a new 2021 high, the cost-push inflationary spiral is still with us.
To explain the implications, I wrote on Jun. 15:
The commodity PPI often leads the headline CPI and that’s why tracking its movement is so important. If we analyze the performance of the pair during the inflationary surges of the 1970s and the early 1980s, it’s clear that the relationship has stood the test of time.
Please see below:
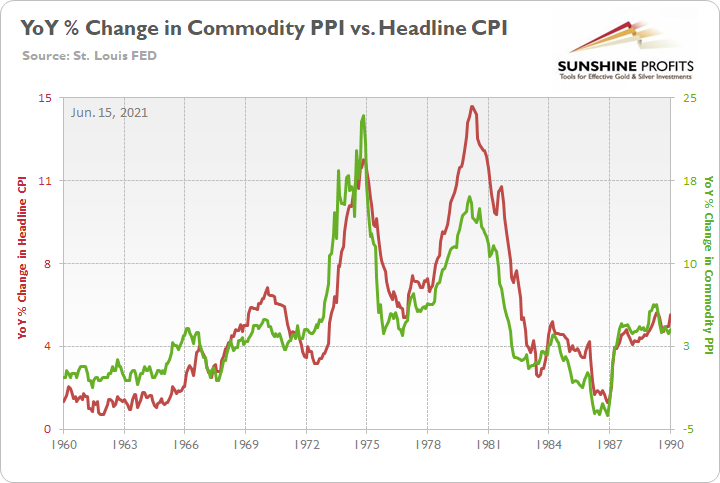
To explain, the green line above tracks the year-over-year (YoY) percentage change in the commodity PPI, while the red line above tracks the YoY percentage change in the headline CPI. If you analyze the relationship, you can see that the pair have a close connection.
More importantly, though, during the historical inflationary downpour, the month-over-month (MoM) percentage change in the commodity PPI never declined by more than 1.68%.
Please see below:
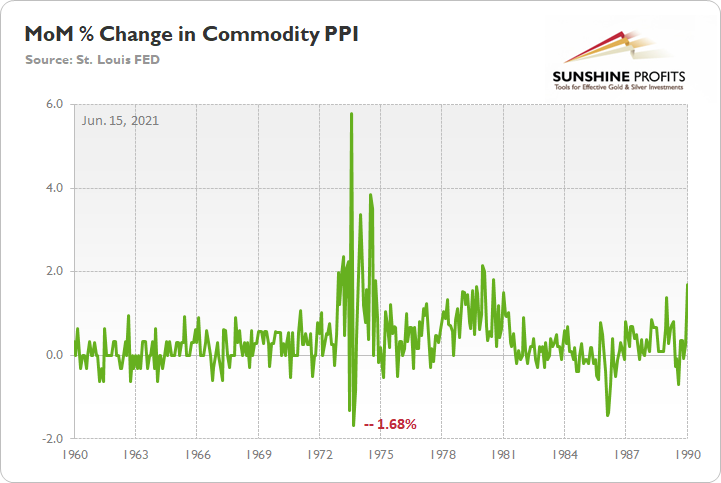
To explain, the green line above tracks the MoM percentage change in the commodity PPI. And if you compare the two MoM spikes in the commodity PPI to the two YoY spikes in the first chart above (focus your attention on the highs between 1972-1975 and 1978-1981), you can see that MoM resiliency helped sustain the YoY surges. In addition, during the roughly nine-year bout of inflation, the commodity PPI dipped in-and-out of negative territory but never fell off of a cliff.
Furthermore, as we look ahead to the release of the December Consumer Price Index (CPI), the commodity PPI implies a roughly 6.5% rise in the headline CPI when the data hits the wire on Jan. 12.
Please see below:
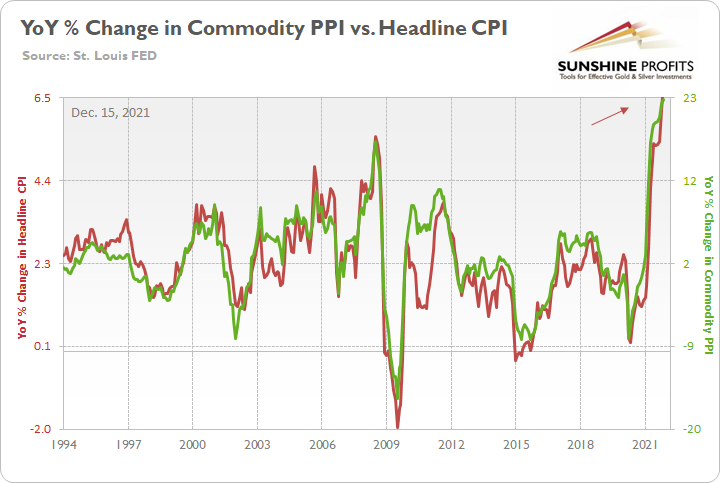
More importantly, though, with the commodity PPI still rising MoM, the Fed has a serious problem on its hands. To explain, the headline CPI slightly underperformed the value implied by the commodity PPI for much of 2021. However, in October and now November, the headline CPI has slightly outperformed the value implied by the commodity PPI. And while 50 basis points (0.50%) in either direction may seem immaterial, remember that the Fed’s annual inflation target is 2%. As a result, 50 basis points of outperformance amount to 25% of the Fed’s annual expected value.
Please see below:
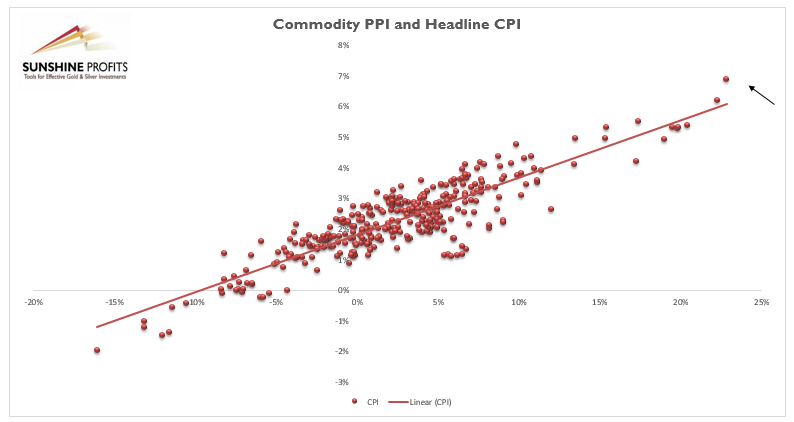
To explain, the scatterplot above depicts the relationship between the headline CPI and the commodity PPI (since 1994). For context, the headline CPI is plotted on the vertical axis, while the commodity PPI is plotted on the horizontal axis. If you analyze their movement, you can see that the pair have a strong linear relationship.
To that point, if you focus on the red dot on the right that’s highlighted by the black arrow, you can see that the headline CPI is now rising at a faster pace than the commodity PPI. For context, if the relationship remained on-trend, the headline CPI would have increased by ~6.1% YoY in November. However, after acceleration by the latter, output inflation is now outperforming input inflation.
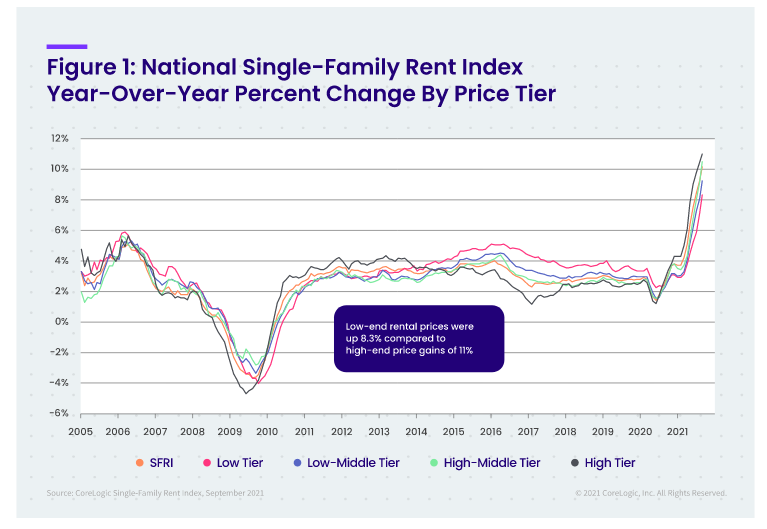
What’s more, rent inflation still hasn’t fully filtered into the Shelter CPI. For months, real-time rents rose rapidly while the Shelter CPI remained anchored. However, with the latter increasing by 3.9% YoY in November (a new 2021 high), the metric is only slightly above its pre-COVID highs. Conversely, with data compiled by private companies showing that rent inflation is well above its pre-COIVD highs, the Shelter CPI likely has more room to run.
For context, CoreLogic revealed on Nov. 16 that “rent growth across all [price] tiers remains at record highs.” As a result, if the Fed doesn’t drop the guillotine on QE later today, the headline CPI could continue to run away from the commodity PPI.
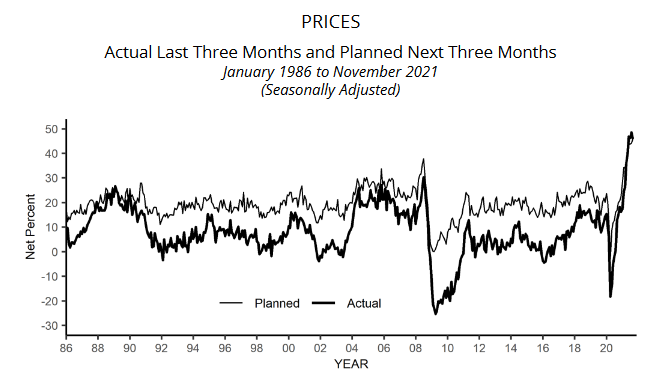
To that point, the NFIB released its Small Business Optimism Index on Dec. 14. While the headline index increased from 98.2 in October to 98.4 in November, “rampant inflation” remains problematic. The report revealed:
“The net percent of owners raising selling prices increased six points to a net 59% (seasonally adjusted), the highest reading since October 1979. Seasonally adjusted, a net 54% of owners plan price hikes, up three points from October and a 48-year record high reading.”
Please see below:
 Source: NFIB
Likewise, wage inflation also remains abundant:
“A net 44% (seasonally adjusted) of owners reported raising compensation, unchanged from October and a 48-year record high reading. A net 32% plan to raise compensation in the next three months, also unchanged from October and a record high reading.”
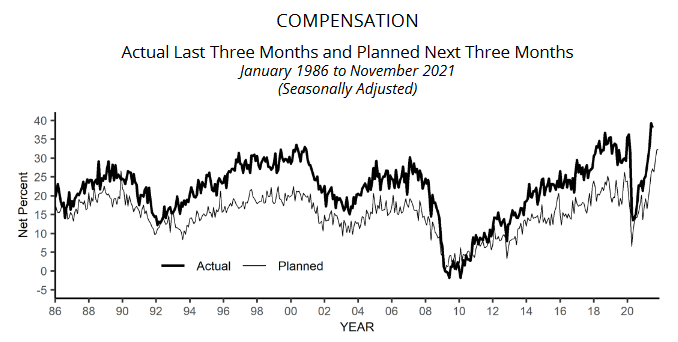 Source: NFIB
As a result, the Fed is now backed into a hawkish corner. And if officials don’t act – which means ending QE and preparing investors for future interest rate hikes – the central bank’s patience will likely push the U.S. economy into an inflation-filled recession.
For context, Bank of America CEO Brian Moynihan said on Dec. 14 that the U.S. economy remains on solid footing:
“We haven’t seen any impact in December at all from the [Omicron] virus,” he said. “Credit quality is very strong, especially on the consumer side, and, given what we see, it should stay strong.”
As a result, if the second-largest bank in the U.S. remains sanguine, then why is the Fed still purchasing bonds? Likewise, with sticky inflation now the biggest threat to a solid U.S. recovery, QE does more harm than good. Thus, the Fed would be wise to heed the warning.
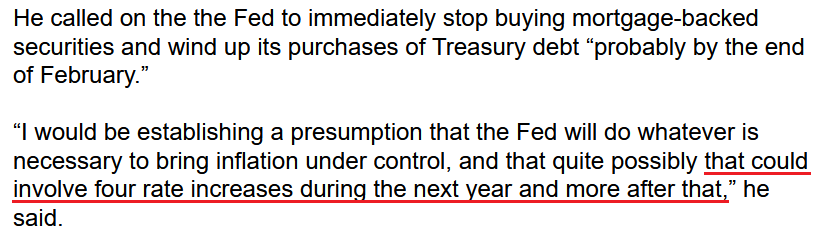
On top of that, former U.S. Treasury Secretary Lawrence Summers – who has also been warning about surging inflation – said on Dec. 14 that the Fed needs to calm the liquidity-fueled asset bubble before it pops.
There is “a lot of euphoria,” he said. “Super-excited retail is usually a sign of trouble to come.” In addition, “there are many who are chasing yield by taking on extra risk. Highly sophisticated endowments and pensions funds are behaving in that way.”
As a result, how does Summers think the Fed should handle the situation?
 Source: Bloomberg
The bottom line? With the Fed flirting with disaster and the PMs caught in the crossfire, it’s no surprise that the 2021 theme of ‘USD Index up, PMs down’ remains alive and well. With the unrelenting commodity PPI now underperforming the headline CPI, the troubling trend needs to be addressed ASAP. As a result, the Fed’s dovish days are likely over, and the PMs could be in a world of hurt if the central bank’s hawkish rhetoric turns into hawkish policy in 2022.
In conclusion, the PMs declined on Dec. 14, and the GDXJ ETF was a noticeable underperformer. With more of the same likely to materialize over the medium term, the winds of change are blowing through the financial markets. Moreover, with the USD Index calmly enjoying the carnage, the greenback’s technical, fundamental and sentiment-driven foundations remain robust. As a result, the U.S. dollar’s divergence from the PMs should leave them on the wrong side of neutral in 2022.
Overview of the Upcoming Part of the Decline
- It seems to me that the current corrective upswing in gold is about to be over soon, and the next short-term move lower is about to begin. Since it appears to be another short-term move more than a continuation of the bigger decline, I think that junior miners would be likely to (at least initially) decline more than silver.
- It seems that the first stop for gold will be close to its previous 2021 lows, slightly below $1,700. Then it will likely correct a bit, but it’s unclear if I want to exit or reverse the current short position based on that – it depends on the number and the nature of the bullish indications that we get at that time.
- After the above-mentioned correction, we’re likely to see a powerful slide, perhaps close to the 2020 low ($1,450 - $1,500).
- If we see a situation where miners slide in a meaningful and volatile way while silver doesn’t (it just declines moderately), I plan to – once again – switch from short positions in miners to short positions in silver. At this time, it’s too early to say at what price levels this could take place, and if we get this kind of opportunity at all – perhaps with gold close to $1,600.
- I plan to exit all remaining short positions once gold shows substantial strength relative to the USD Index while the latter is still rallying. This may be the case with gold close to $1,350 - $1,400. I expect silver to fall the hardest in the final part of the move. This moment (when gold performs very strongly against the rallying USD and miners are strong relative to gold after its substantial decline) is likely to be the best entry point for long-term investments, in my view. This can also happen with gold close to $1,375, but at the moment it’s too early to say with certainty. I expect the final bottom to take place near the end of the year, perhaps in mid-December. It is not set in stone that PMs have to bottom at that time. If not then, then early 2022 would become a likely time target.
- As a confirmation for the above, I will use the (upcoming or perhaps we have already seen it?) top in the general stock market as the starting point for the three-month countdown. The reason is that after the 1929 top, gold miners declined for about three months after the general stock market started to slide. We also saw some confirmations of this theory based on the analogy to 2008. All in all, the precious metals sector is likely to bottom about three months after the general stock market tops. The additional confirmation will come from the tapering schedule, as markets are likely to move on the rumor and reverse on the fact as they tend to do in general.
- The above is based on the information available today, and it might change in the following days/weeks.
You will find my general overview of the outlook for gold on the chart below:
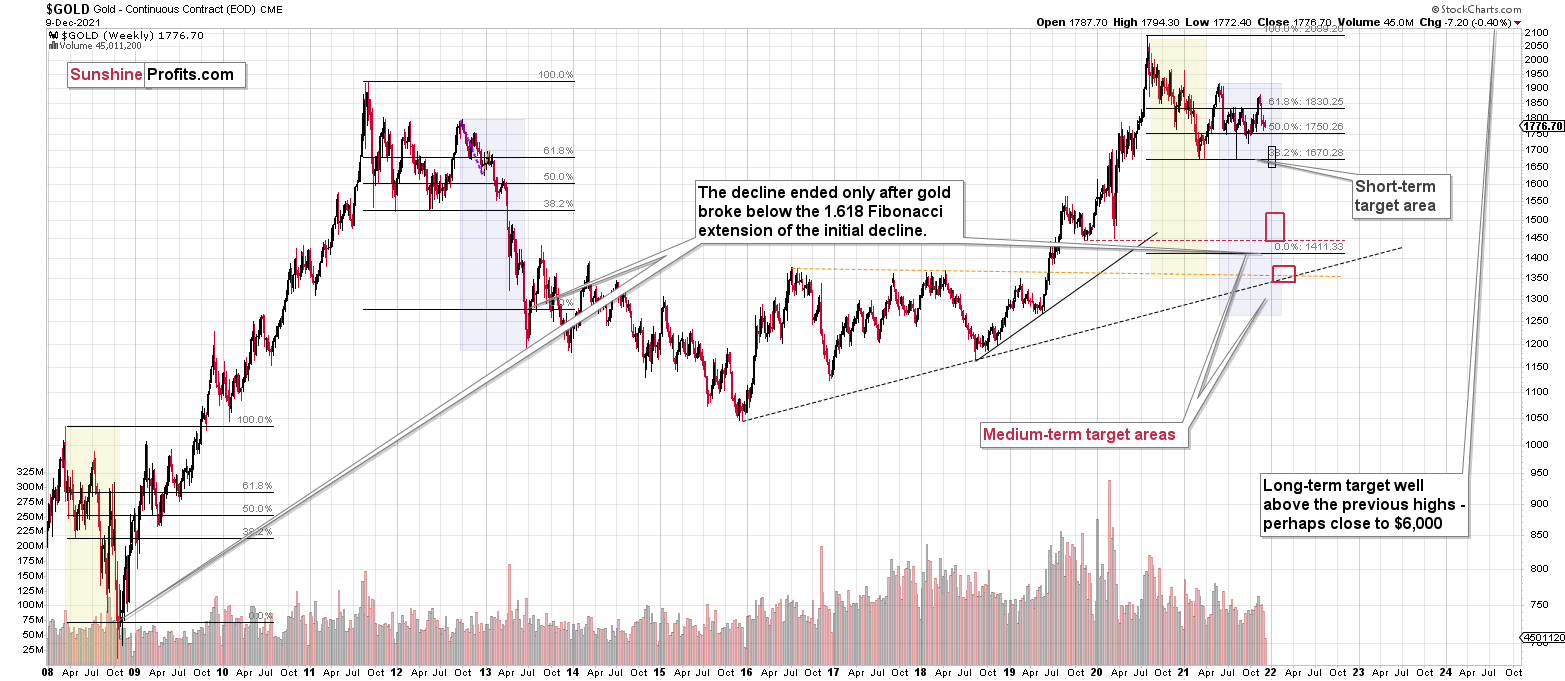
Please note that the above timing details are relatively broad and “for general overview only” – so that you know more or less what I think and how volatile I think the moves are likely to be – on an approximate basis. These time targets are not binding or clear enough for me to think that they should be used for purchasing options, warrants or similar instruments.
Letters to the Editor
Q: PR, I am very happy with your trading alert newsletters. Please keep up the good work. I am writing to ask you to reconcile the following two statements I first noticed in the Tuesday 12/14/21 alert. The first statement is in the Overview of the Upcoming Part of the Decline where you state in step 2: “Then it will likely correct a bit, but it’s unclear if I want to exit or reverse the current short position based on that.” The second statement is in the Summary, where you recommend setting a binding profit-take level for the JDST: $16.18. The two statements appear at odds to me as it seems JDST would be at the $16.18 price level when gold is slightly below $1,700. Especially, please tell me if you are still recommending a binding sell order be set at $16.18 for JDST.
A: Thank you, I’m very happy that you enjoy my services. Both points that you raised are up-to-date. I do think that gold is likely to form an interim bottom close to its previous 2021 lows, likely below $1,700, AND I think that JDST would be likely to reach $16.18 at that time, AND I would like to exit the short position at that time (just my opinion, not investment advice/recommendation). Then I would like to re-enter that short position after the rebound. You are correct that I’m not sure if I want to enter a long position for this rebound – it depends on the way this target is reached (volatile or steady manner, what will other markets do, etc.).
Summary
Summing up, gold declined in tune with my long-term-based indications, and the medium-term downtrend appears to have resumed. Based on the analogy to 2013 and other factors, a bigger decline in gold appears to be just around the corner (regardless of what happens in the very near term).
If the new Covid-19 variant makes the vaccine rather useless, we might be in for very wild price moves in most markets. In the case of the precious metals sector, the initial move should be to the downside, but at the same time, it makes the long-term outlook even more bullish.
It seems that we might see a short-term bottom close to the middle of December (since we’re right in the middle of December now, please keep in mind that this means that we might see a significant move shortly), and perhaps that’s when gold will move to its previous 2021 lows. However, I don’t think that it would be the final bottom. Conversely, it seems that the final bottom would form lower after a short-term correction (from the above-mentioned December lows).
From the medium-term point of view, the key two long-term factors remain the analogy to 2013 in gold and the broad head and shoulders pattern in the HUI Index. They both suggest much lower prices ahead.
It seems that our profits from the short positions are going to become truly epic in the following months.
After the sell-off (that takes gold to about $1,350 - $1,500), I expect the precious metals to rally significantly. The final part of the decline might take as little as 1-5 weeks, so it's important to stay alert to any changes.
Most importantly, please stay healthy and safe. We made a lot of money last March and this March, and it seems that we’re about to make much more on the upcoming decline, but you have to be healthy to enjoy the results.
As always, we'll keep you - our subscribers - informed.
By the way, we’re currently providing you with the possibility to extend your subscription by a year, two years or even three years with a special 20% discount. This discount can be applied right away, without the need to wait for your next renewal – if you choose to secure your premium access and complete the payment upfront. The boring time in the PMs is definitely over, and the time to pay close attention to the market is here. Naturally, it’s your capital, and the choice is up to you, but it seems that it might be a good idea to secure more premium access now while saving 20% at the same time. Our support team will be happy to assist you in the above-described upgrade at preferential terms – if you’d like to proceed, please contact us.
To summarize:
Trading capital (supplementary part of the portfolio; our opinion): Full speculative short positions (300% of the full position) in junior mining stocks are justified from the risk to reward point of view with the following binding exit profit-take price levels:
Mining stocks (price levels for the GDXJ ETF): binding profit-take exit price: $35.73; stop-loss: none (the volatility is too big to justify a stop-loss order in case of this particular trade)
Alternatively, if one seeks leverage, we’re providing the binding profit-take levels for the JDST (2x leveraged) and GDXD (3x leveraged – which is not suggested for most traders/investors due to the significant leverage). The binding profit-take level for the JDST: $16.18; stop-loss for the JDST: none (the volatility is too big to justify a SL order in case of this particular trade); binding profit-take level for the GDXD: $32.08; stop-loss for the GDXD: none (the volatility is too big to justify a SL order in case of this particular trade).
For-your-information targets (our opinion; we continue to think that mining stocks are the preferred way of taking advantage of the upcoming price move, but if for whatever reason one wants / has to use silver or gold for this trade, we are providing the details anyway.):
Silver futures downside profit-take exit price: $19.12
SLV profit-take exit price: $17.72
ZSL profit-take exit price: $41.38
Gold futures downside profit-take exit price: $1,683
HGD.TO – alternative (Canadian) inverse 2x leveraged gold stocks ETF – the upside profit-take exit price: $12.48
HZD.TO – alternative (Canadian) inverse 2x leveraged silver ETF – the upside profit-take exit price: $30.48
Long-term capital (core part of the portfolio; our opinion): No positions (in other words: cash
Insurance capital (core part of the portfolio; our opinion): Full position
Whether you already subscribed or not, we encourage you to find out how to make the most of our alerts and read our replies to the most common alert-and-gold-trading-related-questions.
Please note that we describe the situation for the day that the alert is posted in the trading section. In other words, if we are writing about a speculative position, it means that it is up-to-date on the day it was posted. We are also featuring the initial target prices to decide whether keeping a position on a given day is in tune with your approach (some moves are too small for medium-term traders, and some might appear too big for day-traders).
Additionally, you might want to read why our stop-loss orders are usually relatively far from the current price.
Please note that a full position doesn't mean using all of the capital for a given trade. You will find details on our thoughts on gold portfolio structuring in the Key Insights section on our website.
As a reminder - "initial target price" means exactly that - an "initial" one. It's not a price level at which we suggest closing positions. If this becomes the case (like it did in the previous trade), we will refer to these levels as levels of exit orders (exactly as we've done previously). Stop-loss levels, however, are naturally not "initial", but something that, in our opinion, might be entered as an order.
Since it is impossible to synchronize target prices and stop-loss levels for all the ETFs and ETNs with the main markets that we provide these levels for (gold, silver and mining stocks - the GDX ETF), the stop-loss levels and target prices for other ETNs and ETF (among other: UGL, GLL, AGQ, ZSL, NUGT, DUST, JNUG, JDST) are provided as supplementary, and not as "final". This means that if a stop-loss or a target level is reached for any of the "additional instruments" (GLL for instance), but not for the "main instrument" (gold in this case), we will view positions in both gold and GLL as still open and the stop-loss for GLL would have to be moved lower. On the other hand, if gold moves to a stop-loss level but GLL doesn't, then we will view both positions (in gold and GLL) as closed. In other words, since it's not possible to be 100% certain that each related instrument moves to a given level when the underlying instrument does, we can't provide levels that would be binding. The levels that we do provide are our best estimate of the levels that will correspond to the levels in the underlying assets, but it will be the underlying assets that one will need to focus on regarding the signs pointing to closing a given position or keeping it open. We might adjust the levels in the "additional instruments" without adjusting the levels in the "main instruments", which will simply mean that we have improved our estimation of these levels, not that we changed our outlook on the markets. We are already working on a tool that would update these levels daily for the most popular ETFs, ETNs and individual mining stocks.
Our preferred ways to invest in and to trade gold along with the reasoning can be found in the how to buy gold section. Furthermore, our preferred ETFs and ETNs can be found in our Gold & Silver ETF Ranking.
As a reminder, Gold & Silver Trading Alerts are posted before or on each trading day (we usually post them before the opening bell, but we don't promise doing that each day). If there's anything urgent, we will send you an additional small alert before posting the main one.
Thank you.
Przemyslaw Radomski, CFA
Founder, Editor-in-chief

