

Briefly: in our opinion, full (250% of the regular size of the position) speculative short positions in gold, silver and mining stocks are justified from the risk/reward perspective at the moment of publishing this alert.
The USD Index moved lower yesterday, but at the same time the precious metals sector also moved lower despite the early gains. One of the above is providing fake signals. Which one is it?
The USD Index. The USDX is an index and while its analysis is very important, it ultimately cannot move significantly in a given way if its key components (the euro and the yen) are not supporting this move.
Let’s take a look at what happened in the USD Index and then we’ll move to the above-mentioned components (charts courtesy of http://stockcharts.com).
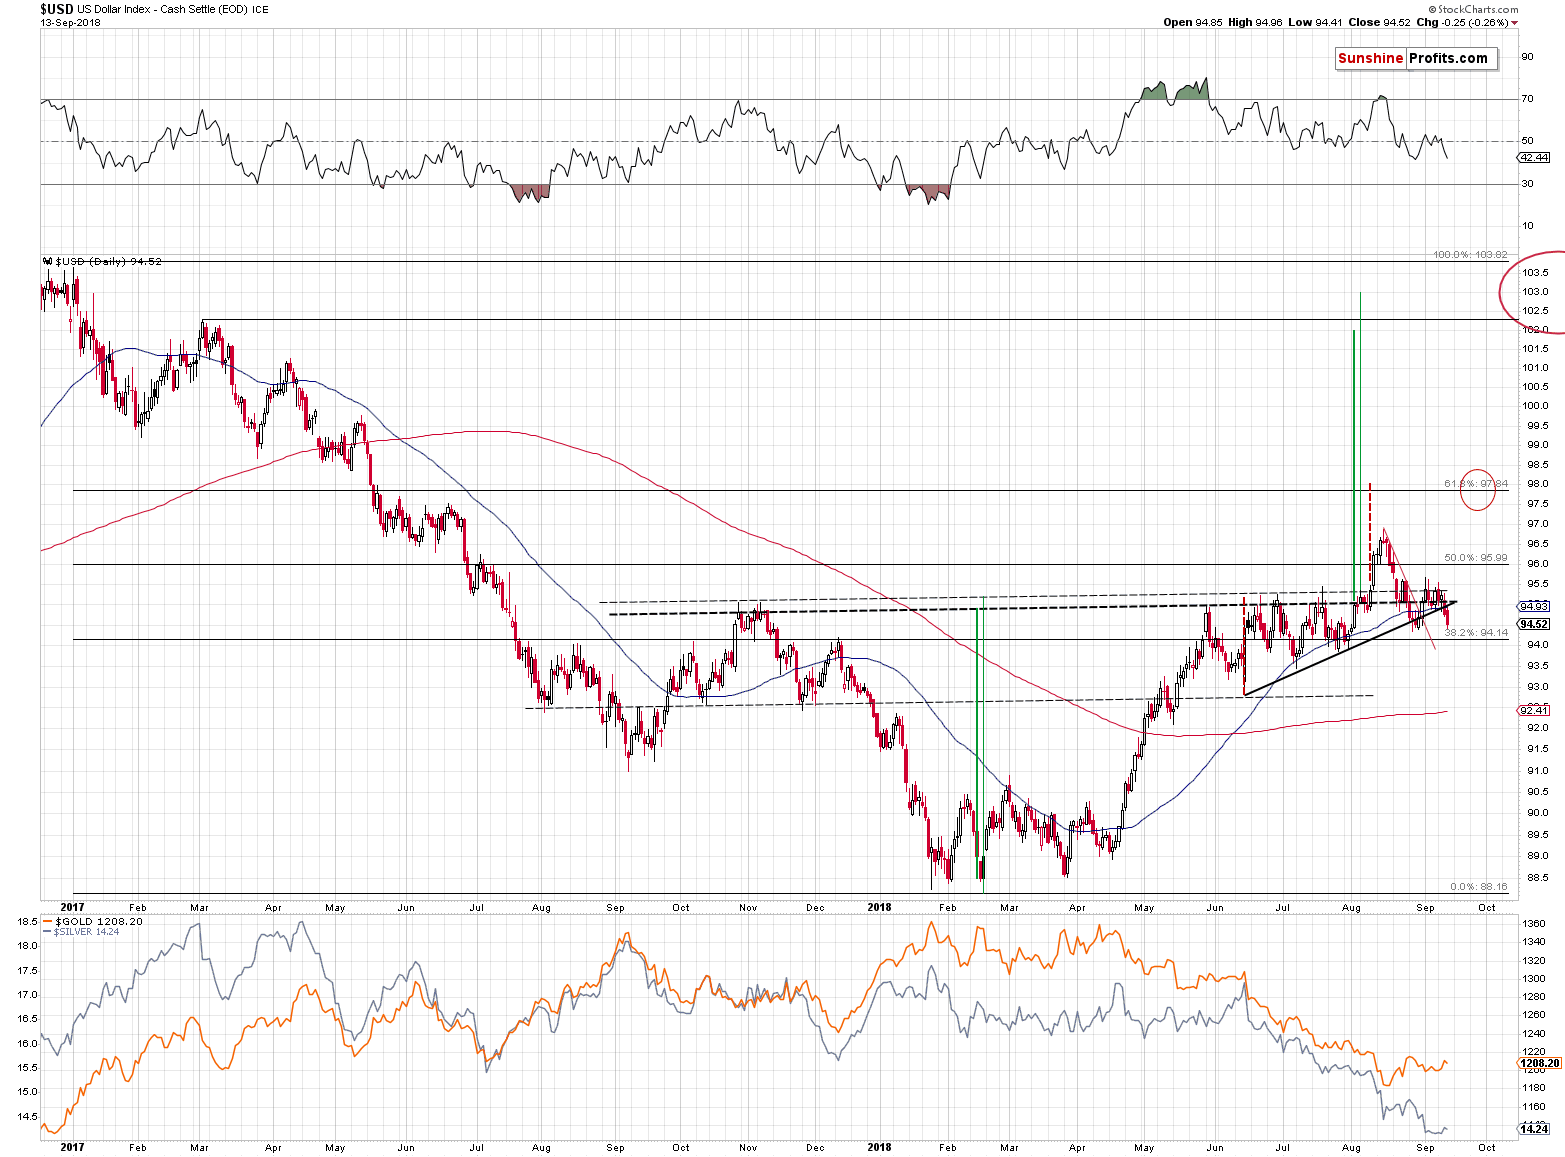
In yesterday’s analysis, we wrote that the breakdown below the rising support line was small and that it was not confirmed. We emphasized that since we had already seen a similar small move below this line, which was quickly followed by an invalidation and a powerful slide in the PMs (especially in silver and mining stocks), we strongly doubted the bearish implications of the current breakdown. And we still do.
We generally prefer to see three closing prices below or above a certain level to say that a breakdown or a breakout is confirmed and we have only seen two subsequent closes below the rising black support line. But, even if we saw it, it would still not be enough – on its own – to make the outlook bearish. The reasons are: the long-term USDX chart, situation in the euro, and situation in the yen.
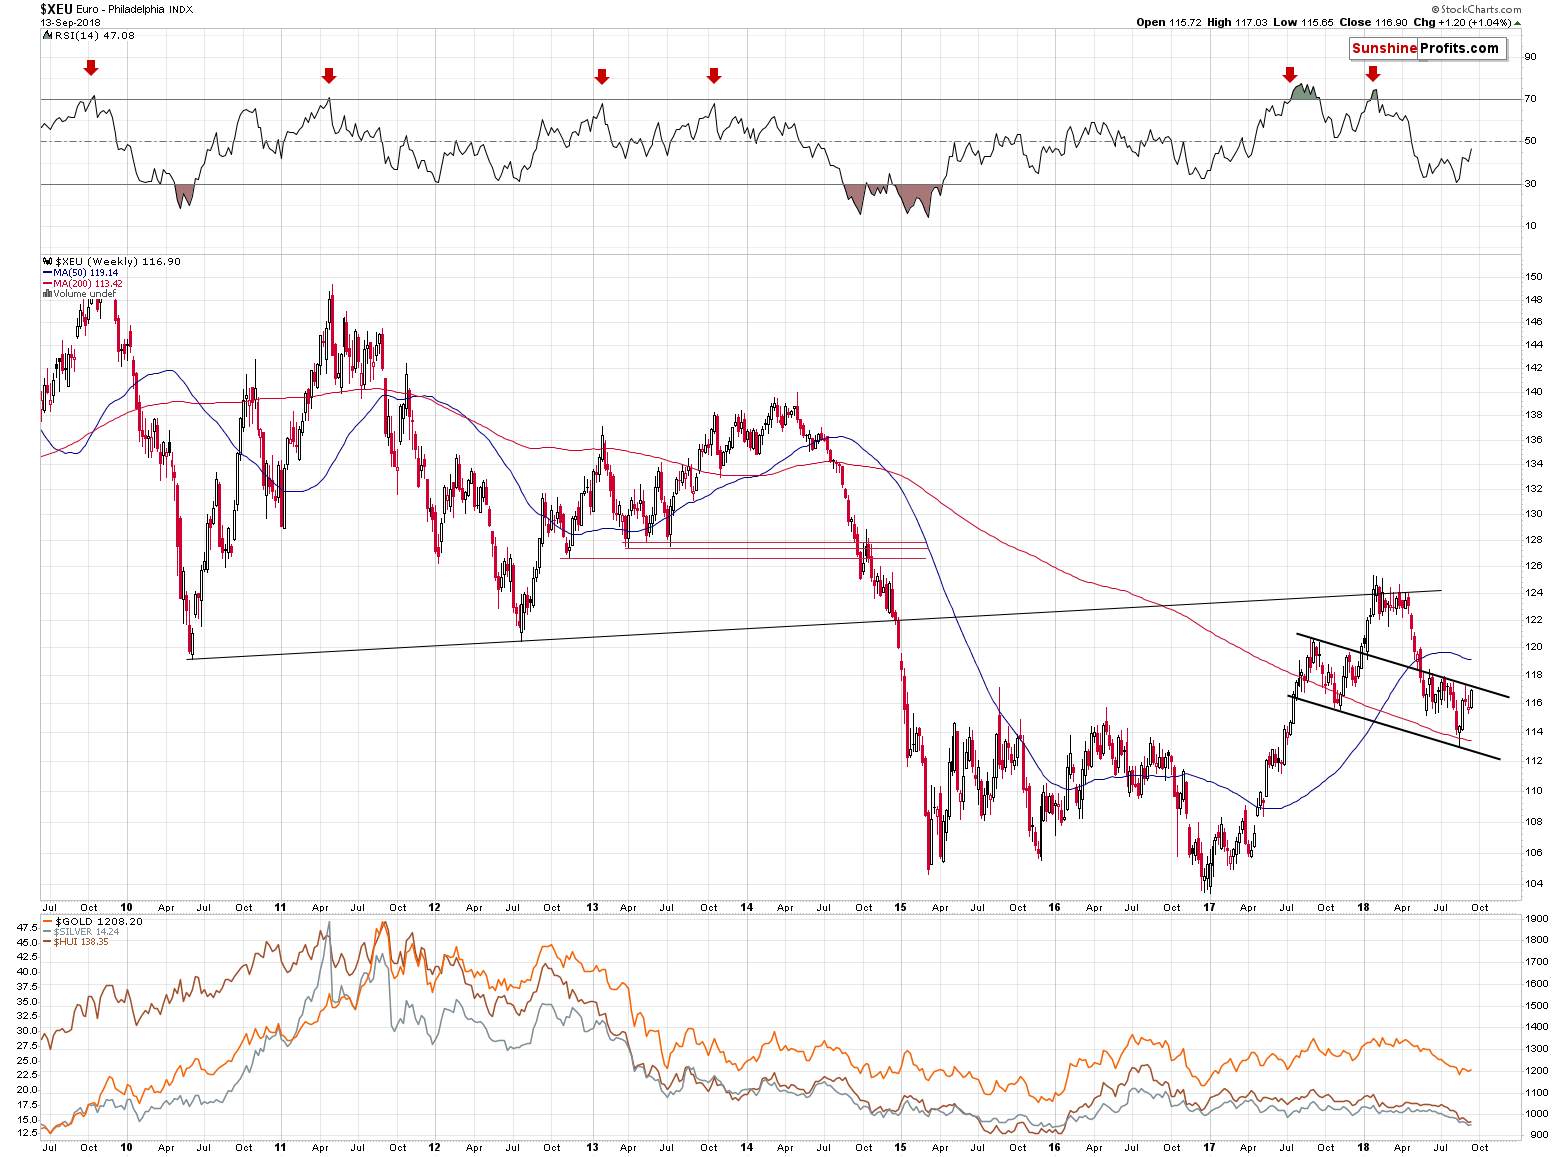
The European currency moved higher recently, but it reached the line that’s parallel to the neck level of the possible head-and-shoulders formation. Naturally, the formation is not yet active as it was not completed. However, it is quite often the case that when the bottoms used for drawing shoulders are not at the same price level, and the formation is skewed, the “shoulder tops” are often aligned with the bottoms that preceded it. It’s difficult to describe, but it’s easy to see on the chart. The line parallel to the line based on the late-2017 and 2018 bottom is a likely target for the current move higher. As long as it remains unbroken, the outlook remains unchanged.
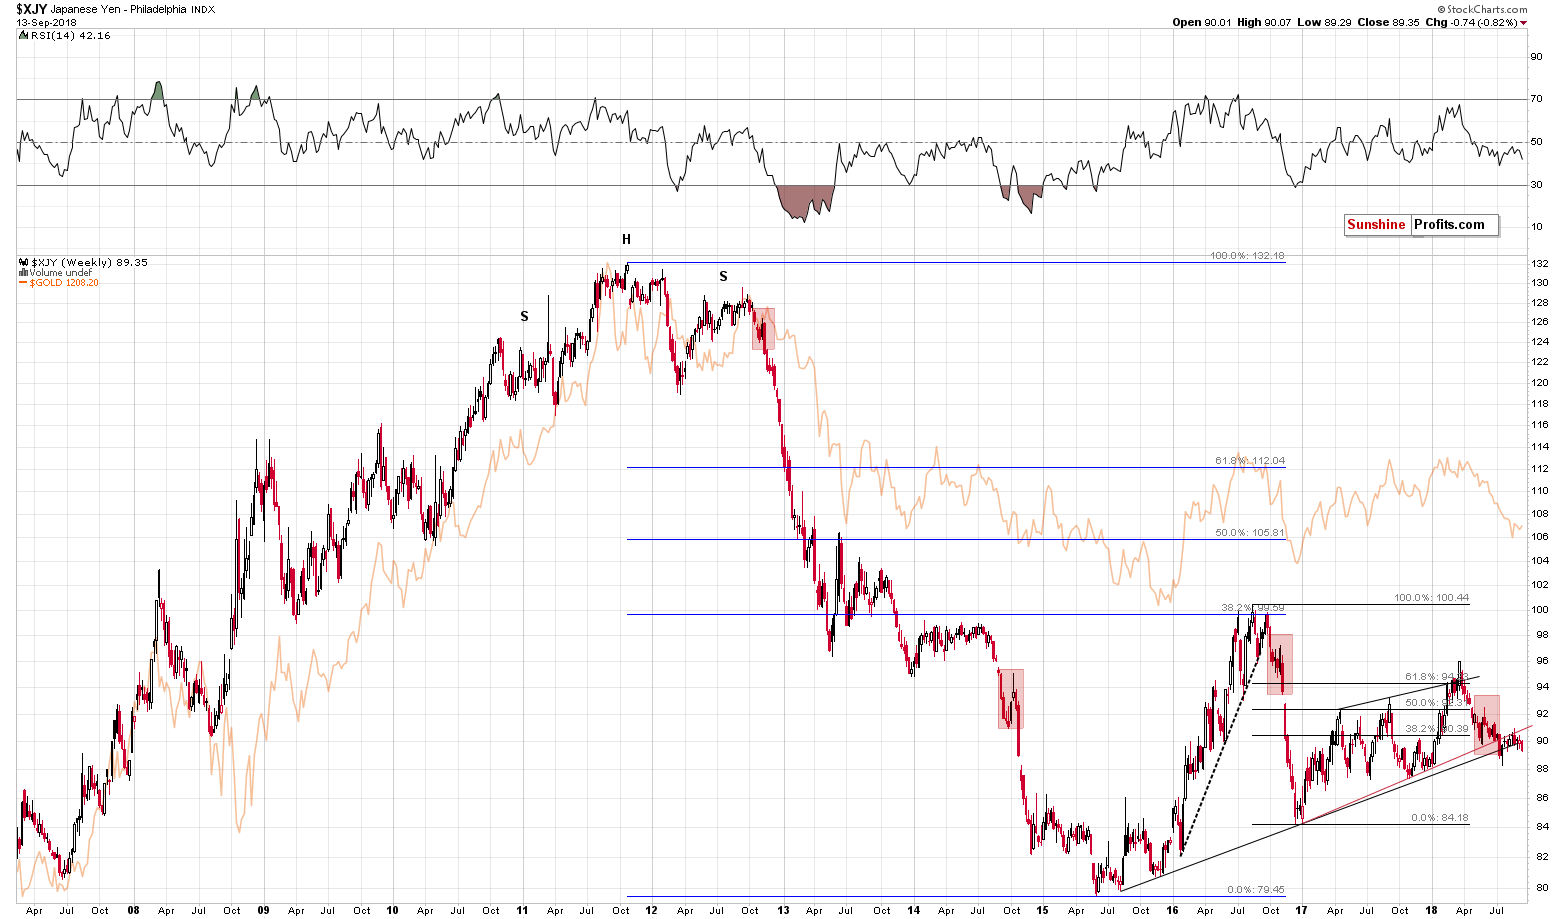
The situation in the Japanese yen appears even more critical. After breaking below the rising red medium-term support line and confirming this breakdown by moving back and forth below this line, the Japanese yen is finally breaking below the even more important support line. The rising long-term support line is based on two 2015 bottoms and the early 2017 bottom. All of these bottoms corresponded to the important bottoms in the price of gold.
Since the line is being broken and – unless the yen rallies strongly today – the week is going to end with the currency below this key support line. At the moment of writing these words, the yen is not rallying strongly (it’s a bit higher, but the move is small), so the above scenario appears very likely. The implications are already bearish, and they will be very bearish if we indeed see the breakdown in terms of the weekly closing prices.
With yen about to start a powerful slide based on the above-mentioned breakdown and the euro that’s about to reverse its course based on the nearby resistance, it’s very unlikely that the USD Index would move much lower from here. Conversely, it seems that the potential for additional declines is very limited while the upside potential is huge. After all, based on the reverse head-and-shoulders formation, the USDX is likely to reach the 102 – 103 area.
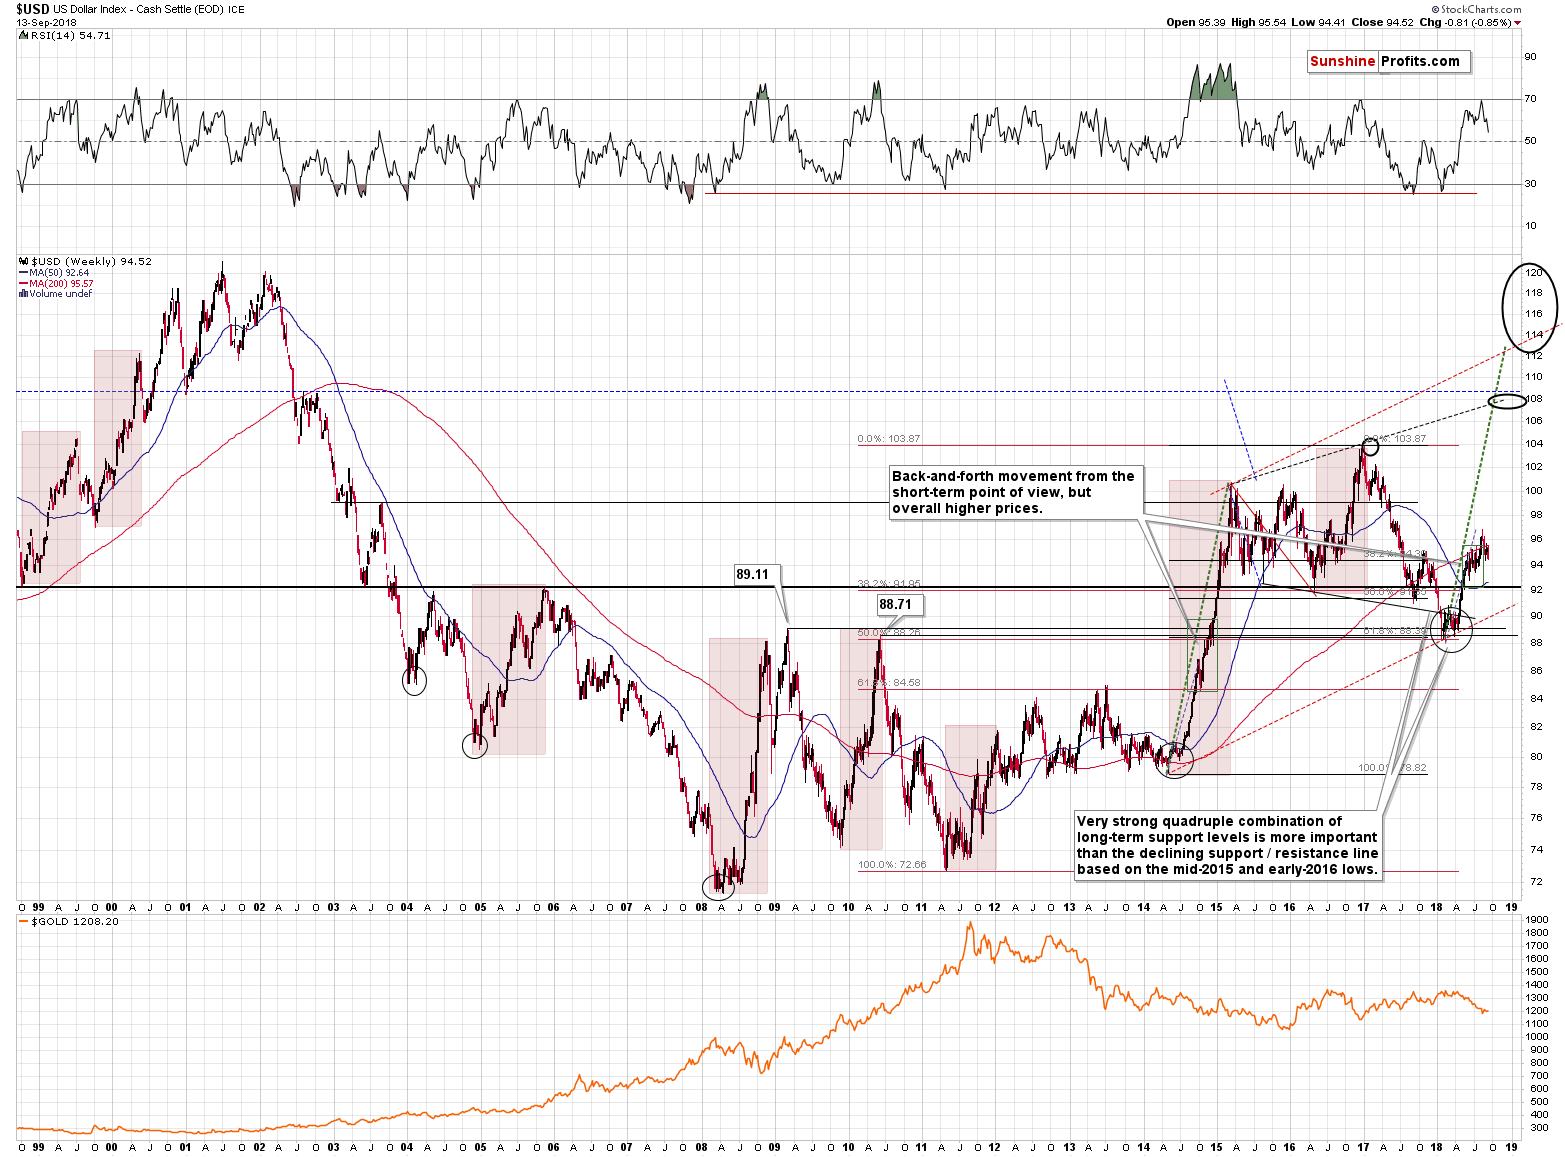
The targets that are based on the long-term analogies in the USDX are even higher. The lower of them is at 108 and the higher is the 112 – 120 area. Based on the shape and strength of the rally that we saw this year (and on the levels that the RSI reached) it seems that the current upswing is just like the ones that started in 2008, 2010, and 2014. Please note how similar is the current running correction to what we saw in the first half of 2010, and to some extent to what we saw in late 2014.
The running corrections are the corrections that take place during the strongest rallies, where the only thing that the bears are able to generate is slowing down the pace of growth. That’s exactly what we see right now. The implications are very bullish.
In fact, we just realized something. It’s strange how one can look at the same chart day after day for weeks and only discover something after looking at a few extra factors. Based on the above long-term USDX chart and the euro chart that we featured earlier, it seems that we might have been too conservative in drawing the reverse head and shoulders on the previous USD Index chart. Let’s take a different look at it.
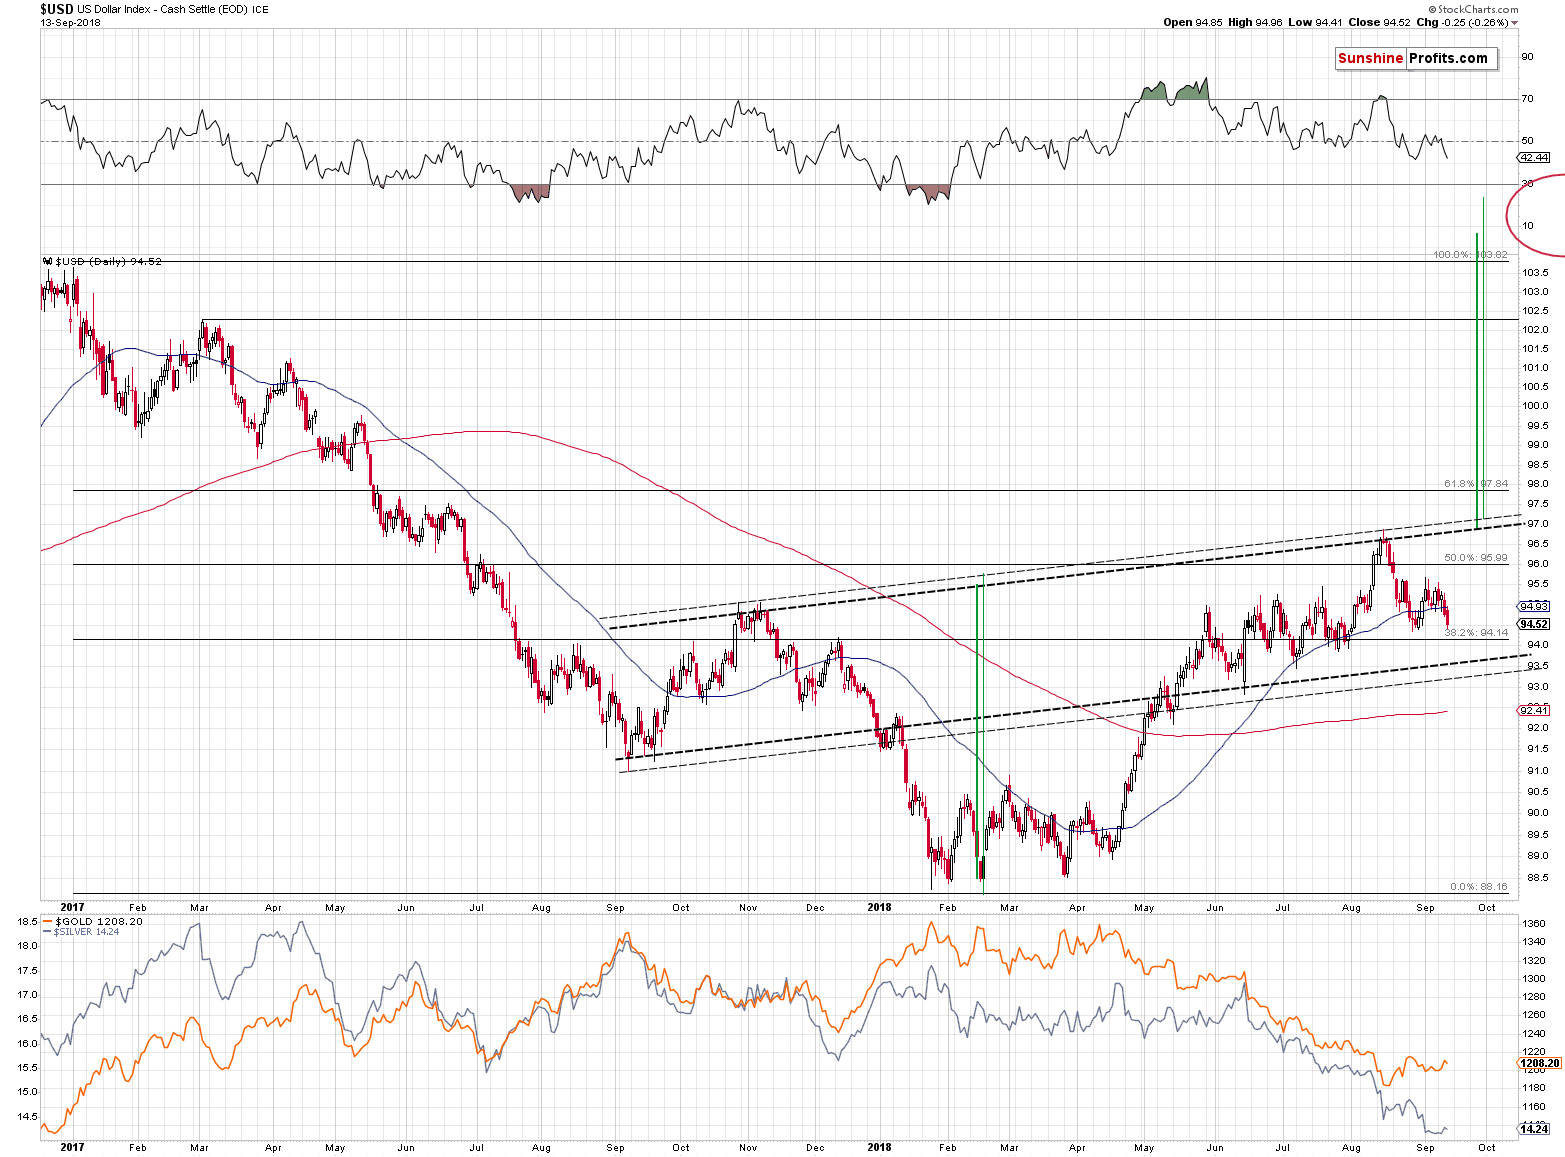
If we assume that the reverse head-and-shoulders is actually skewed, then it was not completed yet, but it was also not invalidated yet. But, does it mean that the USD Index is likely to move all the way down to 93.5 or so before moving up? No, that’s just a maximum size of the decline that would definitely not invalidate the formation. Based on what we already discussed, it doesn’t seem that the USD Index will drop that low. In fact it could turn up even today, or early next week.
The most important thing is that it doesn’t matter much because the downside is very limited and the upside is huge. This has profoundly bearish implications for the precious metals sector for the upcoming weeks.
Speaking of precious metals, let’s take a look at what happened in gold.
Breakdowns’ Verifications and Intraday Reversals
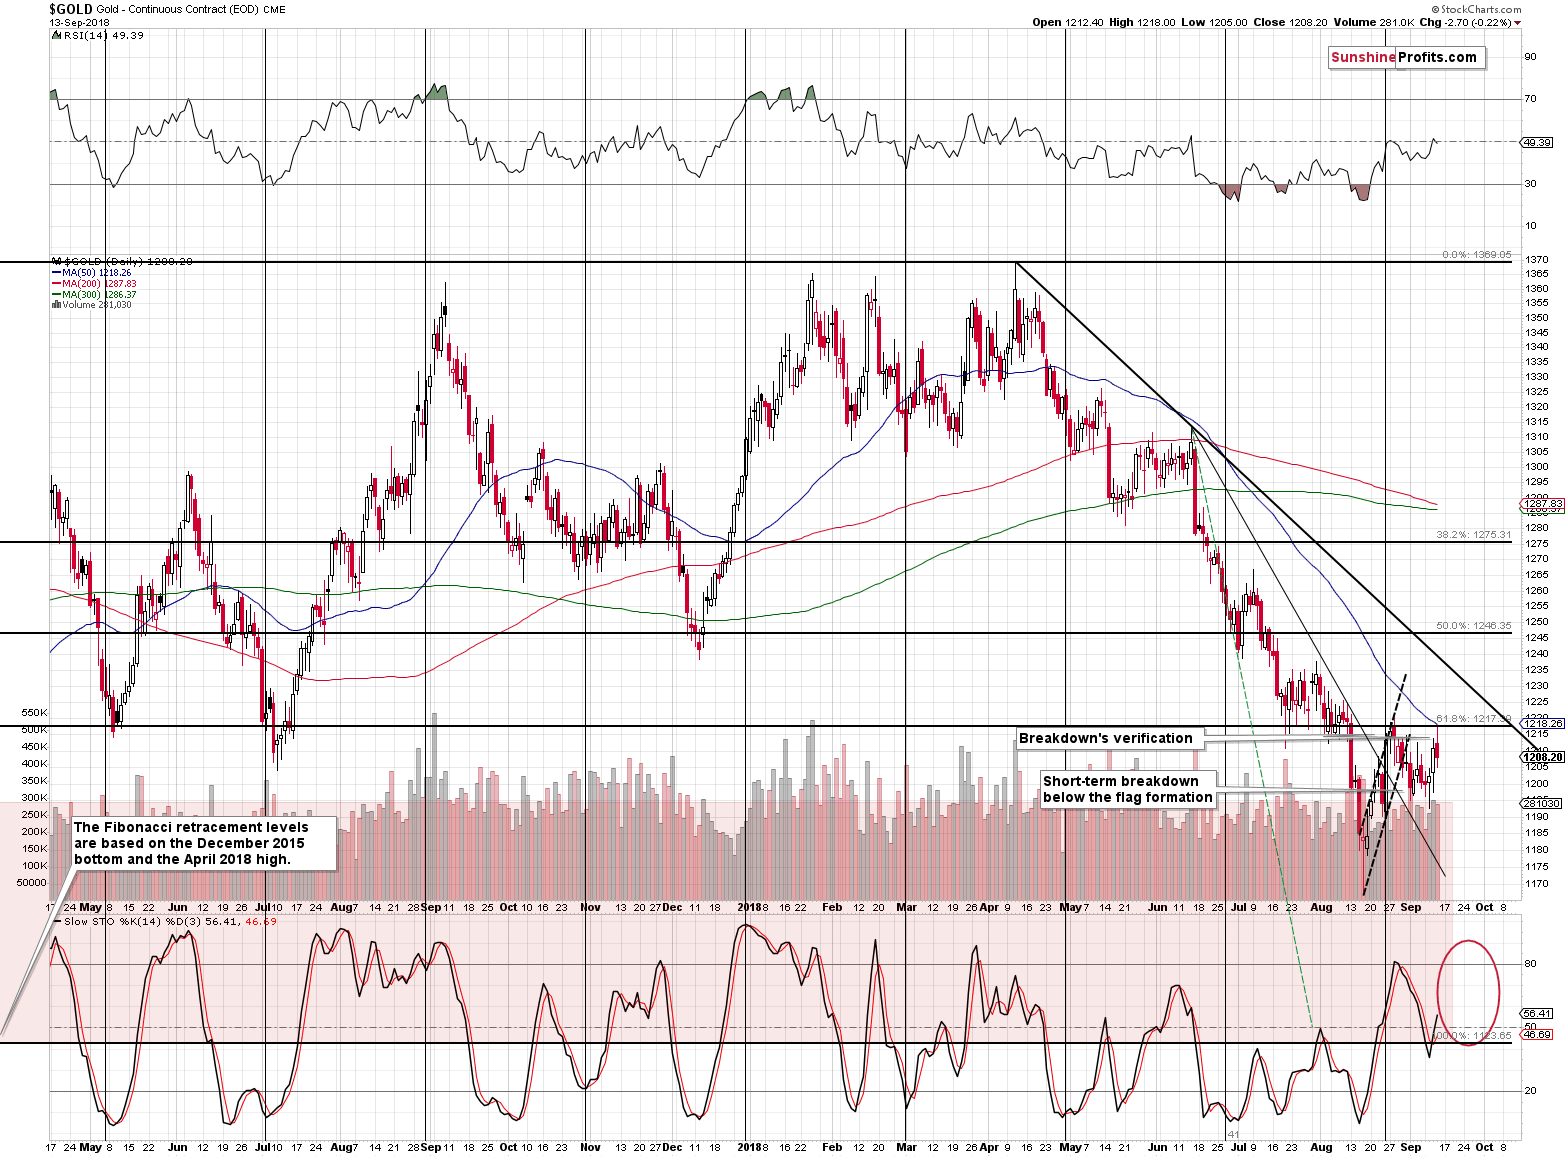
The interpretation of yesterday’s price action is quite straightforward. The yellow metal moved temporarily higher, but it only managed to touch the previously broken 61.8% Fibonacci retracement level and once again verify it as strong resistance. Moreover, gold declined in terms of the daily closing prices, almost creating the bearish shooting star candlestick. Almost, because the accompanying volume was not huge and thus the necessary confirmation was absent. But still, the implications are bearish, especially that gold declined despite USD’s daily weakness.
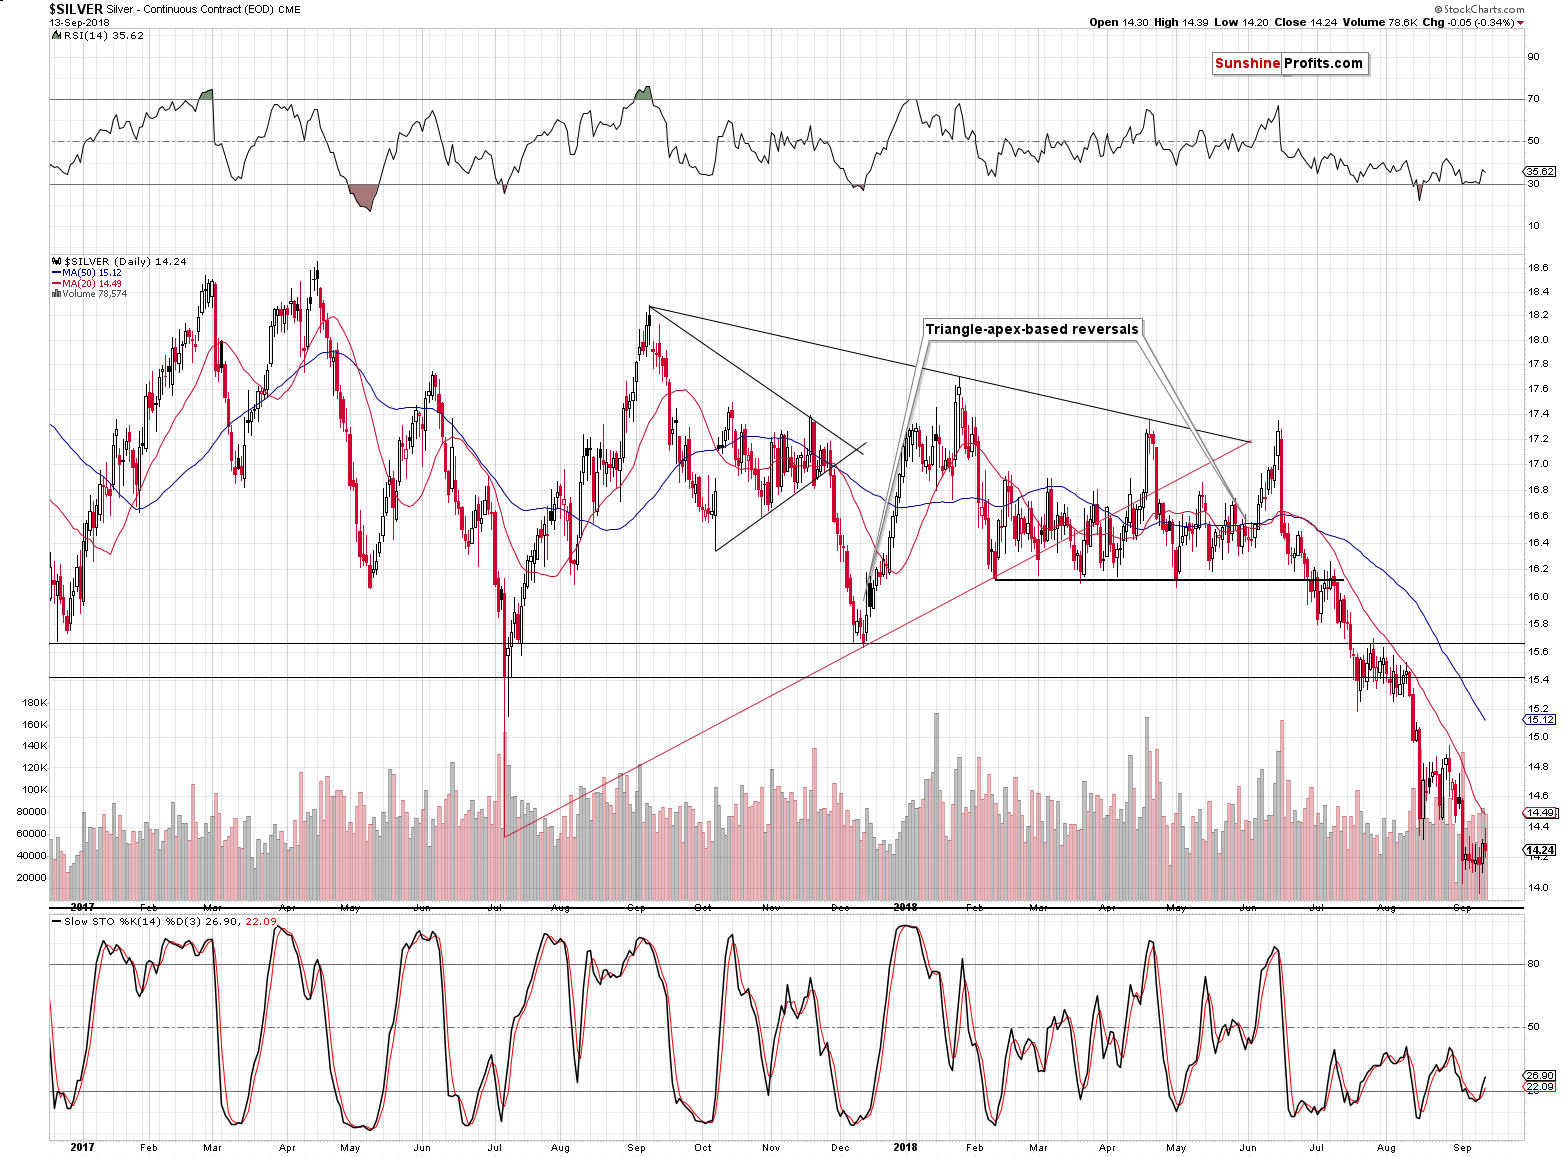
We saw something similar on the silver market. The white metal moved higher, but managed to move to the previous bottom on an intraday basis. In terms of the daily closing prices, silver declined. Consequently, yesterday’s intraday rally seems to have been nothing else than a verification of the breakdown below the previous lows. The implications remain bearish.
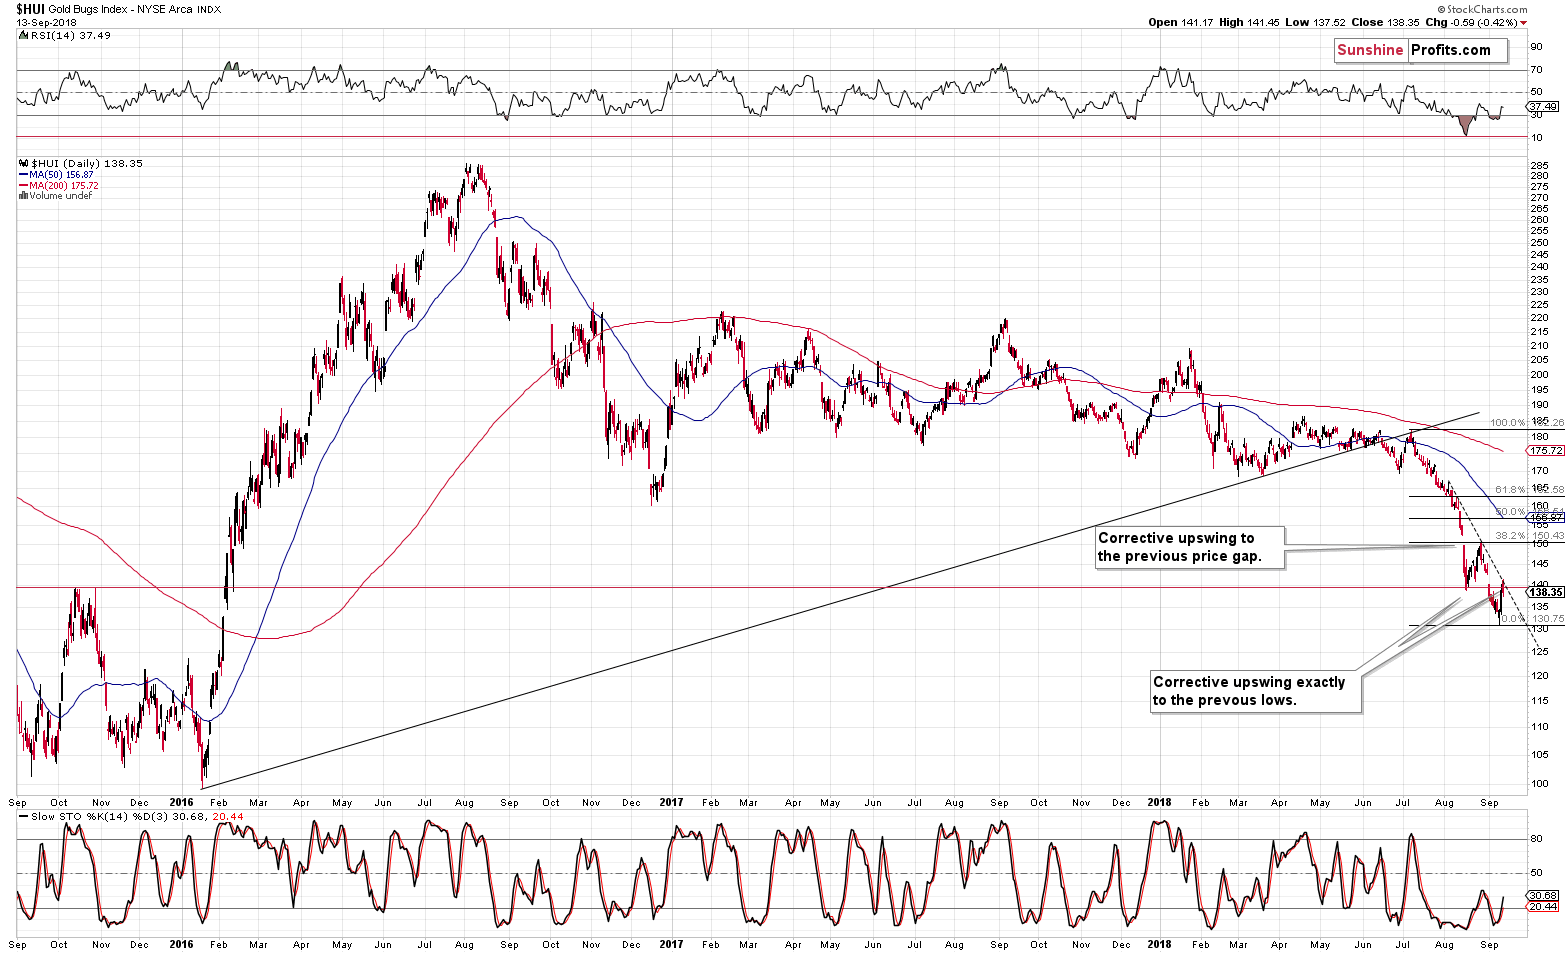
Mining stocks provided similar signals to what we discussed below gold’s and silver’s charts. The HUI Index moved to the declining dashed resistance line, making it more likely that the decline can now continue. After all, this line was a way to create a very short-term price target. Since it was reached, the decline can now continue.
It’s also notable that the HUI Index failed to hold above the late-2015 highs and closed the session back below them. It’s a strong bearish indication.
Important Analyses
Before summarizing, we would like to emphasize that we have recently posted several analyses that are very important and that one should keep in mind, especially in the next several weeks. If you haven’t had the chance of reading them previously, we encourage you to do so today:
- Dear Gold Investor - Letters from 2013 - Analogy to 2013, which should make it easier to trade the upcoming sizable upswing (if enough factors point to it, that is) and to enter the market close to the final bottom.
- Gold to Soar Above $6,000 - discussion of gold’s long-term upside target of $6,000.
- Preparing for THE Bottom in Gold: Part 6 – What to Buy - extremely important analysis of the portfolio structure for the next huge, multi-year rally in the precious metals.
- Preparing for THE Bottom in Gold: Part 7 – Buy-and-hold on Steroids – description of a strategy dedicated to significantly boosting one’s long-term investment returns while staying invested in the PM sector.
- Gold’s Downside Target, Upcoming Rebound, and Miners’ Buy Plan - details regarding the shape of the following price moves, a buying plan for mining stocks, and a brief discussion of the final price targets for the current decline.
- Gold: What Happened vs. What Changed – discussion of the latest extreme readings from gold’s CoT report
- Key Factors for Gold & Silver Investors - discussion of key, long-term factors that support the bearish outlook for PMs. We are often asked what makes us so bearish – this article is a reply to this question.
- The Upcoming Silver Surprise – two sets of price targets for gold, silver and mining stocks: the initial and the final one.
Summary
Summing up, Wednesday’s and yesterday’s early upswings seemed like a bullish development, but looking at it closely reveals that nothing really changed from the technical point of view. Consequently, the outlook remains very bearish. The move lower is likely to be sharp and the profits on the current short position are likely to change from being huge to being enormous and then finally to being ridiculous. It may be tempting to close the speculative short positions and take profits off the table, but in our opinion it’s a very bad idea.
It’s true that nobody ever went broke by taking profits, but one’s profits or losses don’t determine what’s going to happen in the market next. There are multiple signs that point to certain outcomes and the status of the current position is not one of them. In our opinion, taking into account all the factors that we have right now, makes the extra-large speculative short positions justified from the risk to reward point of view. It’s not a good time to close the short position. It’s a good time to enter it, if one didn’t have it in the first place.
Also, given gold’s movement back and forth around the $1,200 level, it may be tempting to take the “wait and see” approach, but we think that this is not a good idea. As we explained yesterday, the current situation is very similar to what we saw in 2013 right before the biggest and most volatile plunge of the decade. Taking the wait-and-see approach right before that decline would have most likely led to missing the biggest profits practically entirely. After all, who wants to enter a new short position after gold is already down $100 in a day? Nobody – and that was only half of the slide.
That’s why it’s so important to be prepared now, not after the decline. Once it’s over, it will be too late and those, who missed the profits on the upcoming decline will likely regret this for years. We don’t want you to be in that group – we want you to profit on this move.
As always, we’ll keep you – our subscribers – informed.
To summarize
Trading capital (supplementary part of the portfolio; our opinion): Full short positions (250% of the full position) in gold, silver and mining stocks are justified from the risk/reward perspective with the following stop-loss orders and exit profit-take price levels:
- Gold: profit-take exit price: $1,062; stop-loss: $1,226; initial target price for the DGLD ETN: $82.96; stop-loss for the DGLD ETN $53.67
- Silver: profit-take exit price: $12.72; stop-loss: $15.16; initial target price for the DSLV ETN: $46.97; stop-loss for the DSLV ETN $31.37
- Mining stocks (price levels for the GDX ETF): profit-take exit price: $13.12; stop-loss: $19.61; initial target price for the DUST ETF: $80.97; stop-loss for the DUST ETF $33.37
Note: the above is a specific preparation for a possible sudden price drop, it does not reflect the most likely outcome. You will find a more detailed explanation in our August 1 Alert. In case one wants to bet on junior mining stocks’ prices (we do not suggest doing so – we think senior mining stocks are more predictable in the case of short-term trades – if one wants to do it anyway, we provide the details), here are the stop-loss details and target prices:
- GDXJ ETF: profit-take exit price: $17.52; stop-loss: $29.43
- JDST ETF: initial target price: $154.97 stop-loss: $64.88
Long-term capital (core part of the portfolio; our opinion): No positions (in other words: cash)
Insurance capital (core part of the portfolio; our opinion): Full position
Important Details for New Subscribers
Whether you already subscribed or not, we encourage you to find out how to make the most of our alerts and read our replies to the most common alert-and-gold-trading-related-questions.
Please note that the in the trading section we describe the situation for the day that the alert is posted. In other words, it we are writing about a speculative position, it means that it is up-to-date on the day it was posted. We are also featuring the initial target prices, so that you can decide whether keeping a position on a given day is something that is in tune with your approach (some moves are too small for medium-term traders and some might appear too big for day-traders).
Plus, you might want to read why our stop-loss orders are usually relatively far from the current price.
Please note that a full position doesn’t mean using all of the capital for a given trade. You will find details on our thoughts on gold portfolio structuring in the Key Insights section on our website.
As a reminder – “initial target price” means exactly that – an “initial” one, it’s not a price level at which we suggest closing positions. If this becomes the case (like it did in the previous trade) we will refer to these levels as levels of exit orders (exactly as we’ve done previously). Stop-loss levels, however, are naturally not “initial”, but something that, in our opinion, might be entered as an order.
Since it is impossible to synchronize target prices and stop-loss levels for all the ETFs and ETNs with the main markets that we provide these levels for (gold, silver and mining stocks – the GDX ETF), the stop-loss levels and target prices for other ETNs and ETF (among other: UGLD, DGLD, USLV, DSLV, NUGT, DUST, JNUG, JDST) are provided as supplementary, and not as “final”. This means that if a stop-loss or a target level is reached for any of the “additional instruments” (DGLD for instance), but not for the “main instrument” (gold in this case), we will view positions in both gold and DGLD as still open and the stop-loss for DGLD would have to be moved lower. On the other hand, if gold moves to a stop-loss level but DGLD doesn’t, then we will view both positions (in gold and DGLD) as closed. In other words, since it’s not possible to be 100% certain that each related instrument moves to a given level when the underlying instrument does, we can’t provide levels that would be binding. The levels that we do provide are our best estimate of the levels that will correspond to the levels in the underlying assets, but it will be the underlying assets that one will need to focus on regarding the signs pointing to closing a given position or keeping it open. We might adjust the levels in the “additional instruments” without adjusting the levels in the “main instruments”, which will simply mean that we have improved our estimation of these levels, not that we changed our outlook on the markets. We are already working on a tool that would update these levels on a daily basis for the most popular ETFs, ETNs and individual mining stocks.
Our preferred ways to invest in and to trade gold along with the reasoning can be found in the how to buy gold section. Additionally, our preferred ETFs and ETNs can be found in our Gold & Silver ETF Ranking.
As a reminder, Gold & Silver Trading Alerts are posted before or on each trading day (we usually post them before the opening bell, but we don't promise doing that each day). If there's anything urgent, we will send you an additional small alert before posting the main one.
=====
Latest Free Trading Alerts:
Are we going to fall into the trap of a self-fulfilling prophecy? Could investors trigger recession only because they are so worried about inversion of the yield curve? We invite you to read our today’s article about the yield curve and find out whether the popularity of the yield curve as an indicator of recession will bring on the recession that everyone is so afraid of.
Gold Bulls: Don’t Count on Yield Curve
=====
Thank you.
Sincerely,
Przemyslaw Radomski, CFA
Founder, Editor-in-chief, Gold & Silver Fund Manager
Gold & Silver Trading Alerts
Forex Trading Alerts
Oil Investment Updates
Oil Trading Alerts

