

Briefly: in our opinion, full (250% of the regular size of the position) speculative short positions in gold, silver and mining stocks are justified from the risk/reward perspective at the moment of publishing this alert.
Today’s introductory paragraph seems unnecessary. We all saw how significant yesterday’s rally in the mining stocks was. Quite a lot happened, but did as much change? Today’s Alert will feature multiple mining-stock related charts in order to provide the most complete mining stock analysis possible. We’ll discuss a few other important issues as well.
Let’s jump right into charts (charts courtesy of http://stockcharts.com).
Rallying vs. Pausing Gold Stocks
From the day-to-day point of view the above title doesn’t seem to have any sense. It’s obvious that gold miners rallied. But, the medium-term perspective is more important than the short-term one. And the long-term point of view is the key to keep in mind. That’s why we’ll start with the latter.
Looking at the above chart, one might ask:
- What rally?
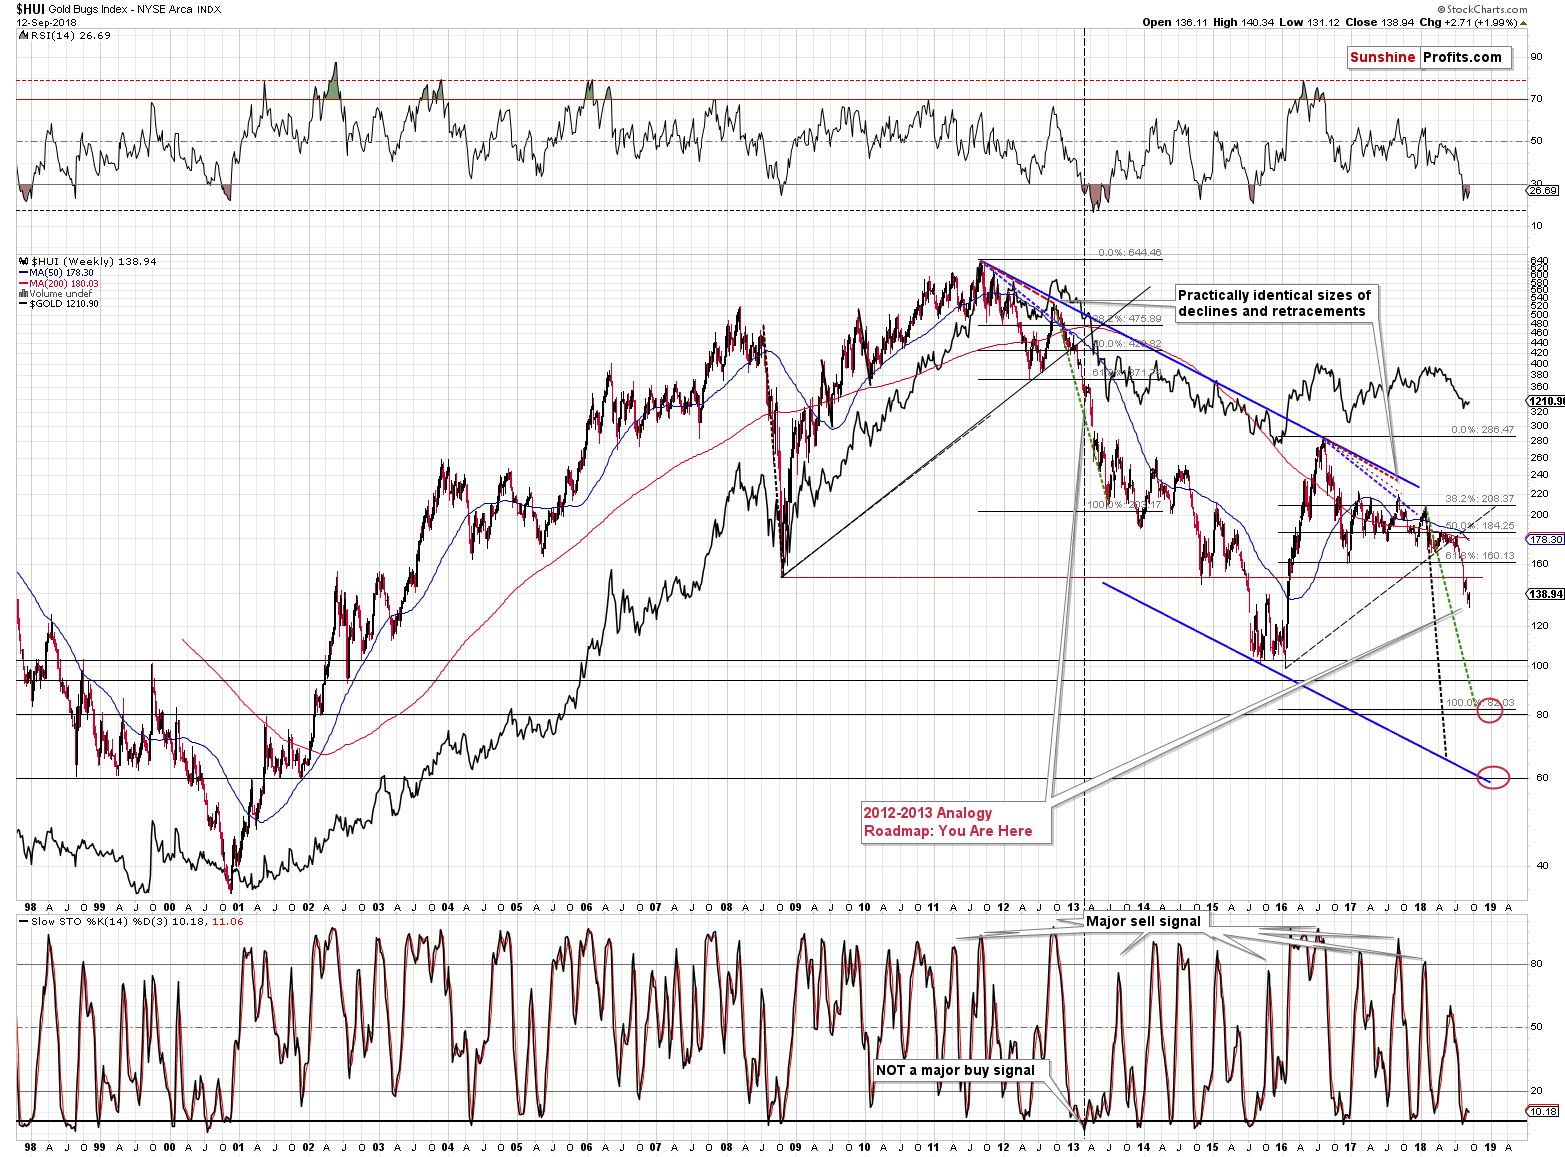
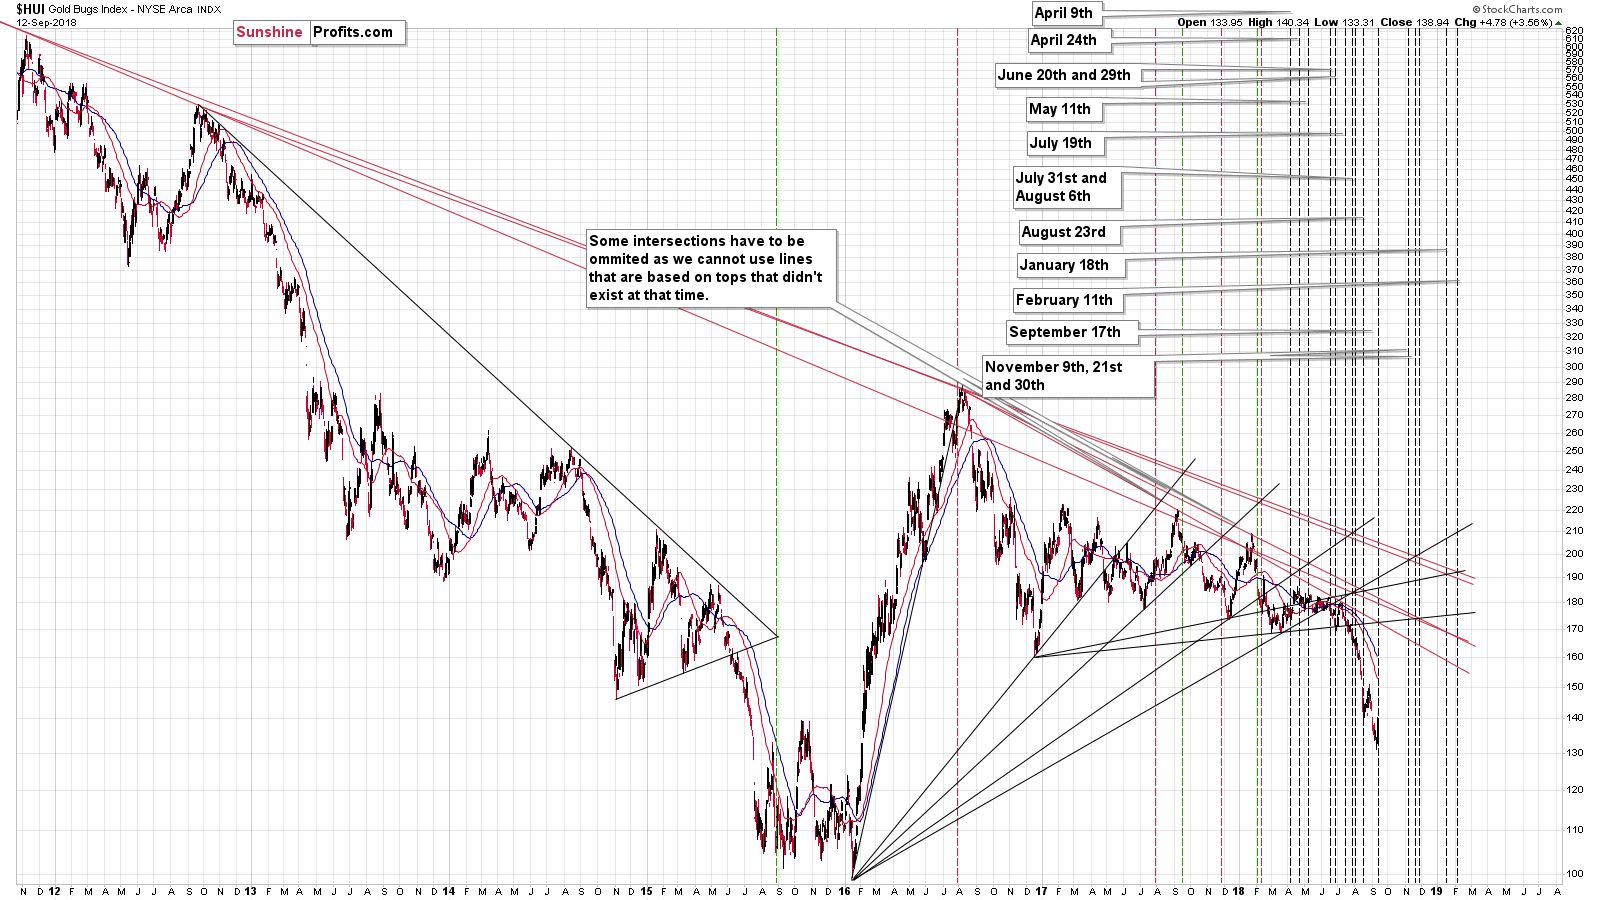
It’s not visible from this perspective. Instead we see that gold miners are after (and most likely within) a powerful decline that remains similar to the decline that we saw in 2012 and 2013. There are many things that we can say about the similarity and why it exists, but we want to finish writing this Alert today and we have many additional factors to discuss, so let’s focus on the breakdown below the rising support lines.
The 2016 – 2018 one is marked with a rising dashed line and the 2008 – 2013 one is marked with a solid black line. We also copied the current dashed line into the 2008 – 2013 line to show how similar they are. In early 2013, gold miners broke below this line and they moved lower in a decisive manner, but that doesn’t mean that there were no pauses and corrections along the way. In fact, there were two brief corrections before the biggest short-term plunge in the prices of mining stocks and the underlying precious metals.
Please take a look at the vertical dashed line. It corresponds to the weekly RSI a bit below 30 and to the moment when the Stochastic indicator flashed a long-term buy signal (albeit a fake one) after moving below 10.
It should look familiar, because that’s exactly what we have right now in both: RSI and Stochastic. And the current pause is the second one after the breakdown below the rising long-term support line. Consequently, it seems that we are not in the early days of a new rally, but we have the final pause before the biggest slide of the year.
The above analogy can be seen also when we zoom in – there are additional confirmations.
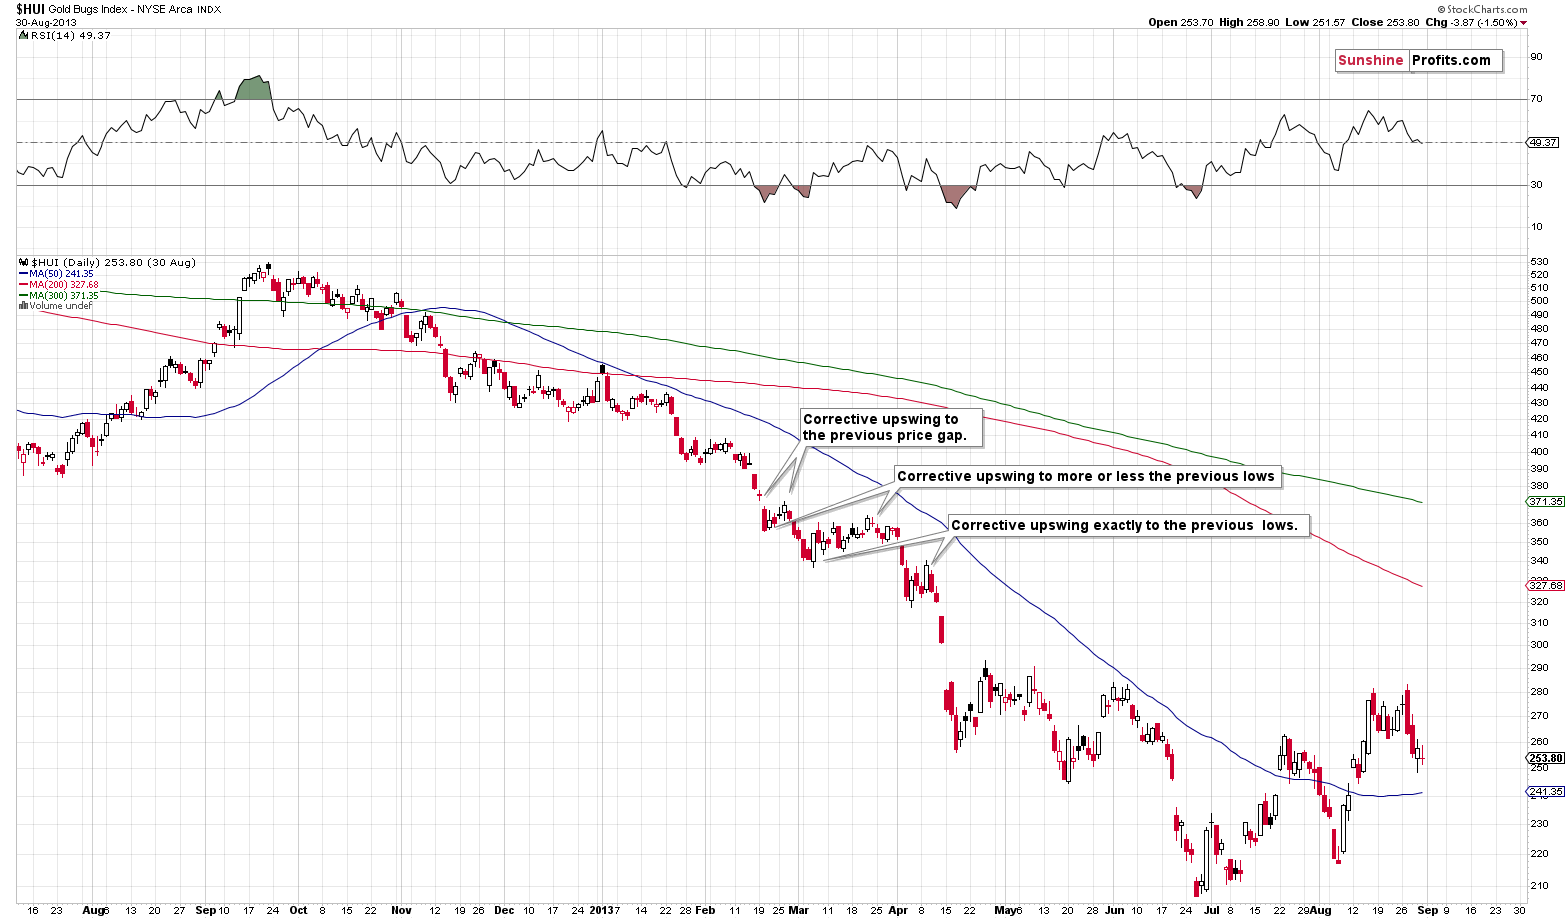
Let’s take a look at what we saw in 2013.
And now let’s take a look at what we have right now.
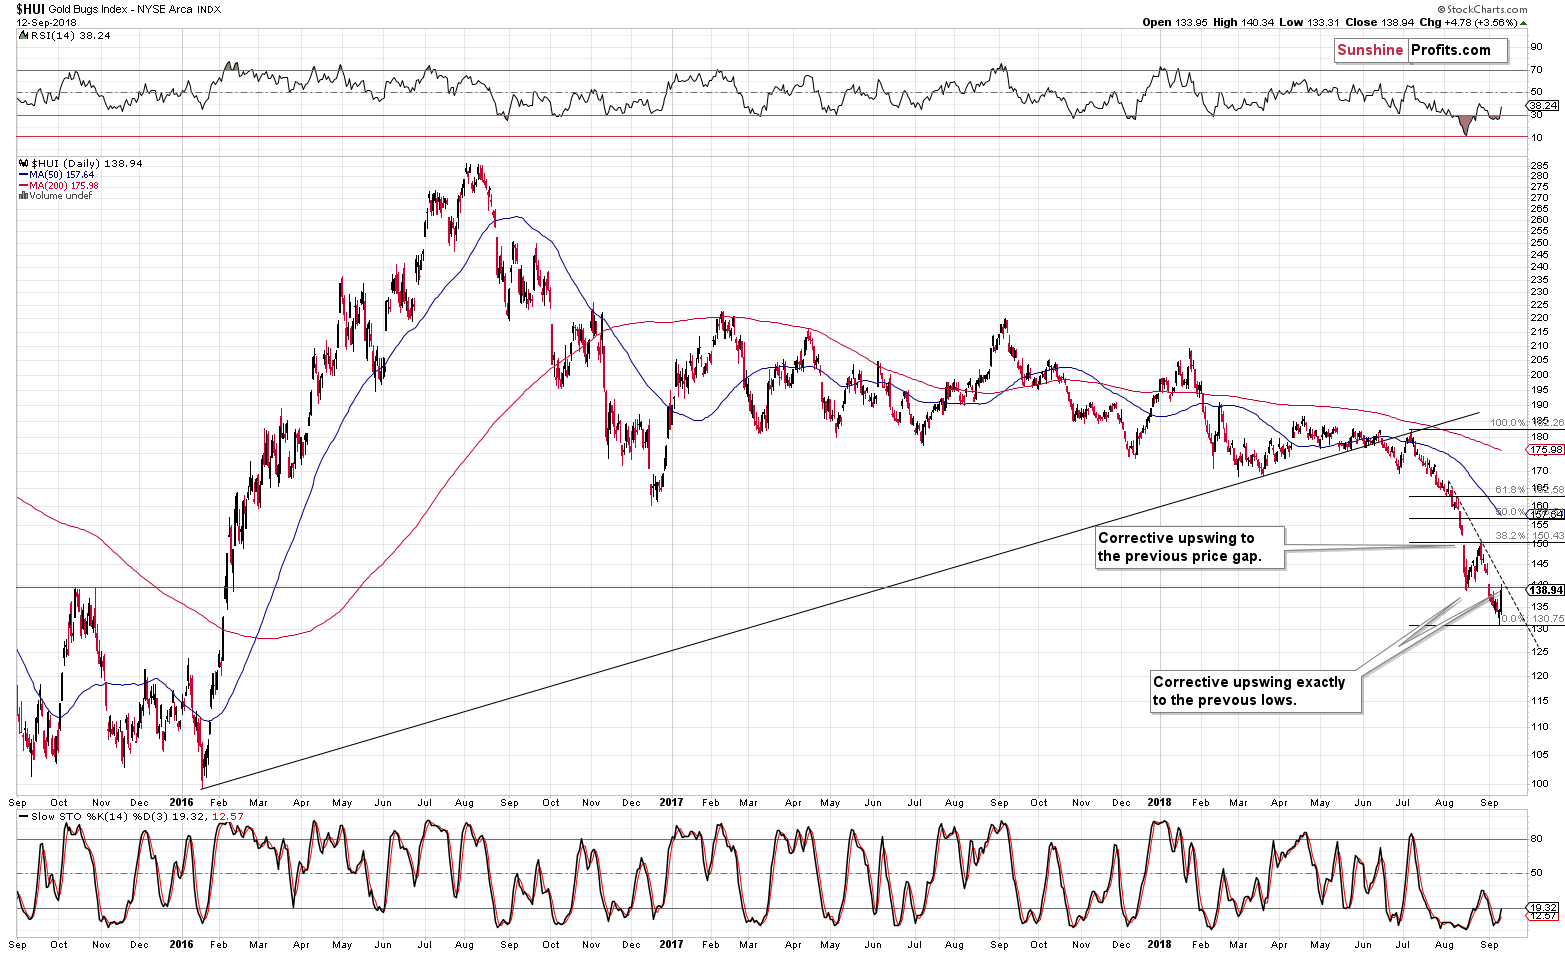
In both cases, the decline got ahead of itself and formed a price gap. We saw that in mid-February 2013 and in mid-August 2018. Then, in both cases, the HUI Index moved back up, to the lower border of the price gap and verified this level as technical resistance by declining shortly thereafter.
Then we saw more declines in both cases. In each case, gold stocks moved back up to the previous low and verified it as resistance. In 2013, there were two such corrections and the precious metals sector plunged right after the more volatile and more exact verification of the previous bottom. There’s no doubt that yesterday’s rally was volatile and that it moved to the previous bottom with great precision.
Moreover, while the rally seemed sizable, it didn’t actually take the miners above any major resistance line or level. The HUI Index ended yesterday’s session below the late 2015 highs, below the mid-August 2018 bottom, and below the declining dashed resistance line.
Although it seems that a lot happened yesterday, actually barely anything happened. And even less changed. The “Smoke and Mirrors Award of 2018” goes to gold stocks’ September the 12th rally.
The history seems to be repeating itself and it seems very likely that we are just before a big price plunge in the values of gold stocks.
And silver stocks.
Silver Miners’ Correction
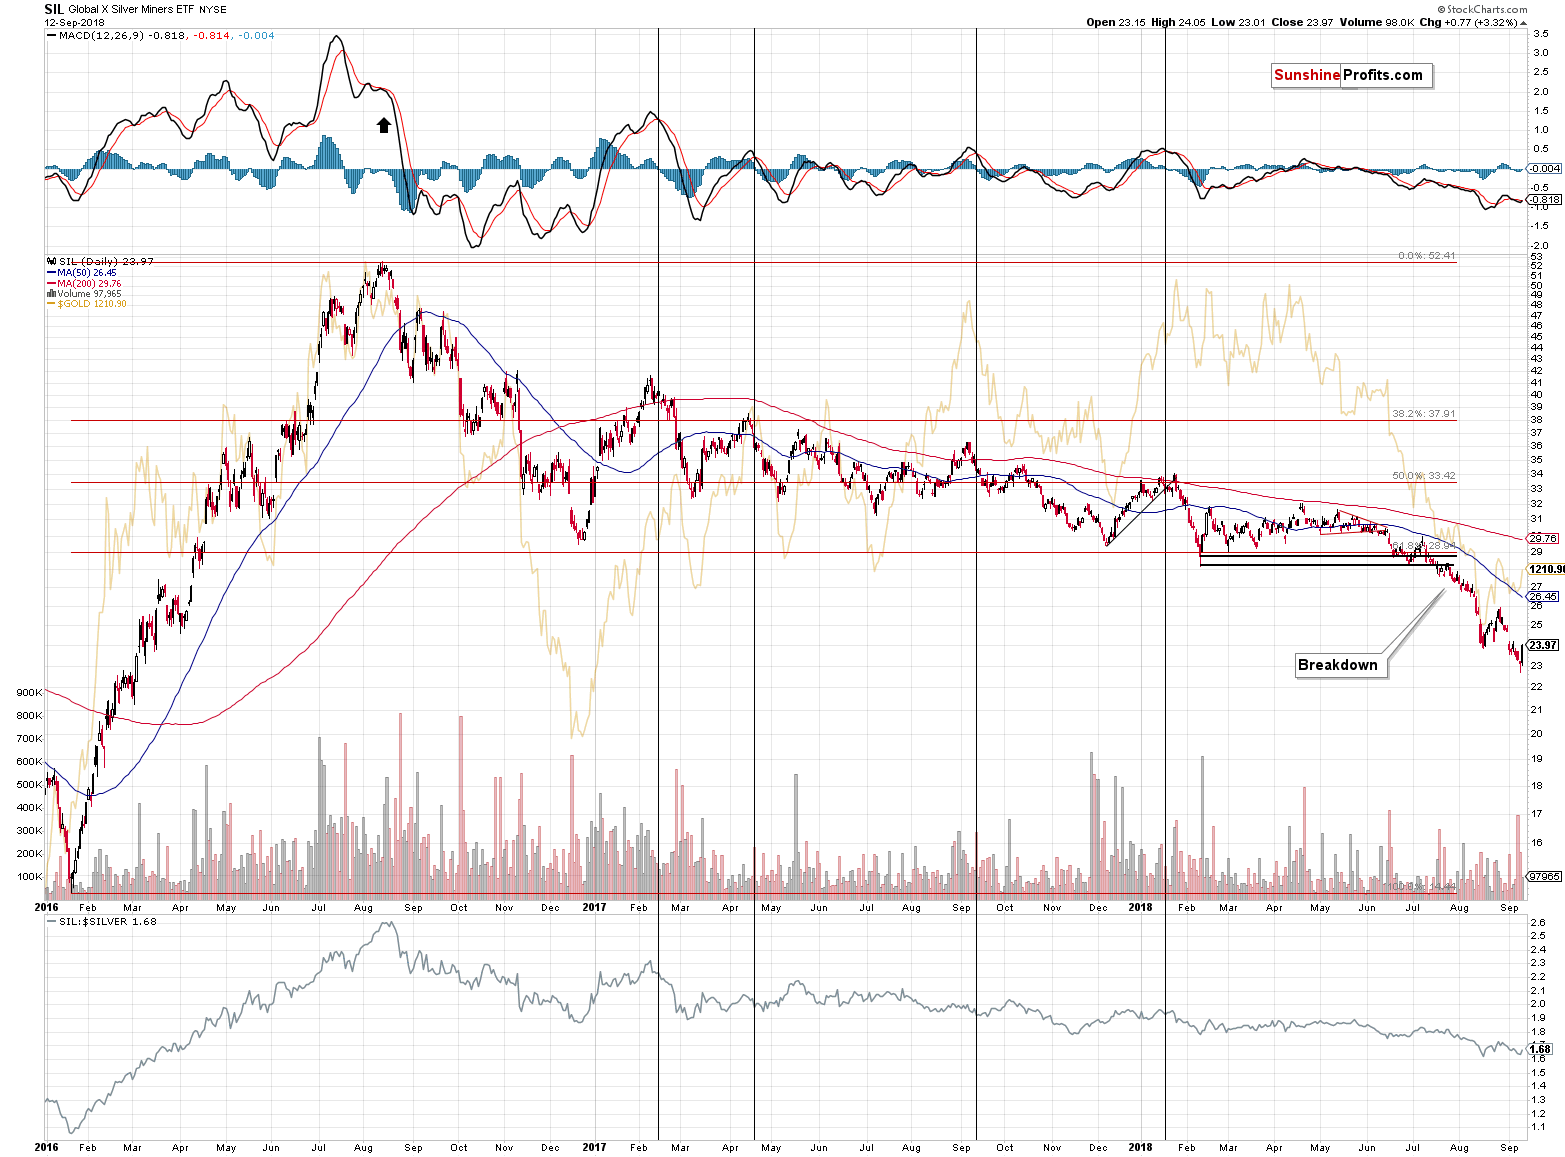
There was nothing extraordinary in yesterday’s performance of the silver miners. They moved back up to their previous bottom and the corresponding volume was nothing to call home about. It appears to be a classic verification of a breakdown. The bullish implications are absent.
Mining Stock Ratios
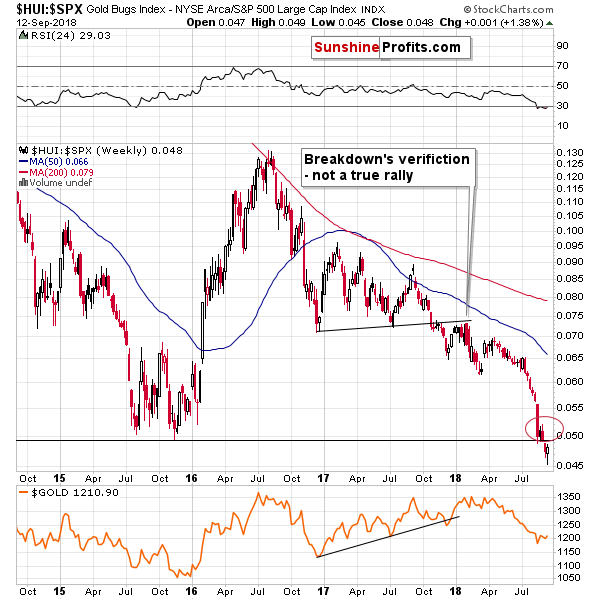
We previously commented on the breakdown in the gold stock to other stocks (general stock market measured by the S&P 500 Index) ratio. We wrote that it has strongly bearish implications for the following weeks. The important thing is that yesterday’s upswing in the HUI Index didn’t cause the ratio to invalidate its previous breakdown. This means that nothing really changed from this perspective and the bearish implications remain up-to-date.
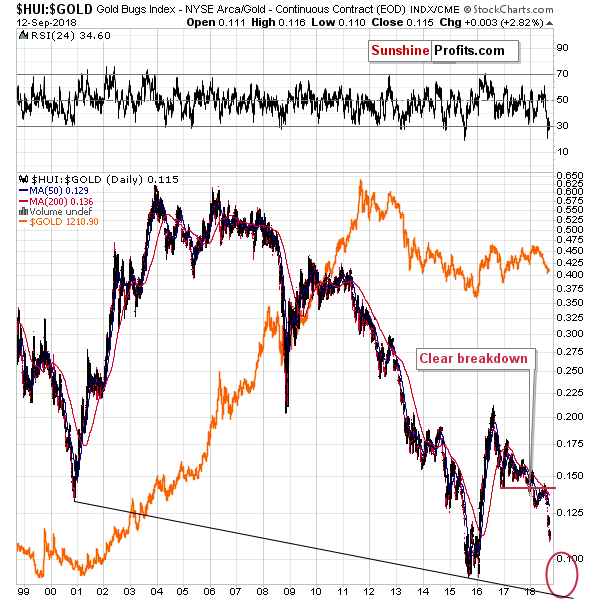
There’s nothing new that we can say about the gold stocks to gold ratio either. Yesterday’s upswing is practically not visible on the long-term chart, while the decline is.
Yes, the RSI moved below 30, but that was the case also in 2013 during the decline and before its biggest and most volatile part.
The bearish implications of the verified breakdown below the late-2016 remain up-to-date.
Reversal Reminder
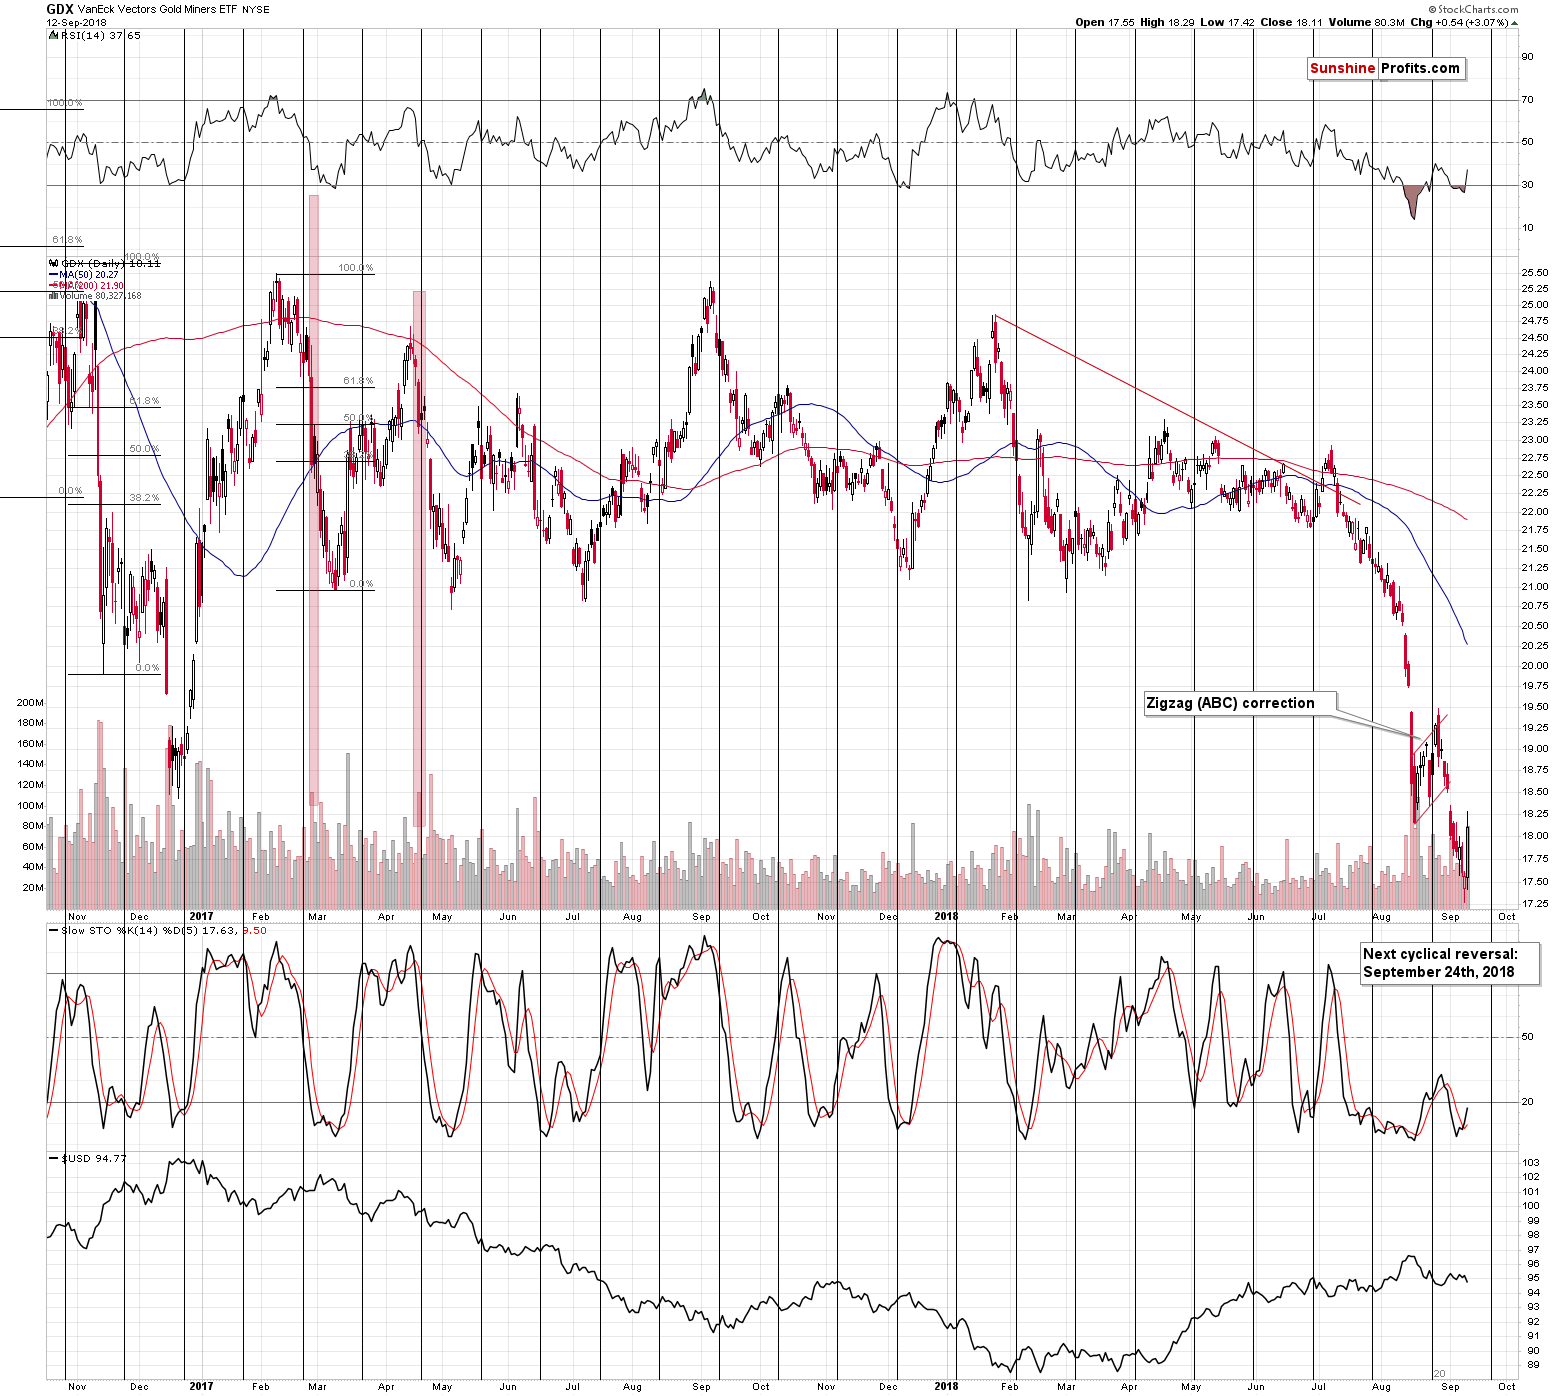
Before moving to other markets, we would like to remind you about the upcoming cyclical turning point in the GDX ETF – it’s in 2.5 weeks’ time, on September the 24th. Based on the analogy to 2013, the rally in the mining stocks may already be over, or it’s end could be at hand. Consequently, the next cyclical turning point may correspond to the next major bottom, not a top. Yes, it’s very close and miners just rallied, but these are special and very volatile times and early-August decline proved it. In less than 2 weeks miners could be much lower than they are today – possibly at their 2016 bottom (at least in case of the HUI Index).
Having said that, let’s take a look at gold.
Gold’s Breakout and Breakdowns
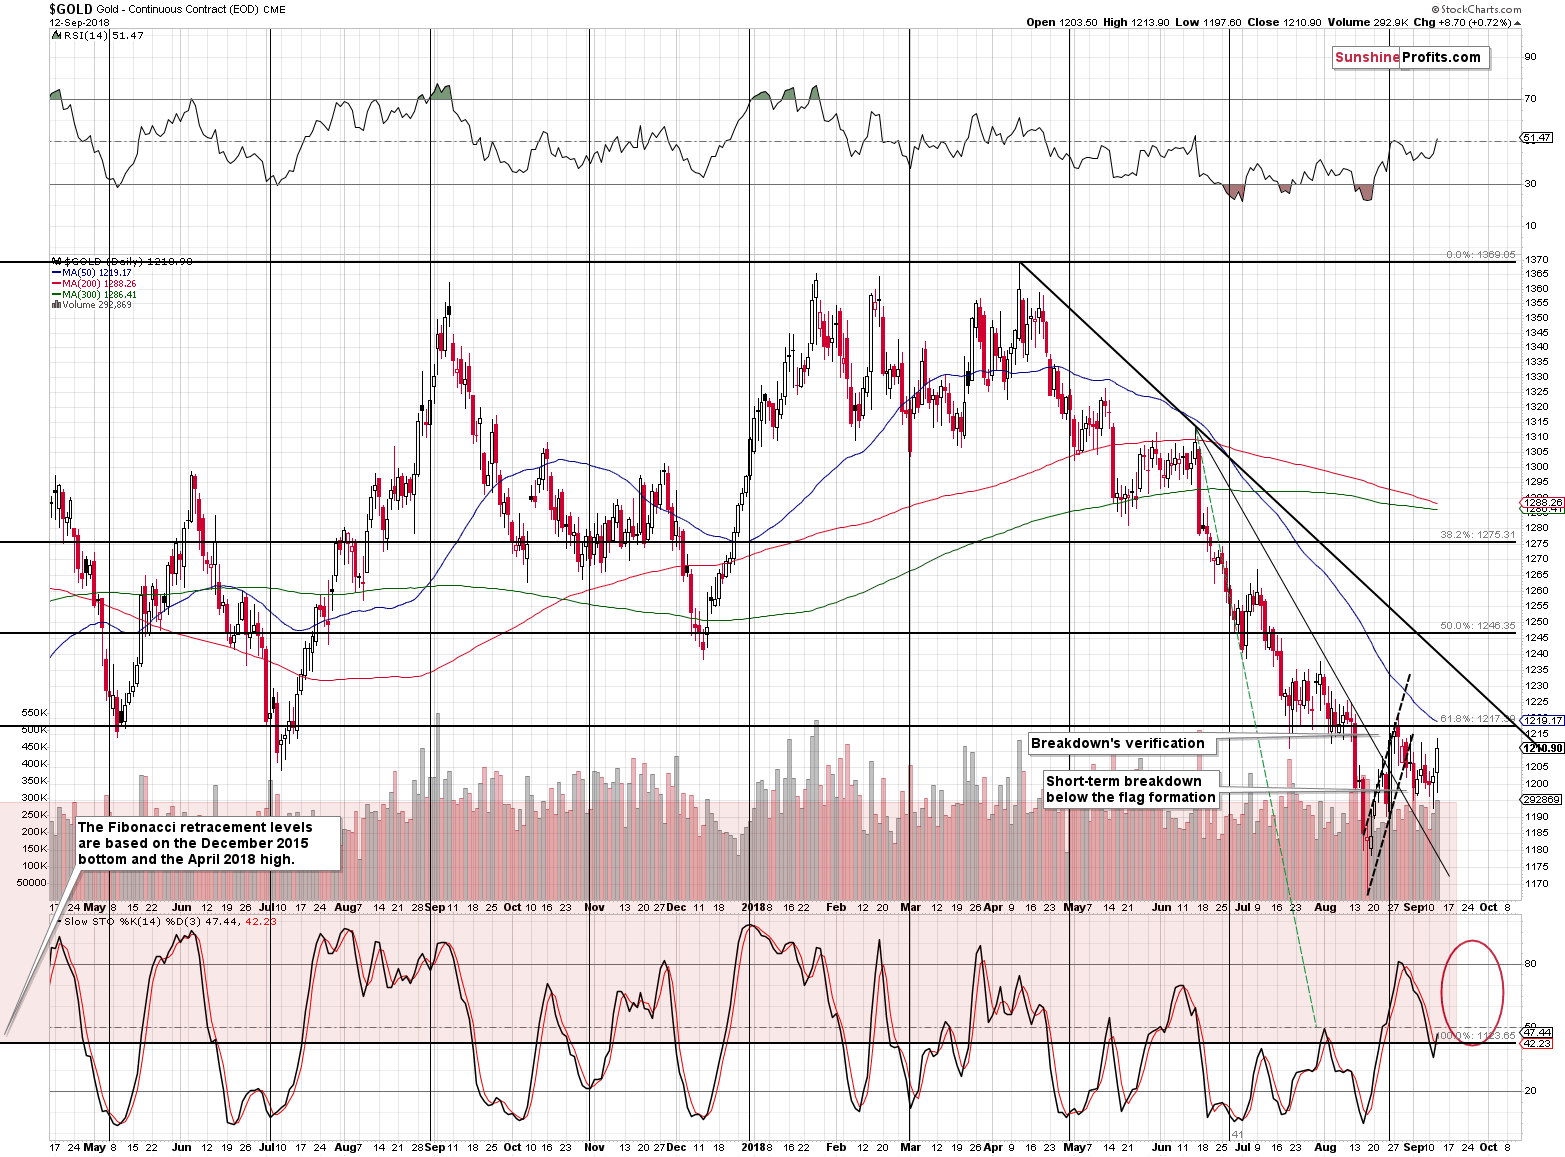
The yellow metals moved above the declining thin black line and verified this breakout, but that’s the end of the bullish signs that we can see on the above chart. Even the RSI is above 50, showing that gold is not oversold from the short-term point of view. Conversely, it’s ready to move again.
While gold moved above the declining thin black line, it didn’t move back above the declining thick black line (based on more important tops, thus more important than resistance), above the 61.8% Fibonacci retracement based on the December 2015 – April 2018 rally, and it remains below the July and early-August lows.
Moreover, gold is after the breakdown below the flag pattern and since the moves that follow the flags tend to be similar to the ones that preceded it, the implications are bearish.
The same goes for the current implications of the situation in the gold to silver ratio. Our yesterday’s comments on it remain up-to-date:
Nothing Changed in the Gold:Silver Ratio
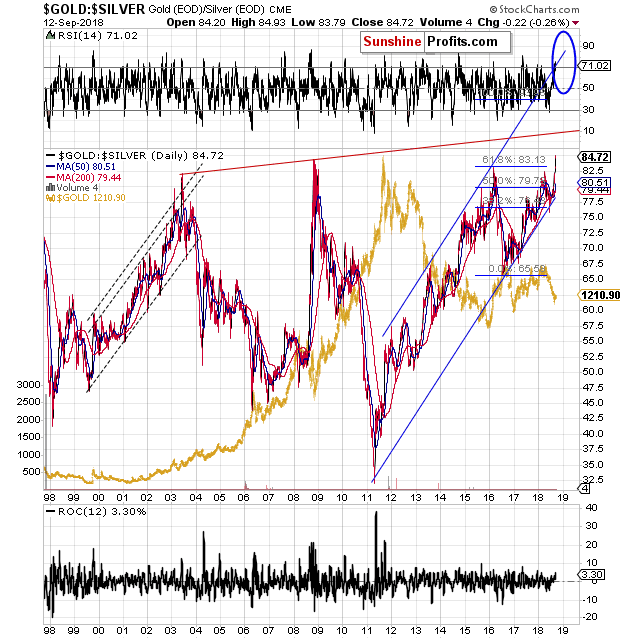
The gold to silver ratio broke above the 2003, 2008, and 2016 highs and it didn’t move back below them. In this case, “nothing” means that the breakout is being verified and with each passing day when the ratio is above the previous highs, the continuation of the rally becomes more and more probable.
Moreover, since the rallies in the ratio tend to be sharp, it means that we can expect the continuation of the move that’s very visible. This most likely means a big decline in silver.
In yesterday’s Alert we also wrote the following on silver:
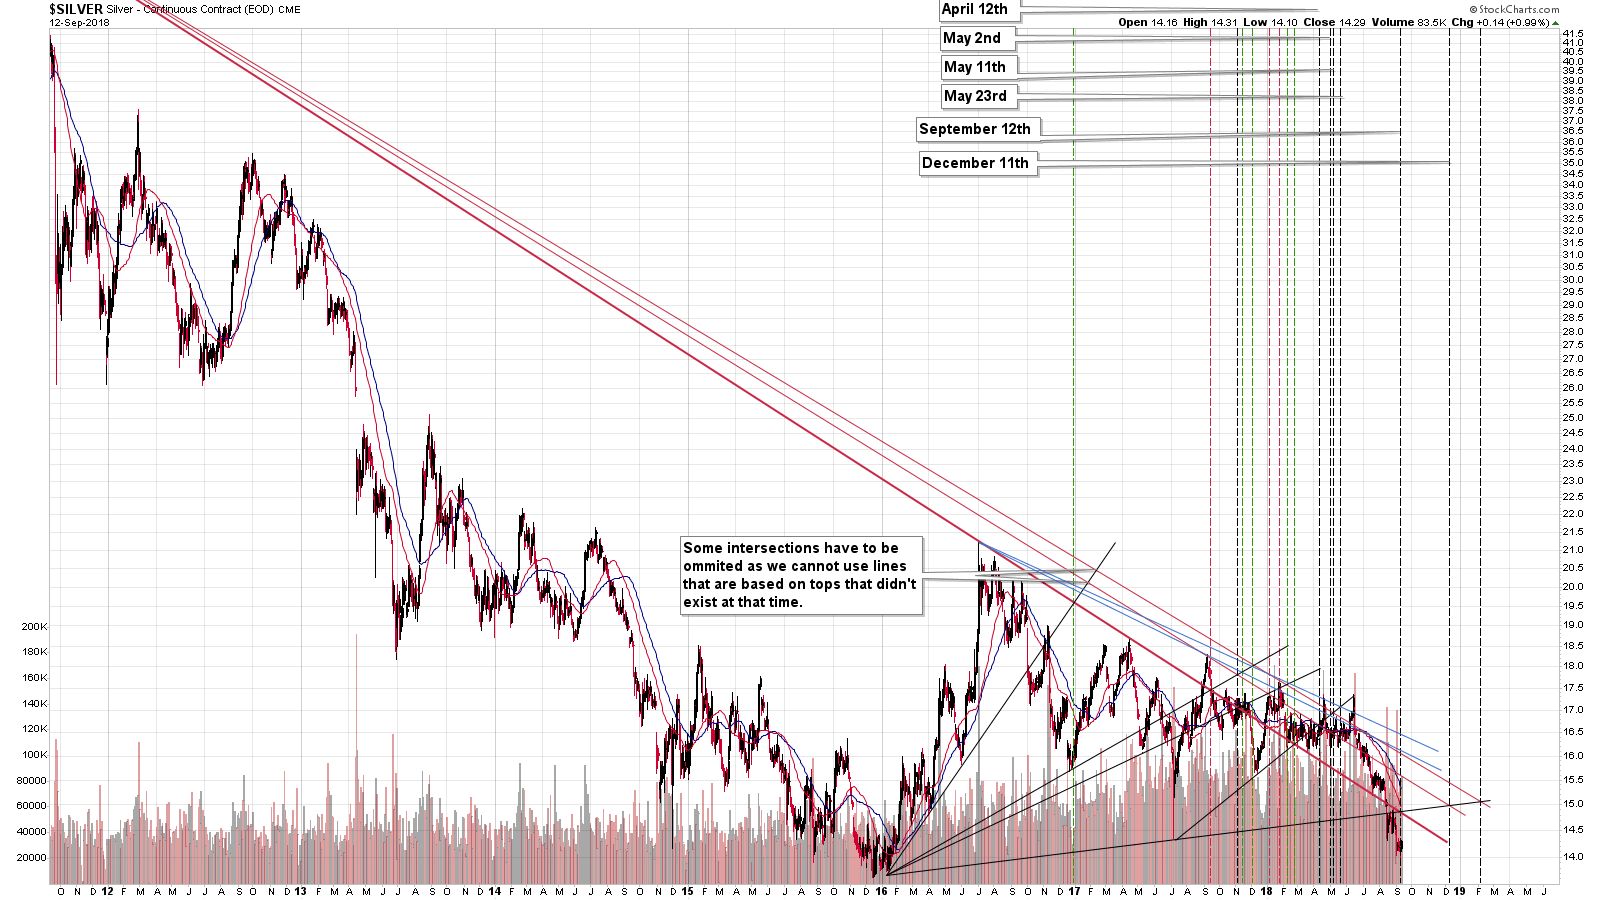
No Changes in Silver
And by saying “no changes”, we mean practically no changes in terms of the daily closing prices. Silver moves back and forth on an intraday basis, but ultimately it still ends the session at about $14.15 - $14.20. At least that’s what we saw in the last 5 sessions.
That’s interesting, because this decline (and many other declines) are characterized by periods of very high volatility that are followed by periods of very low volatility and then the cycle repeats, with no “average volatility” weeks. The pauses that we saw previously took place in early July, late July and early August and then in late August (ok, in case of the latter the volatility was higher than previously).
Taking the above 3 cases into account, we see a very specific pattern. The lower the volatility before the move, the bigger the volatility during the move i.e. the more profound the decline is.
The biggest decline took place just before the middle of August and the back and forth movement that preceded it was the calmest period in many weeks and months. The only case when silver was calmer is… right now. Consequently, we may be just before the biggest short-term decline of 2018. And perhaps of the decade.
Still, knowing how silver likes to provide fake signals just before big declines, we wouldn’t be surprised to see a one final upswing that will get people unnecessarily excited. So, even if we see a sudden $0.50 rally shortly, it will not be a bullish signal by itself. Conversely, if such a move was accompanied by weak mining stock performance, it would be a perfect bearish confirmation. Naturally, such a brief rally is not something that we expect to see, but if it happened, it would not be surprising – it would be within the definition of “normal” in case of silver and its declines.
The thing that we would like to add today is that we might have just seen the fake rally that we outlined yesterday. Silver didn’t outperform gold to great extent, but this is odd only if we forget about the situation in the gold to silver ratio. The latter is after a major breakdown, which means that it’s likely to rally further. This means that silver is likely to underperform. Consequently, it could be this technical development in the gold to silver ratio that prevented silver from soaring higher yesterday. The final implications is that PMs could decline shortly even without a prior short-term outperformance of silver.
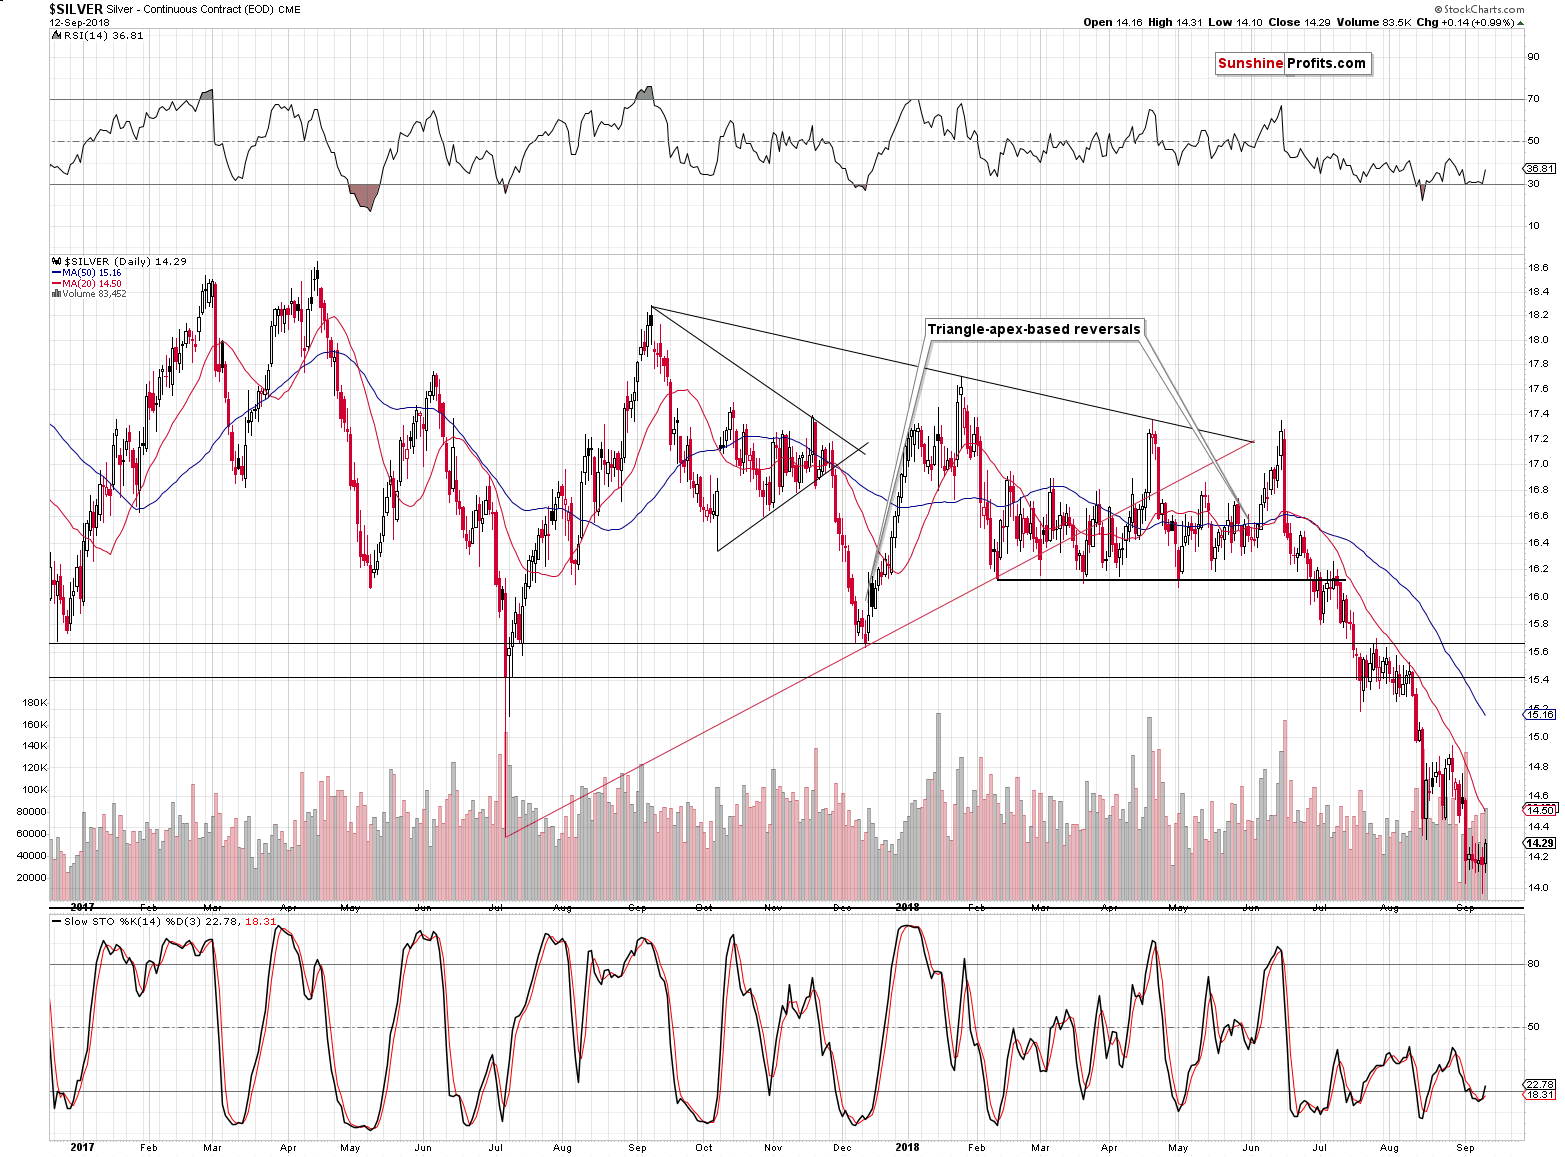
Triangle-based Reversals
In yesterday’s intraday Alert, we wrote the following:
Today is silver’s triangle-vertex-based reversal and the analogous reversal for mining stocks is at hand. Consequently, seeing a corrective upswing here is not surprising. Of course, it doesn’t mean that it was worth exiting the short positions and/or going long. Given multiple strong bearish signals it seems much better to stay short as any corrective upswing can be reversed in a matter of hours or minutes.
Surely, it might seem to be a good idea to exit the short position, cash in the profits and go long, but when would one re-enter the short position? $0.10 higher in case of silver? $0.30 higher? What if silver opens $0.70 lower tomorrow? This is precisely the time in the precious metals market when things like that could happen - especially given the critical breakout in the gold to silver ratio.
The above remains up-to-date – we saw the reversals, so technically the technique worked once again, but it didn’t change the bigger picture. The bigger trend remains bearish and the really big surprises are still likely to be to the downside.
You might be wondering, what’s the point of creating the reversals if we are not going to act on them anyway. The reply is that just because we notice something, it doesn’t mean that we absolutely have to act on it. By being aware of something, we are able to take it into account along with other factors. It’s just like a financial option – you have the right, but no obligation to use the signal and act on it.
Moreover, if one didn’t know about the reversals, one might have thought that something exceptional happened yesterday and that miners strength reflected something more than just a previous technical indication. By being aware of multiple signals, we can view them from the broader perspective and make much more informed decisions than those who take into account only a few factors (like the price of gold, CoT report values, and some fundamental information). On a side note, please note that despite CoT’s “critical readings” that we discussed in late August, gold is currently lower than it was when the “critical signals” were seen, even taking into account yesterday’s upswing.
As far as the USD Index is concerned, we wrote the following yesterday:
Still No Changes in the USD Index
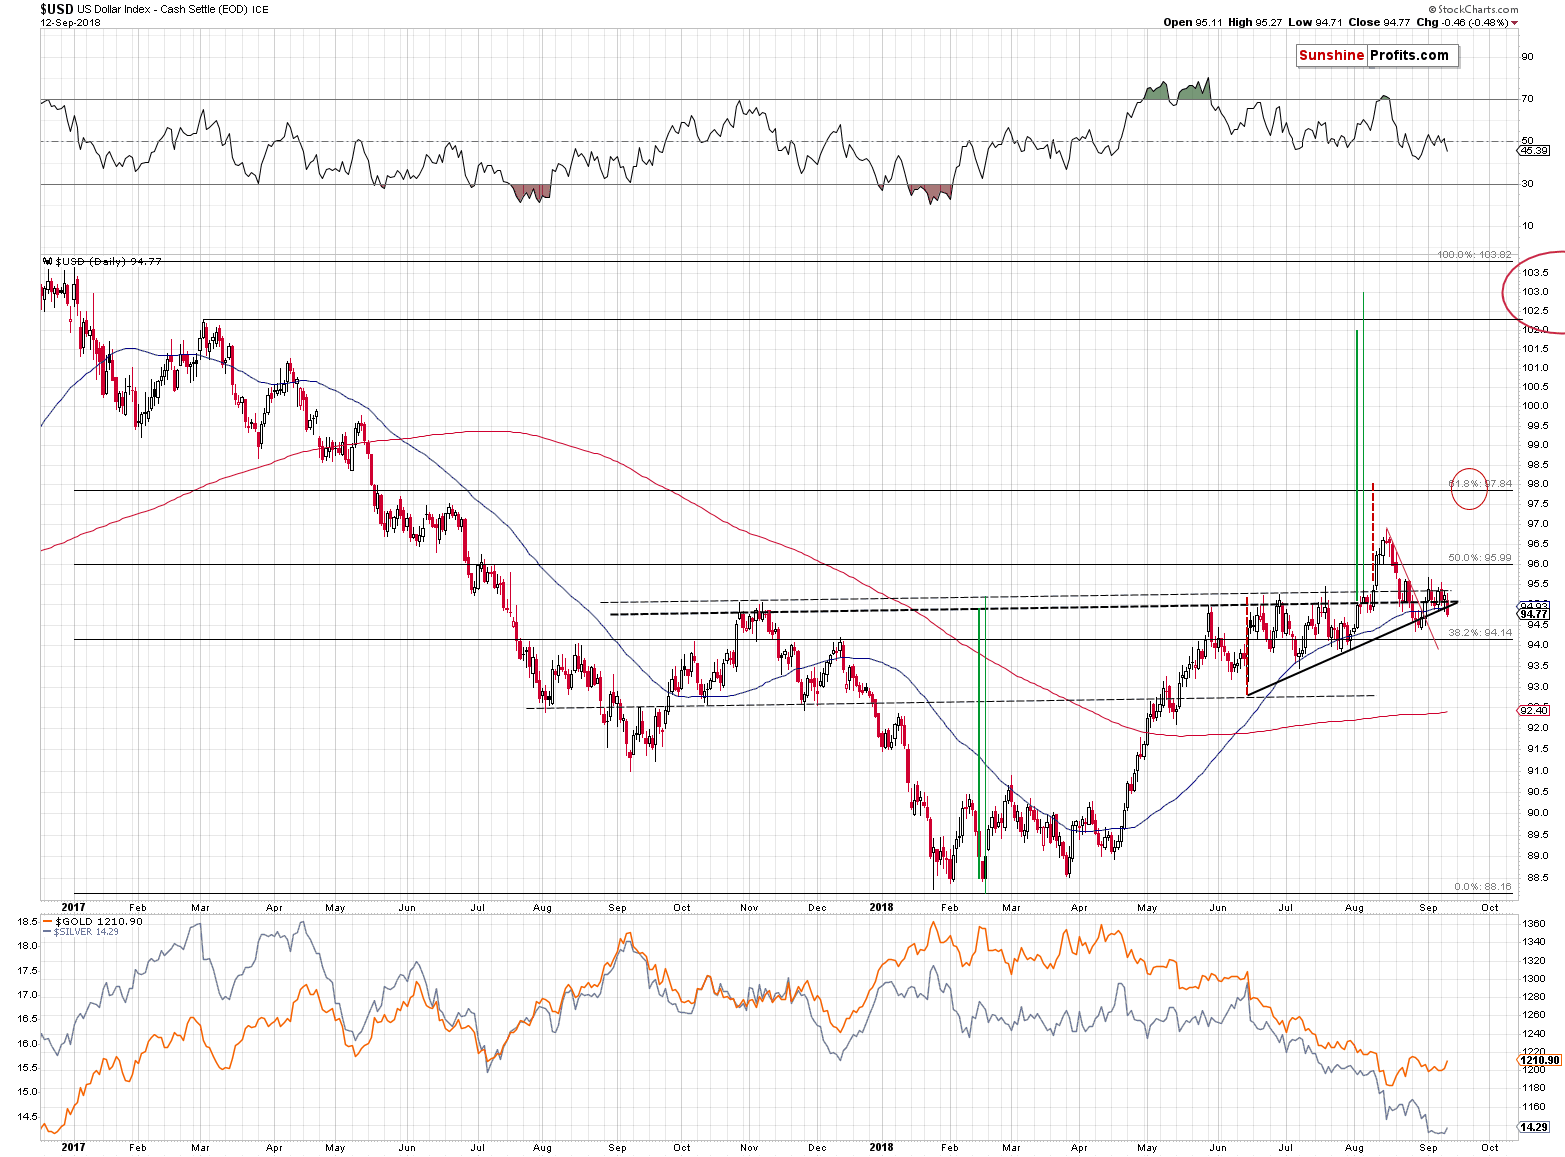
Finally, we would like to emphasize that nothing really happened in case of the USD Index. It continues to trade back and forth above the neck level of the reverse head-and-shoulders formation. The formation is therefore active and has profoundly bullish implications. It indicates a move to 102 – 103, which will likely trigger a huge decline in the precious metals sector. As we discussed on Monday, there are multiple other factors that point to the massive decline in the PMs and the situation in the USDX simply confirms them.
The only change that we saw yesterday, was a small move below the rising black support line. The breakdown was small and it’s not confirmed. Since we already saw a similar small move below this line, which was quickly followed by an invalidation and a powerful slide in the PMs (especially in silver and mining stocks), we strongly doubt the bearish implications of the current breakdown.
Target Prices vs. Exit Prices
We would like to take this opportunity to discuss the differences between target prices, initial target prices, and exit prices. In our analyses we usually mention target prices, but in the “trading capital” part of the summary, we usually mention either initial target prices, or (like we do currently) exit prices.
- Target prices
These are the prices that we refer to when we discuss the charts and these targets are usually provided on a more-or-less basis. For instance, the HUI Index is likely to move to its 2015-2016 lows. There were several local lows, with the lowest of them being a bit below 100. Even when we don’t write about the target prices, you can still see them on the charts. We almost always mark them with red ellipses (we sometimes use different color or shape, though). As the time goes by and new information becomes available, we keep updating these targets. All in all, the targets are what we provide in order to make it easier to understand our outlook.
But, these are not the prices that we want to put on the trading platforms. Why? Because if a target is missed by just a little, we will still say that it was approximately reached and it could have some implications, but at the same time, it will not mean that one has established or exited a trading / investment position. In case of real trades, it’s critical to place orders at the price levels that also provide very good probability of filling the trade. Naturally, entering / exiting a given position without waiting (right away, with a market order) would result in an immediate fill, but the price would not be favorable.
There is a trade-off between how good entry/exit price one can get, and the chance of the trade being filled. That why the initial price targets and exit price levels are usually a bit different than what we refer to in the analysis – in order to increase the chance of filling the trade.
- Initial target prices
That’s one of the types of targets that we look for to either enter or exit our trading / investment positions. “Initial” means that just because this price level is reached, we will not automatically (!) enter or exit a given trade. It means that at this price we are likely to do so, but we first want to take a good look at the market, corresponding markets, ratios etc. If, after examining the above, making adjustments in the trade appears justified, we write about it in the Alert, either in a regular Alert, or in the intraday Alert. After all, we sometimes make the decisions during the session, and sometimes between sessions. On a side note, it may appear that trades discussed in the regular Alerts are less timely, but there was a study on the efficiency of trades and it turned out that those that are determined outside of the session have overall greater rates of return. So, at times, it’s better to have more time to examine the situation.
- Exit price levels
That’s the second of the types of targets that we look for to either enter or exit our trading / investment positions. This is “not initial”, but final. This is what we find justified to be placed on the trading platform, as reaching these price levels should automatically (!) enter / exit a given trade.
We usually use these levels when we already see confirmations from other markets, ratios etc., but we’re waiting on a specific price level being reached. In such case, it makes no sense to revalue the market environment once the price reaches the exit level – it’s time to act.
At times – for instance right now – we use the exit price levels for something special. Namely, we use them to prepare for an event that’s not extremely likely to take place, but if it does, we want the action to be taken automatically, as it could happen overnight, or very quickly on an intraday basis.
We currently have the exit orders in place, so that in the event of a quick drop to the 2015 bottom in gold or mining stocks, and lower price levels in silver, we will be taken out of the short positions, with huge profits being secured. Why? Because these are the levels that are likely to generate a quick comeback. We may or may not choose to open long positions at that time, but we’ll prefer to check the market manually before we do. Still, as far as securing profits is concerned, we think that it should be done automatically. We then plan to re-enter the short positions at higher prices and then once again profit on what’s likely to be the final price slide leading to THE bottom. At least that’s what seems to be the most likely outcome today. You can read more about this particular strategy in our August 1 Gold & Silver Trading Alert.
Important Analyses
Before summarizing, we would like to emphasize that we have recently posted several analyses that are very important and that one should keep in mind, especially in the next several weeks. If you haven’t had the chance of reading them previously, we encourage you to do so today:
- Dear Gold Investor - Letters from 2013 - Analogy to 2013, which should make it easier to trade the upcoming sizable upswing (if enough factors point to it, that is) and to enter the market close to the final bottom.
- Gold to Soar Above $6,000 - discussion of gold’s long-term upside target of $6,000.
- Preparing for THE Bottom in Gold: Part 6 – What to Buy - extremely important analysis of the portfolio structure for the next huge, multi-year rally in the precious metals.
- Preparing for THE Bottom in Gold: Part 7 – Buy-and-hold on Steroids – description of a strategy dedicated to significantly boosting one’s long-term investment returns while staying invested in the PM sector.
- Gold’s Downside Target, Upcoming Rebound, and Miners’ Buy Plan - details regarding the shape of the following price moves, a buying plan for mining stocks, and a brief discussion of the final price targets for the current decline.
- Gold: What Happened vs. What Changed – discussion of the latest extreme readings from gold’s CoT report
- Key Factors for Gold & Silver Investors - discussion of key, long-term factors that support the bearish outlook for PMs. We are often asked what makes us so bearish – this article is a reply to this question.
- The Upcoming Silver Surprise – two sets of price targets for gold, silver and mining stocks: the initial and the final one.
Summary
Summing up, yesterday’s upswing in the mining stocks seemed like a bullish development, but it made the very bearish analogy to the 2012-2013 decline even stronger. Nothing really changed from the technical point of view and the outlook remains very bearish. The move lower is likely to be sharp and the profits on the current short position are likely to change from being huge to being enormous and then finally to being ridiculous.
As far as today's early trading (first 30 minutes of today's session) is concerned, the quick reversal that we see in HUI and GDX has bearish implications, especially that the USD Index moved lower. We expect the USDX to rally in the following weeks, days, and perhaps hours, and the opposite seems very likely for the precious metals sector.
As always, we’ll keep you – our subscribers – informed.
To summarize:
Trading capital (supplementary part of the portfolio; our opinion): Full short positions (250% of the full position) in gold, silver and mining stocks are justified from the risk/reward perspective with the following stop-loss orders and exit profit-take price levels:
- Gold: profit-take exit price: $1,062; stop-loss: $1,226; initial target price for the DGLD ETN: $82.96; stop-loss for the DGLD ETN $53.67
- Silver: profit-take exit price: $12.72; stop-loss: $15.16; initial target price for the DSLV ETN: $46.97; stop-loss for the DSLV ETN $31.37
- Mining stocks (price levels for the GDX ETF): profit-take exit price: $13.12; stop-loss: $19.61; initial target price for the DUST ETF: $80.97; stop-loss for the DUST ETF $33.37
Note: the above is a specific preparation for a possible sudden price drop, it does not reflect the most likely outcome. You will find a more detailed explanation in our August 1 Alert. In case one wants to bet on junior mining stocks’ prices (we do not suggest doing so – we think senior mining stocks are more predictable in the case of short-term trades – if one wants to do it anyway, we provide the details), here are the stop-loss details and target prices:
- GDXJ ETF: profit-take exit price: $17.52; stop-loss: $29.43
- JDST ETF: initial target price: $154.97 stop-loss: $64.88
Long-term capital (core part of the portfolio; our opinion): No positions (in other words: cash)
Insurance capital (core part of the portfolio; our opinion): Full position
Important Details for New Subscribers
Whether you already subscribed or not, we encourage you to find out how to make the most of our alerts and read our replies to the most common alert-and-gold-trading-related-questions.
Please note that the in the trading section we describe the situation for the day that the alert is posted. In other words, it we are writing about a speculative position, it means that it is up-to-date on the day it was posted. We are also featuring the initial target prices, so that you can decide whether keeping a position on a given day is something that is in tune with your approach (some moves are too small for medium-term traders and some might appear too big for day-traders).
Plus, you might want to read why our stop-loss orders are usually relatively far from the current price.
Please note that a full position doesn’t mean using all of the capital for a given trade. You will find details on our thoughts on gold portfolio structuring in the Key Insights section on our website.
As a reminder – “initial target price” means exactly that – an “initial” one, it’s not a price level at which we suggest closing positions. If this becomes the case (like it did in the previous trade) we will refer to these levels as levels of exit orders (exactly as we’ve done previously). Stop-loss levels, however, are naturally not “initial”, but something that, in our opinion, might be entered as an order.
Since it is impossible to synchronize target prices and stop-loss levels for all the ETFs and ETNs with the main markets that we provide these levels for (gold, silver and mining stocks – the GDX ETF), the stop-loss levels and target prices for other ETNs and ETF (among other: UGLD, DGLD, USLV, DSLV, NUGT, DUST, JNUG, JDST) are provided as supplementary, and not as “final”. This means that if a stop-loss or a target level is reached for any of the “additional instruments” (DGLD for instance), but not for the “main instrument” (gold in this case), we will view positions in both gold and DGLD as still open and the stop-loss for DGLD would have to be moved lower. On the other hand, if gold moves to a stop-loss level but DGLD doesn’t, then we will view both positions (in gold and DGLD) as closed. In other words, since it’s not possible to be 100% certain that each related instrument moves to a given level when the underlying instrument does, we can’t provide levels that would be binding. The levels that we do provide are our best estimate of the levels that will correspond to the levels in the underlying assets, but it will be the underlying assets that one will need to focus on regarding the signs pointing to closing a given position or keeping it open. We might adjust the levels in the “additional instruments” without adjusting the levels in the “main instruments”, which will simply mean that we have improved our estimation of these levels, not that we changed our outlook on the markets. We are already working on a tool that would update these levels on a daily basis for the most popular ETFs, ETNs and individual mining stocks.
Our preferred ways to invest in and to trade gold along with the reasoning can be found in the how to buy gold section. Additionally, our preferred ETFs and ETNs can be found in our Gold & Silver ETF Ranking.
As a reminder, Gold & Silver Trading Alerts are posted before or on each trading day (we usually post them before the opening bell, but we don't promise doing that each day). If there's anything urgent, we will send you an additional small alert before posting the main one.
=====
Latest Free Trading Alerts:
201,000. The August job gains is an impressive number, but 2.9 percent is even better. This is the annual jump in wages. How will it affect the gold market?
Will Annual Wage Gain Support Gold?
Wednesday's trading session was pretty uneventful, as investors continued to hesitate following the recent decline off the late August new record highs. The S&P 500 index remains slightly below the level of 2,900. Is this a topping pattern or just a pause before another leg up?
=====
Thank you.
Sincerely,
Przemyslaw Radomski, CFA
Founder, Editor-in-chief, Gold & Silver Fund Manager
Gold & Silver Trading Alerts
Forex Trading Alerts
Oil Investment Updates
Oil Trading Alerts

