

Briefly: in our opinion, full (100% of the regular position size) speculative long positions in junior mining stocks are justified from the risk/reward point of view at the moment of publishing this Alert.
And so, after taking profits from our short positions in them, we’re long juniors once again. We saw some bullish signals yesterday, and we also see them today. In fact, we have a few extra.
The most important reason behind the long position – on top of what I wrote yesterday – is the strength that gold currently shows relative to what’s happening in the USD Index.
The latter is soaring.
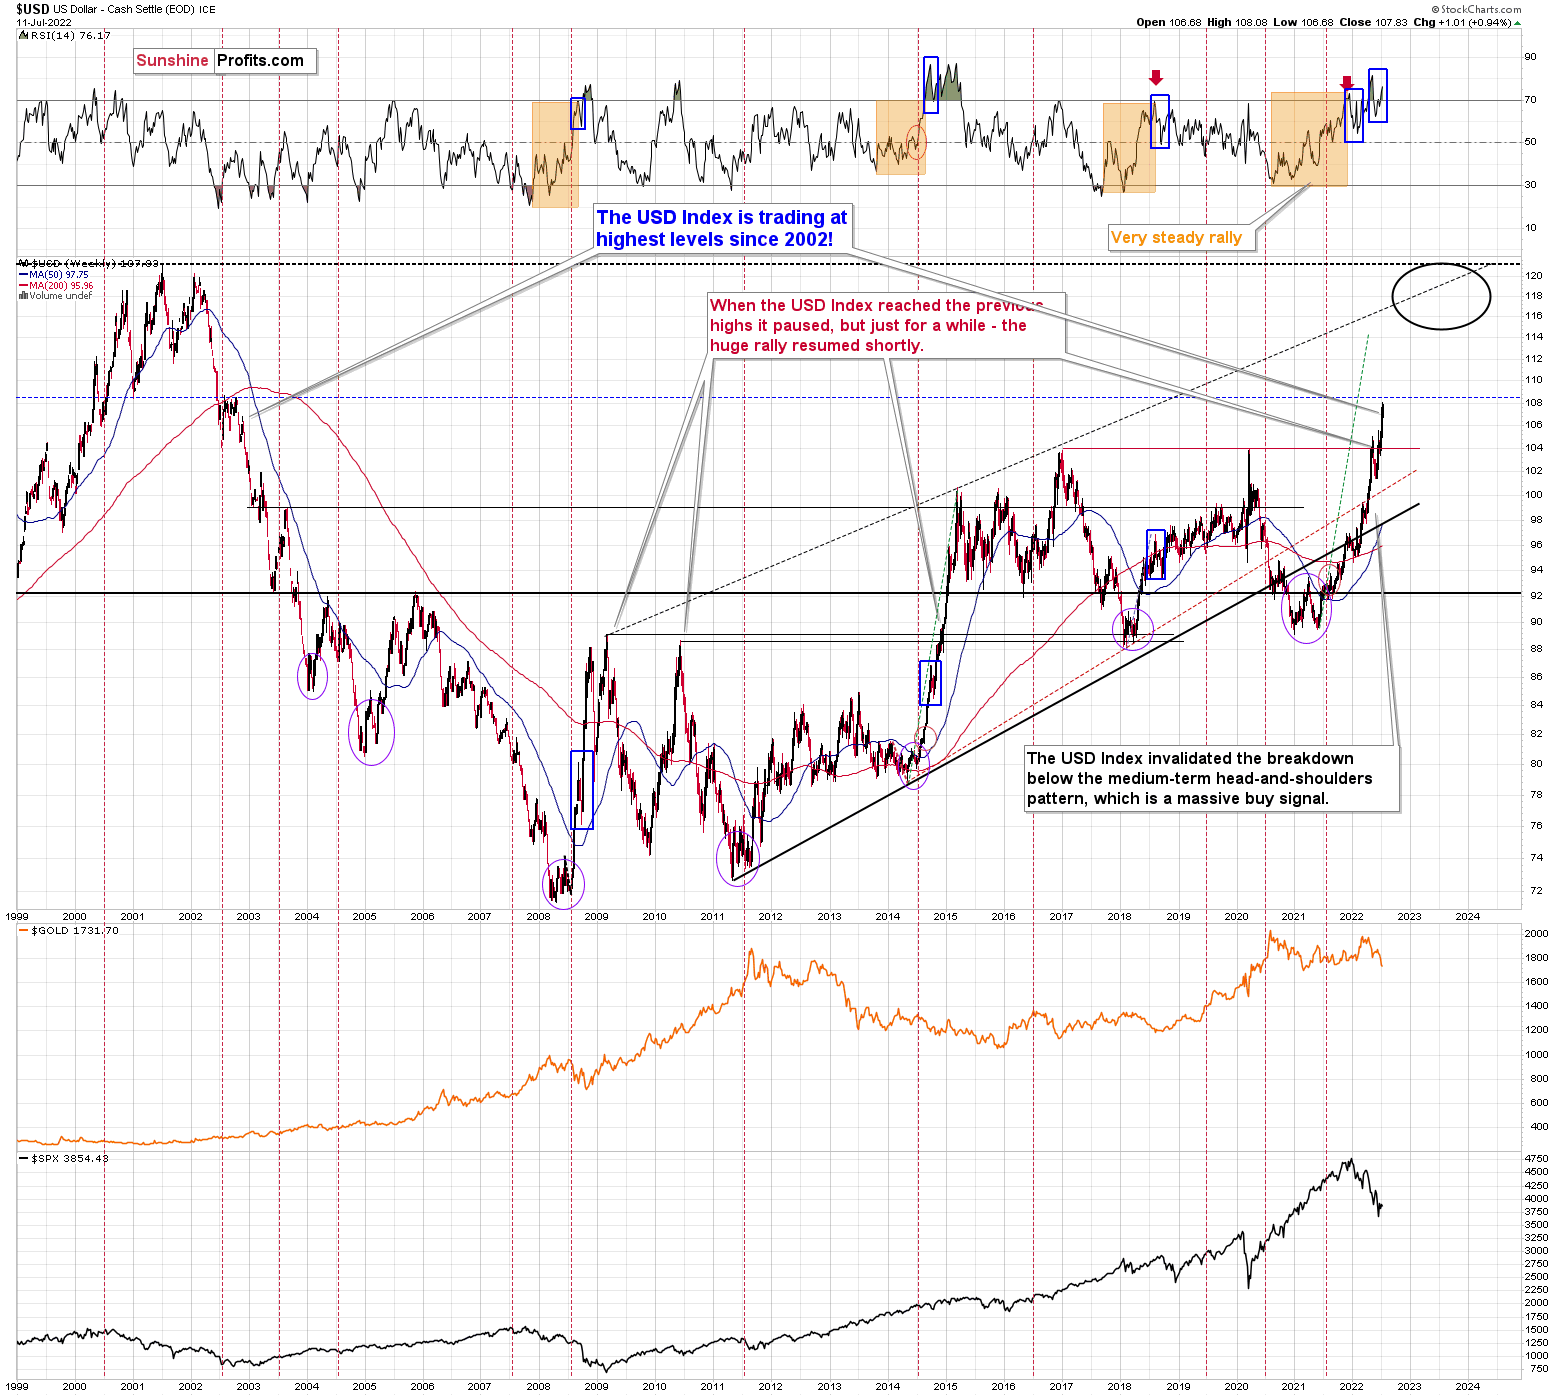
Yesterday’s intraday high was 108.08 and at the moment of writing these words, the USD Index futures are trading at 108.37. That’s very close to the long-term resistance level, which – especially given very overbought RSI – is likely to trigger at least a short-term pullback.
Let’s look under the hood.
The USD Index is a weighted average of individual currency exchanges, and the EUR/USD has the biggest weight (over 50%). Here is what it’s doing right now.
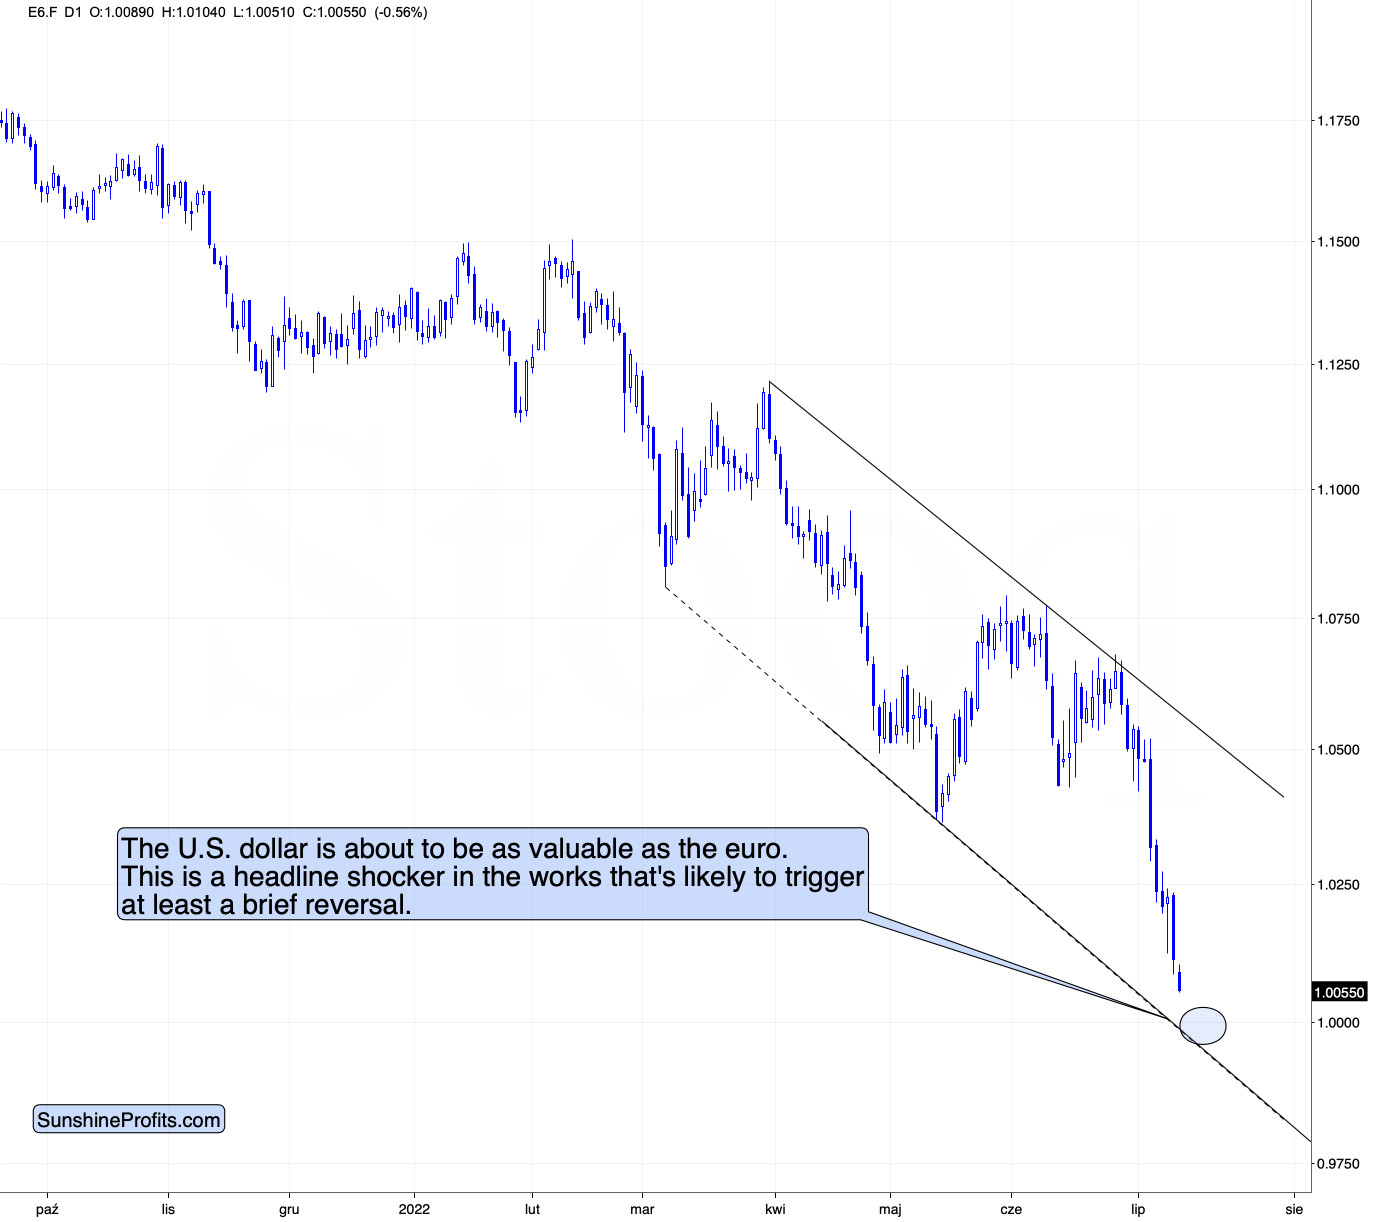
The euro futures (visible in the above chart) are plunging, and they are about to reach a very strong support level.
As you can see, the lower border of the declining trend channel is about to be reached, but there’s also something very special about the level at which it’s likely to be reached.
It’s the most important round number of them all: 1.
This means that if the trend continues, any hour now, the U.S. dollar is about to be as valuable as the euro!
This is a headline shocker in the words, and it’s very likely that it will trigger fresh buyers. “Enough is enough” they might say, not wanting to believe that the euro can be cheaper than the buck. Of course it can, but it’s unlikely that this level (and buyers) will allow that without a fight.
This fight is likely to trigger at least a brief reversal and a rally.
This, in turn, is likely to trigger a decline in the USD Index, which would be in perfect tune with what’s likely based on the USD’s long-term chart.
And since in today’s pre-market trading the USD Index is rallying and the euro is declining, gold is surely declining as well, right?
Wrong.
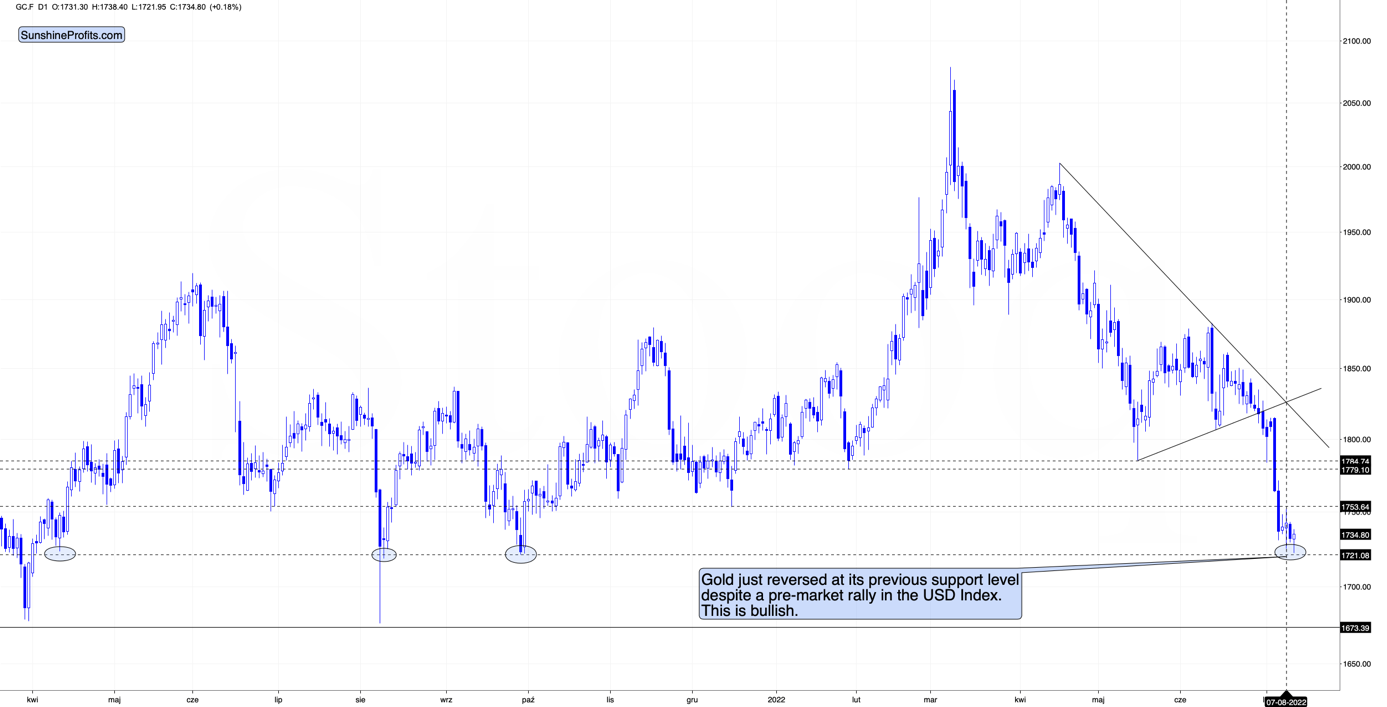
Gold declined initially, but then it reversed at its previous support level (that already worked several times), and it then moved back up despite the bearish forces coming from the forex market.
Instead of declining, gold showed strength and formed a reversal. This is a very bullish combination of factors. And the fact that it’s happening at the previous lows is notable also in light of the analogy to 2013 that I described yesterday.
Moreover, please note that gold’s Friday’s bottom formed right at gold’s triangle-vertex-based reversal. It moved slightly below Friday’s low today, but since it rallied back up, the breakdown was already invalidated. Overall, it seems that the bottom is either in or at hand.
So, we have a situation in which it seems that the USD Index is about to reach its top, but gold is not willing to react to the USD’s rallies. This is a very bullish combination for the short term. And there are ways to profit on this bullishness.
Something interesting happened in the GDXJ ETF as well.
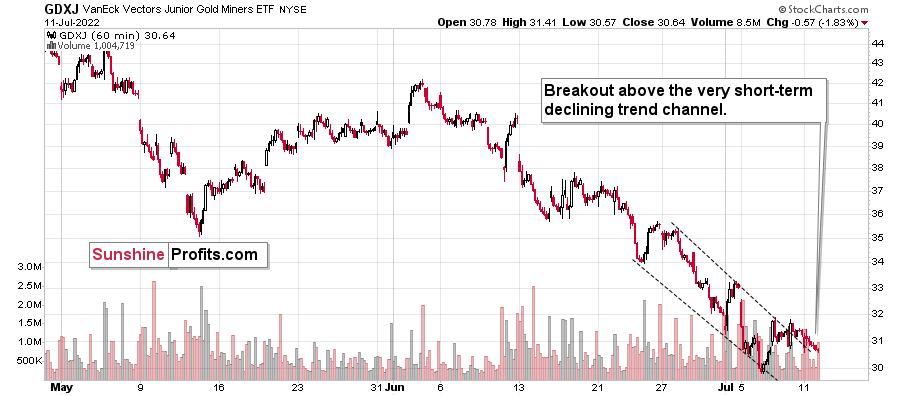
The above 1-hour-candlestick chart shows that junior miners just broke above their declining, short-term trend channel. In short, that’s a bullish development.
If gold is bottoming here, then the only thing preventing junior miners from rallying in the following days might be a huge decline in the stock market.
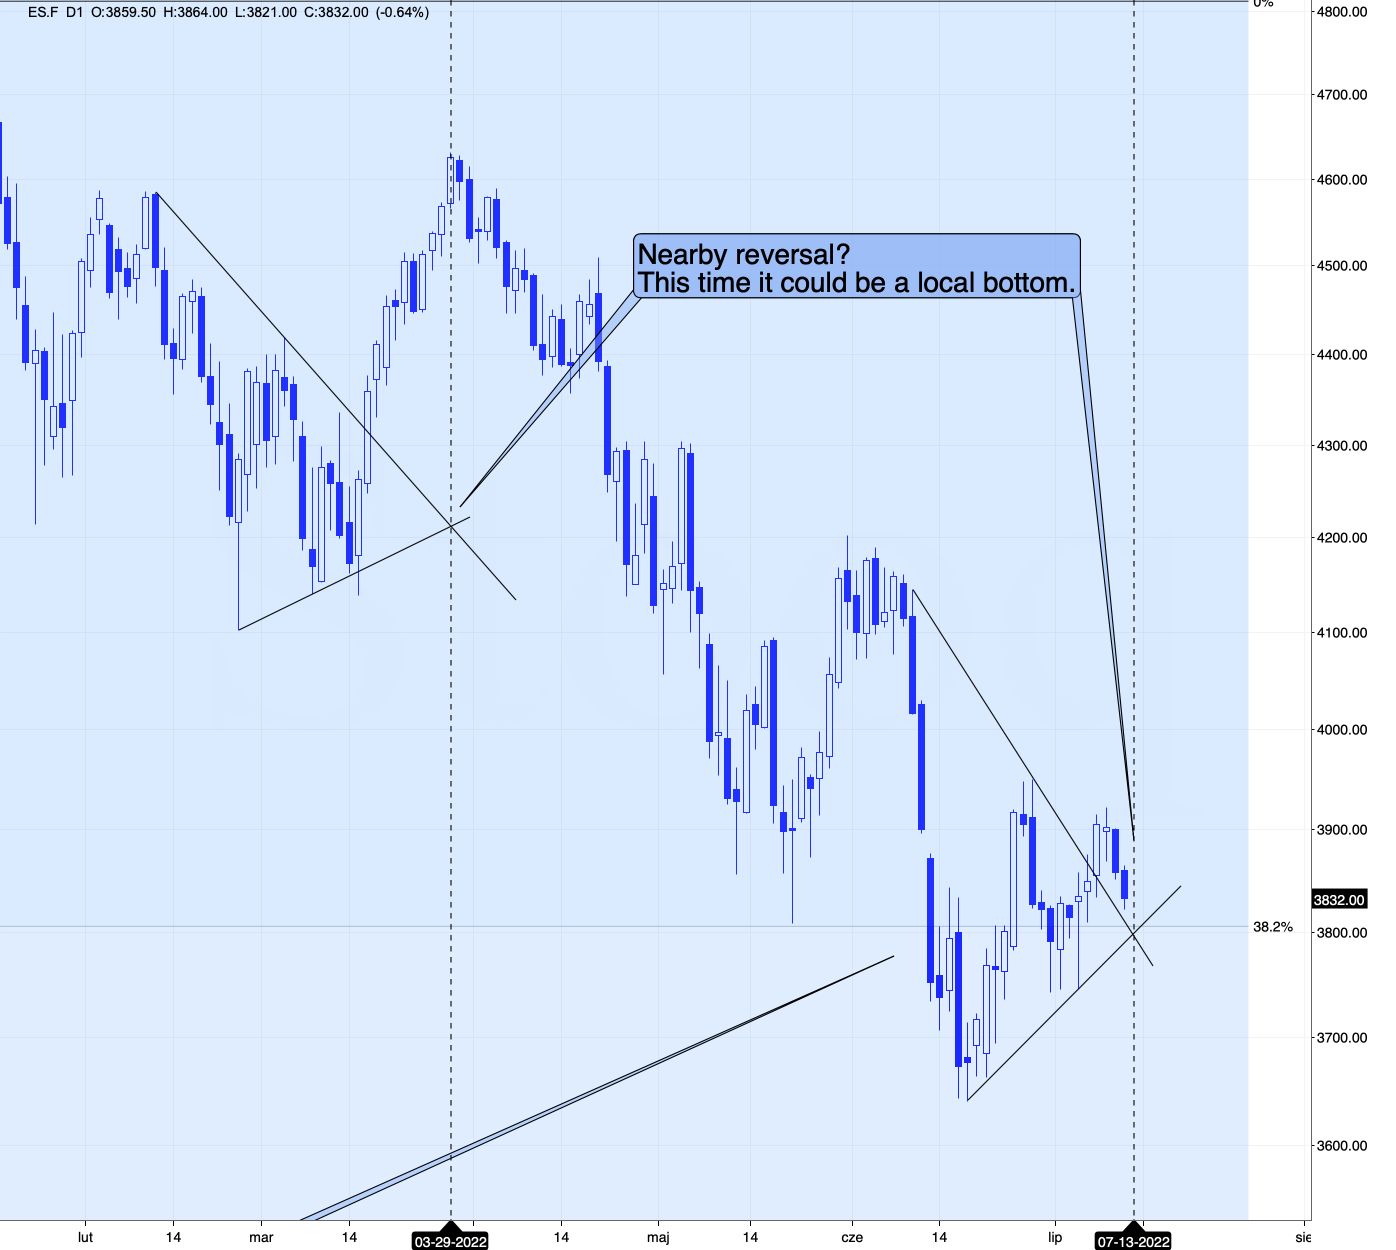
Interestingly, the stock market (the above chart features the S&P 500 futures) is right above the combination of short-term support levels.
What’s even more interesting is that we have a triangle-vertex-based reversal there tomorrow. To show that this technique is useful also in the case of the S&P 500 futures, I marked the previous similar triangle and the reversal that it triggered. Back then it was a local top, but since we’re seeing declines now, it’s much more likely that the reversal will actually be a short-term bottom.
All in all, this means that junior miners are likely to rally either right away or soon.
Of course, as always, we’ll keep you – our subscribers – informed.
Having said that, let’s take a look at the markets from a more fundamental point of view.
Awaiting the CPI
With the Consumer Price Index (CPI) scheduled for release on Jul. 13, investors decided to front-run the potentially bearish event. However, while the market-moving print often garners all of investors' attention, I've noted on numerous occasions that the CPI tells us where we've been, not where we're heading. In contrast, the business and private surveys are leading indicators and are much more informative.
In any event, while we may see a 'sell the rumor, buy the news' reversal on Jul. 13, the medium-term fundamentals are unchanged: inflation should stick around for the foreseeable future, and the required rate hikes to cool inflation are bullish for the USD Index and U.S. real yields.
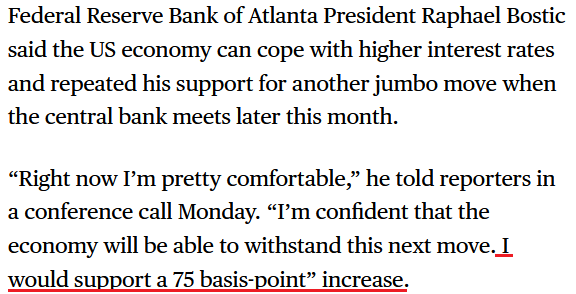
To that point, Atlanta Fed President Raphael Bostic said on Jul. 11 that the recent inflation data "has not been as encouraging as I would have liked. The data that came in the last several months really pointed to a need for us to get closer to that neutral stance faster."
As a result, he expects another 75 basis point rate hike at the July meeting.
Please see below:
 Source: Bloomberg
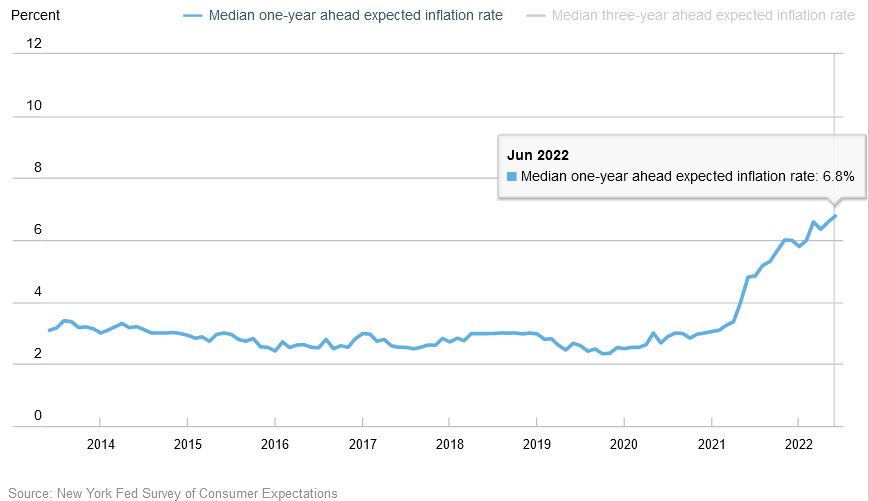
In addition, the New York Fed released its Survey of Consumer Expectations on Jul. 11. The report revealed:
“Median one-year-ahead inflation expectations increased to 6.8%, from 6.6% in May, marking a new series high. In contrast, median three-year ahead inflation expectations decreased to 3.6% from 3.9%.”
Thus, while Americans’ longer-term inflation expectations retreated in June, a reading of 3.6% is still well above the Fed’s 2% target. Moreover, with near-term inflation expectations increasing, the Fed has a long way to go to restore its credibility.
Please see below:
Furthermore, I noted on Jul. 11 that the Fed needs to increase the U.S. unemployment rate to cool wage inflation, and therefore, output inflation. I wrote:
 Source: U.S. Fed
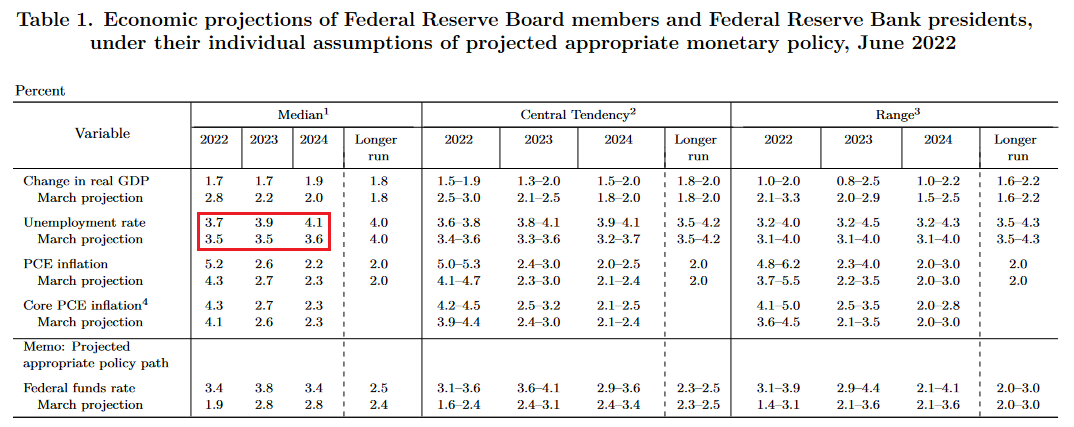
The FOMC's optimistic median assumptions have the U.S. unemployment rate hitting 3.7%, 3.9%, and 4.1% in 2022, 2023, and 2024. However, it's still at 3.6%. As a result, we're nowhere near the conditions that support a dovish pivot.
As further evidence, the U6 unemployment rate hit an all-time low in June.
Please see below:
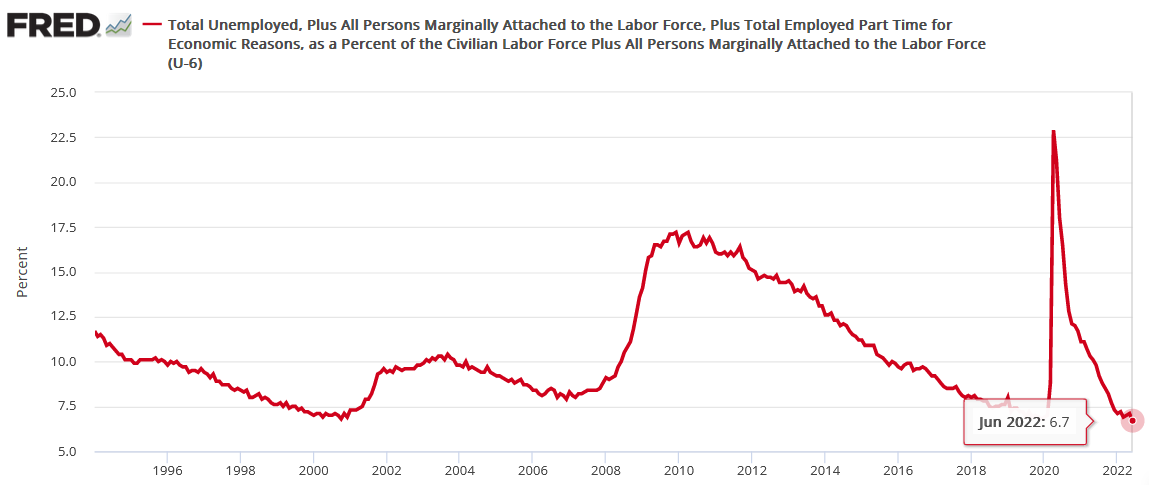
To explain, the U6 unemployment rate tallies the percentage of the U.S. labor force that’s unemployed and underemployed – which means it includes Americans who want full-time work but can only find part-time employment. In May, the figure was 7.1%. However, in June, it declined to 6.7%. Thus, while the Fed wants the unemployment rate to rise, the data is not complying.
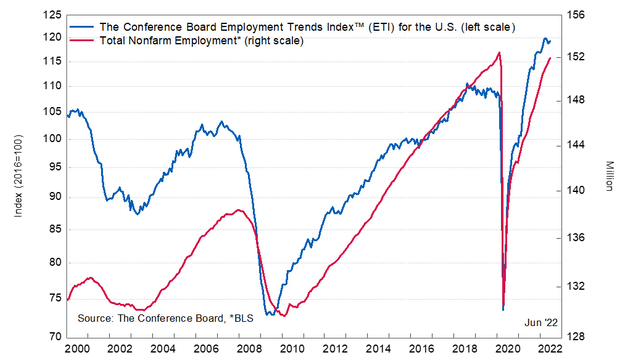
Likewise, The Confidence Board released its Employment Trends Index (ETI) on Jul. 11. The index increased from 118.88 in May (a downward revision) to 119.38 in June. Frank Steemers, Senior Economist at The Conference Board, said:
“A range of other economic indicators beyond the Employment Trends Index point to an economy that is slowing. Usually, it takes a few months for hiring decisions to adjust to changes in economic activity. Therefore, we expect positive, but decelerating, job growth over the next months.”
Thus, “with inflation still elevated and the Fed expected to continue to raise interest rates rapidly,” his message had ominous undertones. Moreover, he added that “by early 2023, there could possibly be monthly job losses, and in that case, the unemployment rate would tick up.”
However, the FOMC’s SEP shows officials expect the unemployment rate to increase. If not, the wage-price spiral will continue. Remember, the labor force participation rate declined in June, and the NFIB’s Small Business Jobs Report revealed that more small businesses plan wage increases in the months ahead. Thus, both are profoundly inflationary, and with the ETI increasing in June, Fed officials need to maintain their hawkish dispositions if they want inflation to subside.
Please see below:
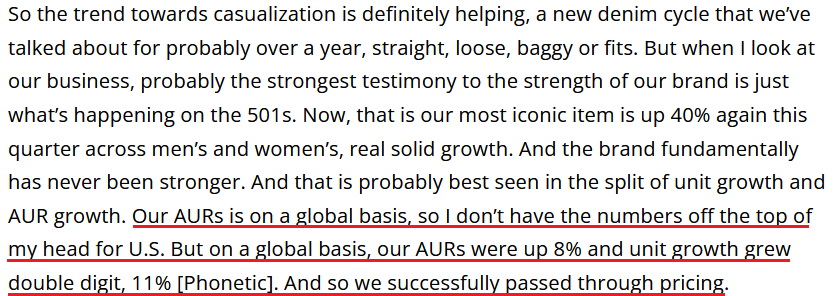
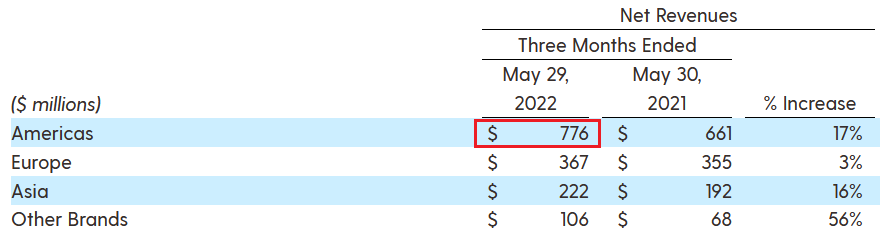
To that point, Levi Strauss & Co released its second-quarter earnings on Jul. 7. For context, Levi’s is the largest player in the U.S. jeans/denim market. Therefore, its products are discretionary and often purchased with disposable income. CFO Harmit Singh said during the Q2 earnings call:
“Total net revenue grew 20% to $1.5 billion, driven by 21% revenue growth in the U.S. and strong performance across our diverse global portfolio. Supply chain-related issues limited further revenue opportunity by approximately 2%, primarily in the U.S. where strong demand continued to outpace supply.”
Moreover, while CEO Chip Bergh noted “one soft spot” where “the low income consumer is really starting to feel the squeeze,” he added that “our wholesale results in the quarter were very, very strong,” and that “our core Red Tab business, Levi’s Red Tab, focused here on the U.S. specifically, we really have not seen any softening or have heard really any concern about Levi’s Red Tab from our customers.”
Thus, since “strong demand continued to outpace supply,” the environment resulted in an 8% increase in average unit retail (AUR). For context, AUR calculates the average selling price of Levi’s products.
Please see below:
 Source: AlphaStreet
Also, while Bergh said that the 8% price increase was “on a global basis,” Levi’s generated the bulk of its Q2 net revenue in the U.S and Canada. As a result, the 8% price increase likely occurred in America.
Please see below:
 Source: Levi Strauss & Co
All in all, the fundamental outlook is unchanged: inflation is sizzling, the U.S. labor market remains resilient, and U.S. corporations are still passing on higher input costs to consumers. Therefore, the Fed has to keep its foot on the hawkish accelerator or all of the recent progress will be reversed. As such, this environment is profoundly bearish for the PMs.
Cash Is King
While the S&P 500 sold off on Jul. 11, the index is likely far from a medium-term bottom. Moreover, while the Cboe Volatility Index (VIX) also jumped, material imbalances signal more trouble in the months ahead.
Please see below:
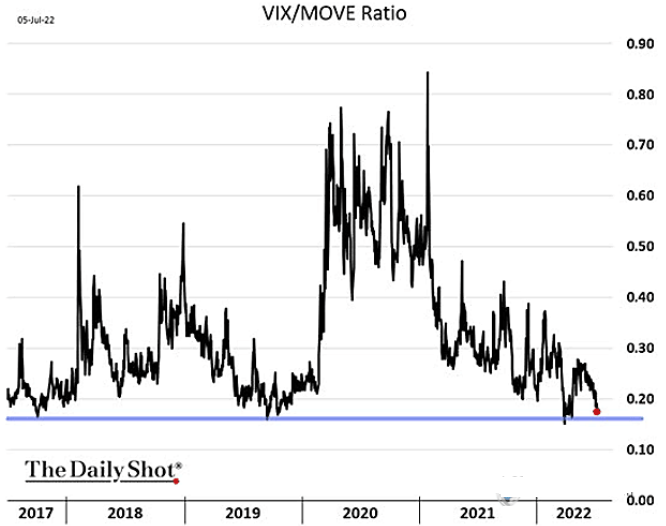
To explain, the black line above tracks the VIX (stock market volatility)-MOVE (bond market volatility) ratio. When the black line declines, it means that volatility in the bond market supersedes volatility in the stock market.
If you analyze the right side of the chart, you can see that the ratio is near its ~five-year lows. As such, either bond market volatility should subside – which is unlikely due to high inflation and a hawkish Fed – or stock market volatility should increase. Thus, the latter is more likely over the medium term.
Furthermore, the MOVE Index’s recent ascent above 150 was only the 11th iteration in the last 35 years.
Please see below:
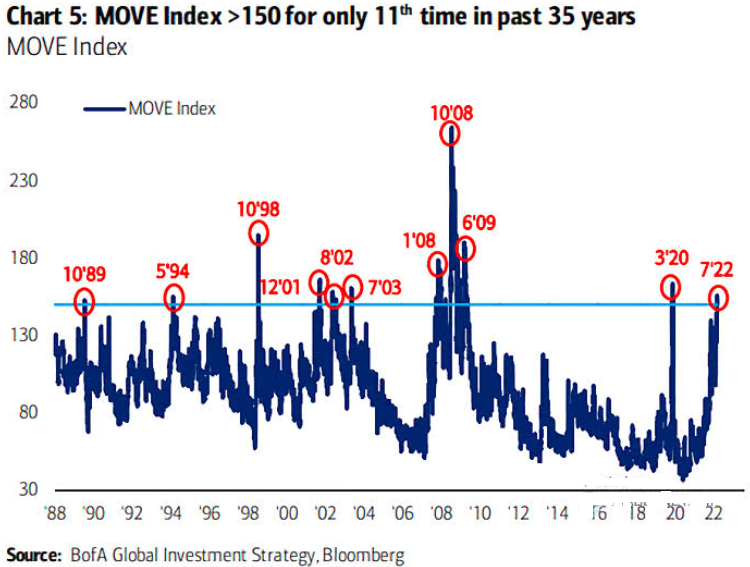
To explain, the blue line above tracks the MOVE Index. If you analyze the annotations, you can see that spikes above 150 often occur alongside climatic events (like 2001, 2008, 2020) or during periods of immense stock market weakness. Therefore, more S&P 500 downside should materialize, and the GDXJ ETF should suffer along the way.
In addition, small cap stocks are highly cyclical and more leveraged to the performance of the U.S. economy. As a result, the Russell 1000 Index should come under pressure in the coming months.
Please see below:
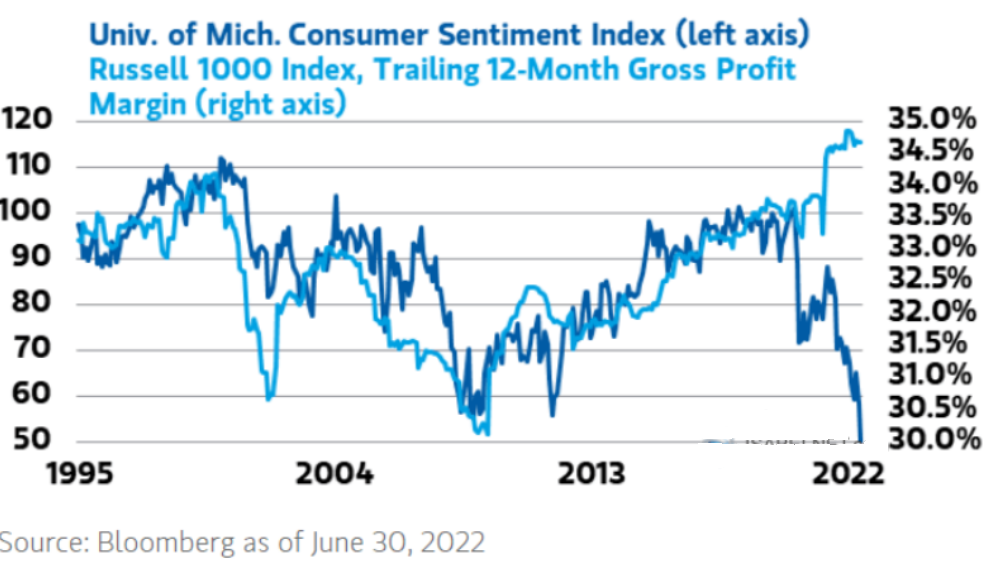
To explain, the dark blue line above tracks the University of Michigan’s Consumer Sentiment Index, while the light blue line above tracks the Russell 1000 Index’s trailing 12-month gross profit margin.
If you analyze the right side of the chart, you can see that the former has sunk like a stone. Moreover, with the latter likely to follow suit over the next few quarters, stock investors are unlikely to celebrate higher interest rates, weak demand and lower corporate earnings.
The Bottom Line
While the S&P 500 and the GDXJ ETF have suffered mightily in 2022, the fundamental issues that led to their demise are nowhere near a resolution. With nearly 70 years of data showing that periods of unanchored inflation end with recessions, a realization is far from priced in.
Therefore, unless the Fed engineers a rate-hike-induced slowdown, the harsh reality is that inflation won’t subside without more hawkish policy. As a result, the ‘soft landing” ship has sailed, and it’s simply a matter of how much economic pain needs to occur before inflation finally retreats.
In conclusion, the PMs declined on Jul. 11, and the GDXJ ETF underperformed once again. Moreover, with the USD Index closing at a new 2022 high and the U.S. 10-Year real yield ending the day at 0.67%, both need to move higher to curb inflation. As such, the PMs should head in the opposite direction in the medium term.
In the very short term, we’re still likely to see a corrective upswing in the GDXJ, as it seems the markets got ahead of themselves and need to take a breather.
Overview of the Upcoming Part of the Decline
- It seems to me that the precious metals market is about to correct (rally) – similarly to what we saw in 2013 right before the April slide. And then – once the corrective rally is complete – I expect a huge decline to follow.
- If we see a situation where miners slide in a meaningful and volatile way while silver doesn’t (it just declines moderately), I plan to – once again – switch from short positions in miners to short positions in silver. At this time, it’s too early to say at what price levels this could take place and if we get this kind of opportunity at all – perhaps with gold prices close to $1,600.
- If we see a situation where miners slide in a meaningful and volatile way while silver doesn’t (it just declines moderately), I plan to – once again – switch from short positions in miners to short positions in silver. At this time, it’s too early to say at what price levels this could take place and if we get this kind of opportunity at all – perhaps with gold prices close to $1,600.
- I plan to exit all remaining short positions once gold shows substantial strength relative to the USD Index while the latter is still rallying. This may be the case with gold close to $1,400. I expect silver to fall the hardest in the final part of the move. This moment (when gold performs very strongly against the rallying USD and miners are strong relative to gold after its substantial decline) is likely to be the best entry point for long-term investments, in my view. This can also happen with gold close to $1,400, but at the moment it’s too early to say with certainty.
- The above is based on the information available today, and it might change in the following days/weeks.
You will find my general overview of the outlook for gold on the chart below:
Please note that the above timing details are relatively broad and “for general overview only” – so that you know more or less what I think and how volatile I think the moves are likely to be – on an approximate basis. These time targets are not binding or clear enough for me to think that they should be used for purchasing options, warrants, or similar instruments.
Letters to the Editor
Q: Hi PR,
I have a question for you based on some of your recent analyses. The Fed has just increased rates to 1.5 basis points this year, but federal and consumer debt is at all times high. If the Fed raises the rates to 8% to match CPI inflation numbers, wouldn't they crush the economy? From your perspective, what would the implications be for the economy? Since they can't afford Fed Fund rates at 6% and can’t afford positive real rates, in what way could this impact your forecast of $1500 Gold this year?
Thanks for your fantastic newsletters.
A: Thanks, I’m very happy that you enjoy the results of our efforts!
Yes, I think the rising interest rates will crush the economy. But the alternative is crushing it through inflation that gets out of control, so it’s not like The Powers That Be have much of a choice here. It’s just a matter of how this not-so-soft landing takes place.
Given this kind of “choice”, what will they likely choose? In my opinion, they will choose the option that allows them to minimize the blame that they will have to bear (so, I expect that they will act in their own best interest). And in order to do this, they will simply react to what is expected of them (whether they manipulate those expectations is another topic). Right now, people are most concerned with inflation and to the extent that it became political. Consequently, it’s inflation that they will fight. Once the shit hits the fan and the economy tumbles, jobs are destroyed, many companies go bankrupt etc., they will just open their arms in a warm gesture and say “we just did our job, and we took your voice into account”. They’ll probably add something along the lines of “it was all due to the pandemic and Putin’s invasion” and “we did all we could do”.
Did “they”, though? It’s a matter of who “they” are, of course – the political parties and those leading the Fed change. The thing is that for many years nobody wanted to address the true problem, which was the massive money creation, concentration of benefits from the increase in productivity in the hands of a few, which ultimately happened at the expense of many, but it happened in a way that’s so complicated and along with so many distractions that almost nobody noticed. However, that is a topic for another discussion or a small book.
Does the above impact my expectation of gold declining below $1,500? It actually confirms it. Whether the Fed manages to truly contain the inflation or not (remember: at some point they can just convince everyone to move to gov’t-sponsored crypto instead of regular fiat money or gold), they will definitely try, and as the real rates rise, gold will be likely to fall.
Summary
Summing up, it seems that while the medium-term trend in the precious metals sector remains down, we are likely to see a corrective upswing soon. Based on the confirmations that we saw yesterday and in today’s pre-market trading, the short-term outlook is bullish.
It seems likely that the profits that we earned from the last couple of trades will increase even further shortly.
After the final sell-off (that takes gold to about $1,350-$1,500), I expect the precious metals to rally significantly. The final part of the decline might take as little as 1-5 weeks, so it's important to stay alert to any changes.
As always, we'll keep you – our subscribers – informed.
To summarize:
Trading capital (supplementary part of the portfolio; our opinion): Full speculative long positions (100% of the full position) in junior mining stocks are justified from the risk to reward point of view with the following binding exit profit-take price levels:
Mining stocks (price levels for the GDXJ ETF): binding profit-take exit price: $33.87; stop-loss: none (the volatility is too big to justify a stop-loss order in case of this particular trade)
Alternatively, if one seeks leverage, we’re providing the binding profit-take levels for the JNUG (2x leveraged). The binding profit-take level for the JNUG: $36.78; stop-loss for the JNUG: none (the volatility is too big to justify a SL order in case of this particular trade).
For-your-information targets (our opinion; we continue to think that mining stocks are the preferred way of taking advantage of the upcoming price move, but if for whatever reason one wants / has to use silver or gold for this trade, we are providing the details anyway.):
Silver futures upside profit-take exit price: $20.28
SLV profit-take exit price: $18.78
AGQ profit-take exit price: $24.57
Gold futures upside profit-take exit price: $1,776
HGU.TO – alternative (Canadian) 2x leveraged gold stocks ETF – the upside profit-take exit price: $13.46
HZU.TO – alternative (Canadian) 2x leveraged silver ETF – the upside profit-take exit price: $9.18
Long-term capital (core part of the portfolio; our opinion): No positions (in other words: cash)
Insurance capital (core part of the portfolio; our opinion): Full position
Whether you’ve already subscribed or not, we encourage you to find out how to make the most of our alerts and read our replies to the most common alert-and-gold-trading-related-questions.
Please note that we describe the situation for the day that the alert is posted in the trading section. In other words, if we are writing about a speculative position, it means that it is up-to-date on the day it was posted. We are also featuring the initial target prices to decide whether keeping a position on a given day is in tune with your approach (some moves are too small for medium-term traders, and some might appear too big for day-traders).
Additionally, you might want to read why our stop-loss orders are usually relatively far from the current price.
Please note that a full position doesn't mean using all of the capital for a given trade. You will find details on our thoughts on gold portfolio structuring in the Key Insights section on our website.
As a reminder - "initial target price" means exactly that - an "initial" one. It's not a price level at which we suggest closing positions. If this becomes the case (as it did in the previous trade), we will refer to these levels as levels of exit orders (exactly as we've done previously). Stop-loss levels, however, are naturally not "initial", but something that, in our opinion, might be entered as an order.
Since it is impossible to synchronize target prices and stop-loss levels for all the ETFs and ETNs with the main markets that we provide these levels for (gold, silver and mining stocks - the GDX ETF), the stop-loss levels and target prices for other ETNs and ETF (among other: UGL, GLL, AGQ, ZSL, NUGT, DUST, JNUG, JDST) are provided as supplementary, and not as "final". This means that if a stop-loss or a target level is reached for any of the "additional instruments" (GLL for instance), but not for the "main instrument" (gold in this case), we will view positions in both gold and GLL as still open and the stop-loss for GLL would have to be moved lower. On the other hand, if gold moves to a stop-loss level but GLL doesn't, then we will view both positions (in gold and GLL) as closed. In other words, since it's not possible to be 100% certain that each related instrument moves to a given level when the underlying instrument does, we can't provide levels that would be binding. The levels that we do provide are our best estimate of the levels that will correspond to the levels in the underlying assets, but it will be the underlying assets that one will need to focus on regarding the signs pointing to closing a given position or keeping it open. We might adjust the levels in the "additional instruments" without adjusting the levels in the "main instruments", which will simply mean that we have improved our estimation of these levels, not that we changed our outlook on the markets. We are already working on a tool that would update these levels daily for the most popular ETFs, ETNs and individual mining stocks.
Our preferred ways to invest in and to trade gold along with the reasoning can be found in the how to buy gold section. Furthermore, our preferred ETFs and ETNs can be found in our Gold & Silver ETF Ranking.
As a reminder, Gold & Silver Trading Alerts are posted before or on each trading day (we usually post them before the opening bell, but we don't promise doing that each day). If there's anything urgent, we will send you an additional small alert before posting the main one.
Thank you.
Przemyslaw Radomski, CFA
Founder, Editor-in-chief

