

Briefly: in our opinion, no speculative positions in gold, silver or mining stocks are justified from the risk/reward point of view at the moment of publishing this Alert. In other words, we’re happy holding the profits from the trade that we closed on Friday, and are waiting for the next favorable entry, which is likely to present itself relatively soon.
As you’ve read in Friday’s intraday Gold & Silver Trading Alert, we just took profits from our previous short positions, and as you know from Friday’s regular (flagship) Gold & Silver Trading Alert, the medium-term outlook for the precious metals sector remains down – it’s extremely bearish for junior mining stocks.
Here’s a quick recap: we entered this short position on May 26, when the GDXJ was trading relatively close to $40. We did that right after we took profits from our previous long position (entered on May 12, which was when we also took profits from the preceding short position). When I sent out the Alert on Friday (Jul 8), the GDXJ was trading at about $31.25.
So, in 28 trading days, you profited on the ~$9 decline in the GDXJ, which was a move lower by over 20% – quite a nice profit for just a bit more than one month.
During the same time, the leveraged proxy for the GDXJ, the JDST, moved from about $9.75 to about $14.37. That’s a gain of about 47%, and that’s on top of a previous gain (preceding long position), which in turn took place right after the previous gain (preceding short position).
Congratulations once again!
OK, what’s next?
While it’s still possible that miners will move lower in the very near term and then correct, I don’t think it’s justified to keep betting on this move at this time. The situation is simply too neutral. Yes, the medium-term factors point to decline’s continuation. However, there are three important signs pointing to a (short-term!) reversal as well.
The most important indication came from the USD Index.
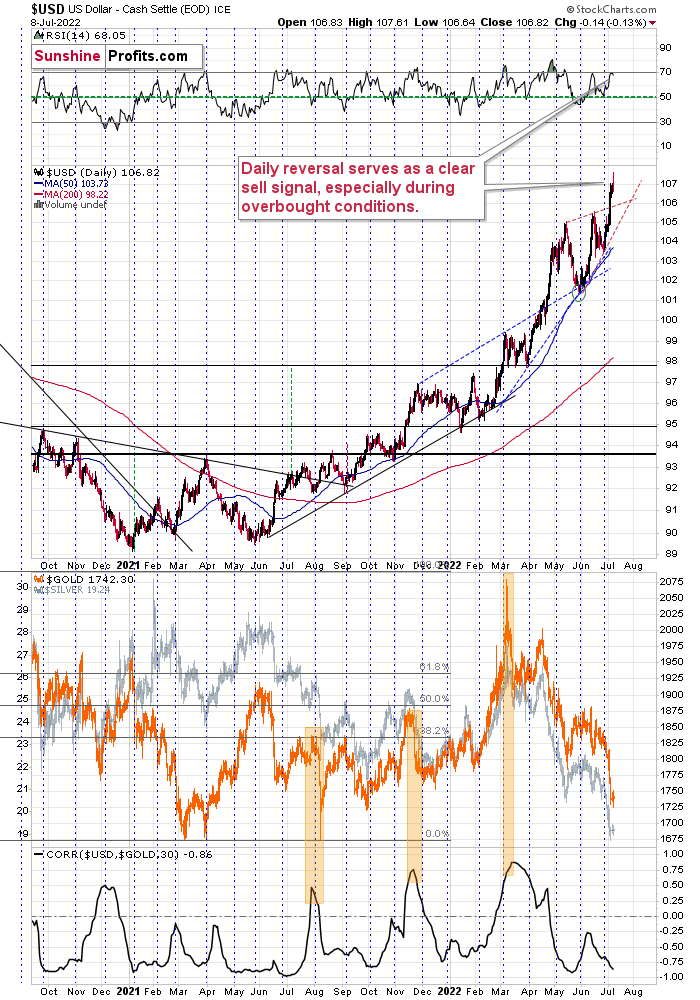
It reversed in a profound manner. I previously wrote that the USDX could rally a bit above 108 and top there, but Friday’s intraday high of 107.61 is “close enough” for me to say that the target was “reached enough”.
You see, at a time when it’s obvious to everyone that a top will take place at a certain level, people (and institutions) place exit orders (and entry orders for short positions) below the topping level, in order to maximize the odds that they will enter the position at all. If enough capital is used for such bets, the top would effectively be formed lower, as those orders are executed.
This might or might not have happened on Friday, but the price was close enough to view this as a possibility. That’s just one thing about Friday’s session that has “caution!” written all over it.
The next, and perhaps most important indication, is the shape of Friday’s candlestick. It was a daily reversal. After an attempt to rally, the USDX reversed and ended the day lower. The USD Index is after a big, sharp upswing, so a correction is expected to happen eventually, and a daily reversal could be all it takes to trigger it.
Finally, the RSI based on the USD Index was just at the 70 level – something that has coincided with local tops in the USD many times in the recent past. For example, that’s what triggered the June correction.
Consequently, we have a situation in which the USD Index could continue to move higher, but it might also correct right away without any additional short-term upswing.
The latter would most likely imply a corrective rally in the precious metals sector.
Wait, wasn’t gold supposed to decline all the way down to its 2021 lows because of the analogy to what happened in 2013?
Yes, that’s what I wrote.
However, I wasn’t very precise in describing the analogy. There was really no reason for me to be very precise because, after all, history tends to rhyme, not repeat itself to the letter.
The question here is, if a corrective rally from Friday’s levels would still be in tune with what happened in 2013, or would it invalidate it. Taking a closer look at what happened in 2013 reveals that it would remain in perfect tune with it. Thus, the link to 2013 doesn’t tell us whether we see a corrective upswing now or after an additional short-term decline. Let’s take a look at gold’s performance from 2013 for more details.
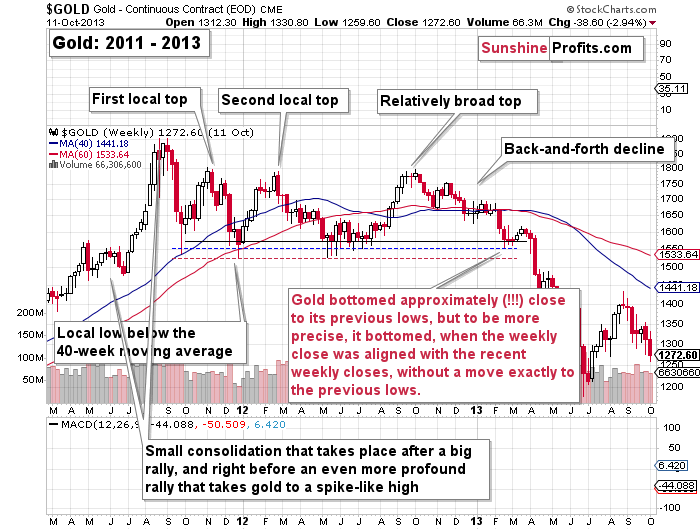
The gold price bottomed approximately (!!!) close to its previous lows. However,to be more precise, it bottomed when the weekly close was aligned with the recent weekly closes, without a move exactly to the previous lows.
What did we just see in gold?
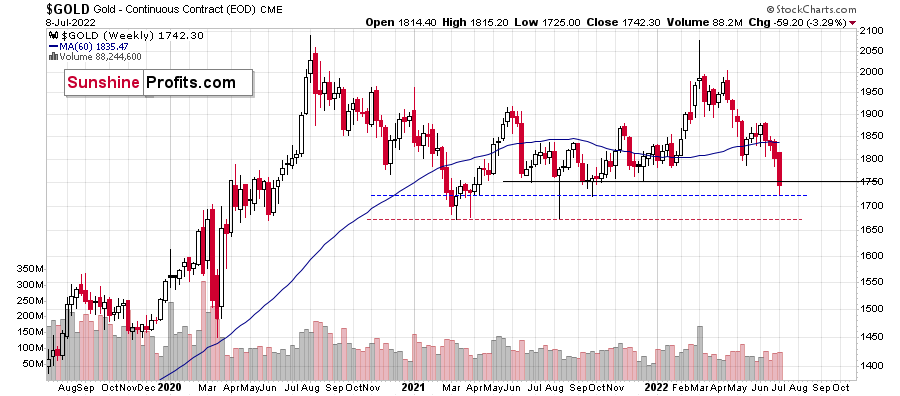
It moved to one of the recent intraweek lows, but on a weekly close basis, it closed very near the previous weekly closes. I marked these levels with solid, black lines on the above charts.
Consequently, we might see a corrective upswing shortly – perhaps as early as this week.
Interestingly, it would perfectly fit the recent head and shoulders formation that could be verified thanks to the correction.
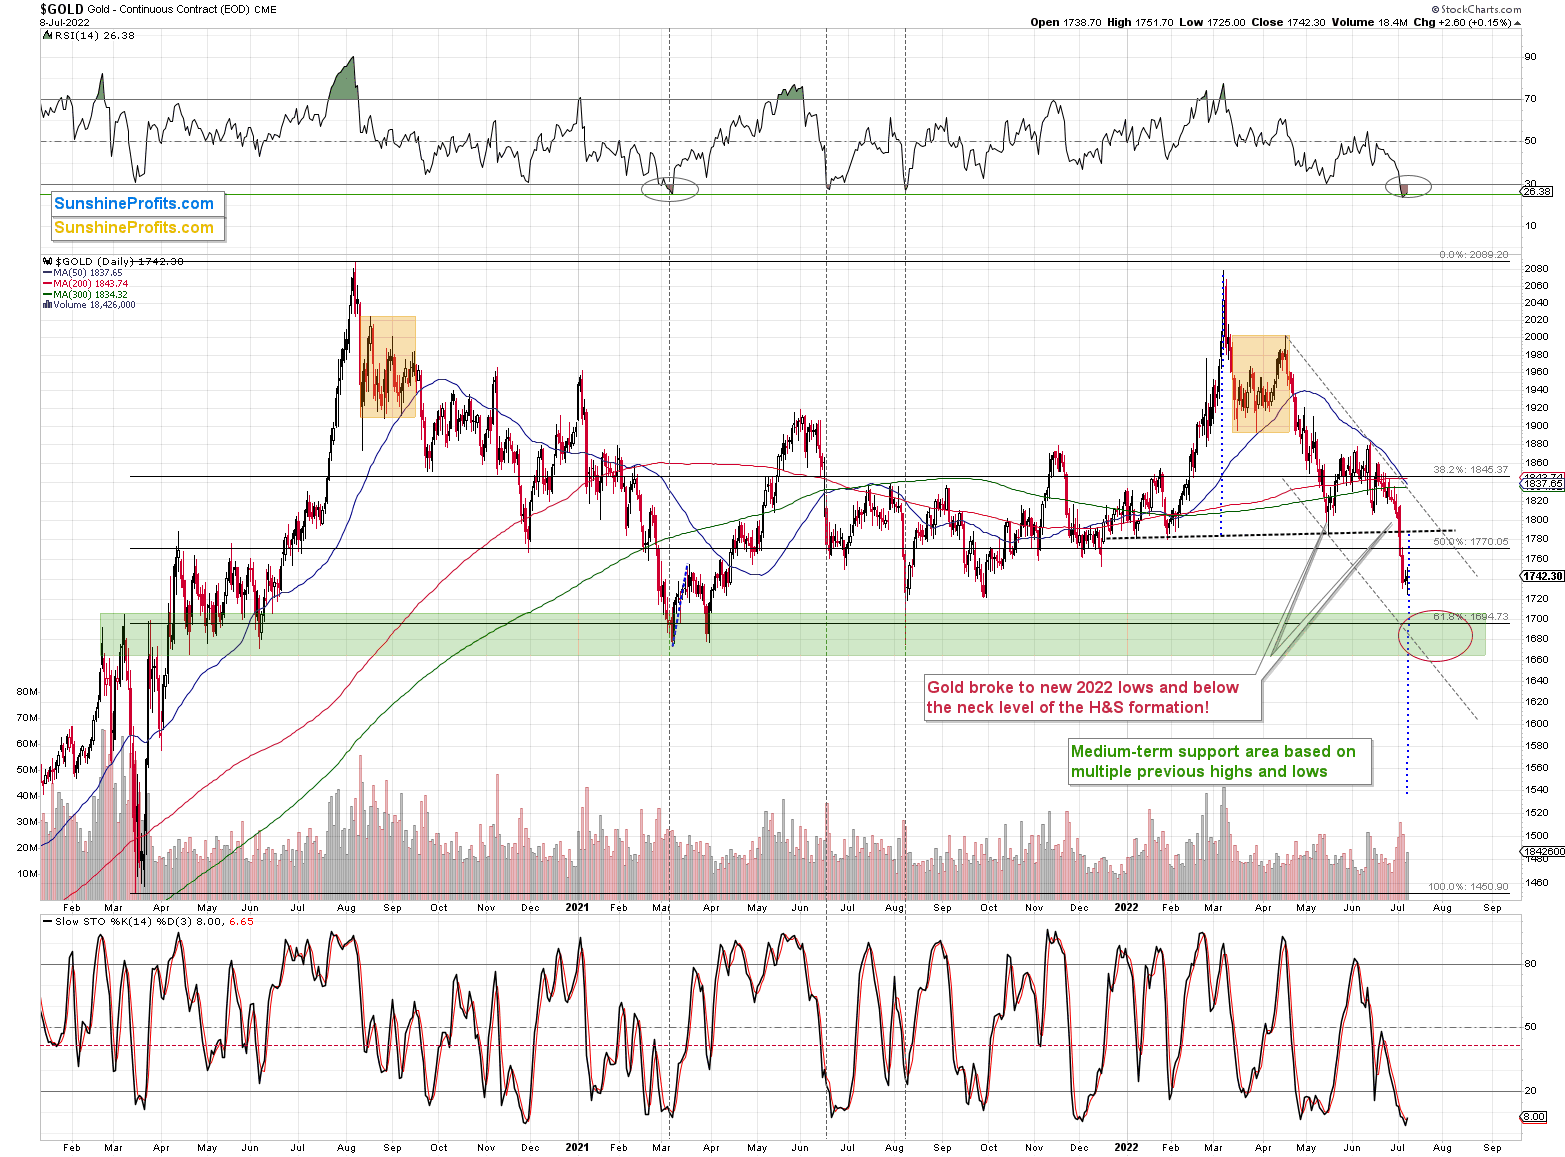
The H&S patterns are often followed by a move back to the neck level, which then – if it holds and serves as resistance – is followed by a decline that’s as big (approximately) as the size of the head of the pattern. If this line doesn’t hold, then it all serves as a gold buy signal.
Based on the indications that I’ve been writing about for weeks / months, the odds strongly favor the continuation of the medium-term decline. This means that it’s likely that the neck level will serve as resistance.
This means that if gold corrects here, I think that the ~$1,790-1,800 area would be the maximum (!) size of the correction. It might not even be as big.
The rally in mining stocks might be smaller still.
The latter would likely depend on the performance of the general stock market, though. If it rallies and gold does too, then juniors would be likely to soar in the very near term. If stocks don’t rally or decline, then the rally in juniors could still take place (based on how oversold they are from the short-term point of view), but it doesn’t have to happen in this case (at least it would not be very highly probable).
An additional “cautionary” signal comes from the silver market.
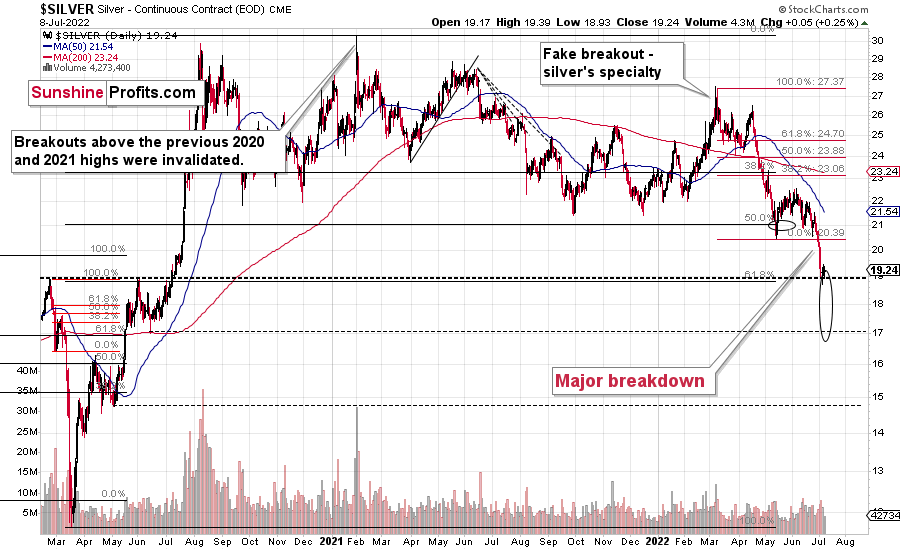
The signal itself is rather straightforward. Namely, silver’s price moved a bit higher after moving to the upper border of its target area that’s based on the early-2020 highs.
In the case of silver, a comeback to the previous 2022 low (at about $20.4) seems like a realistic scenario.
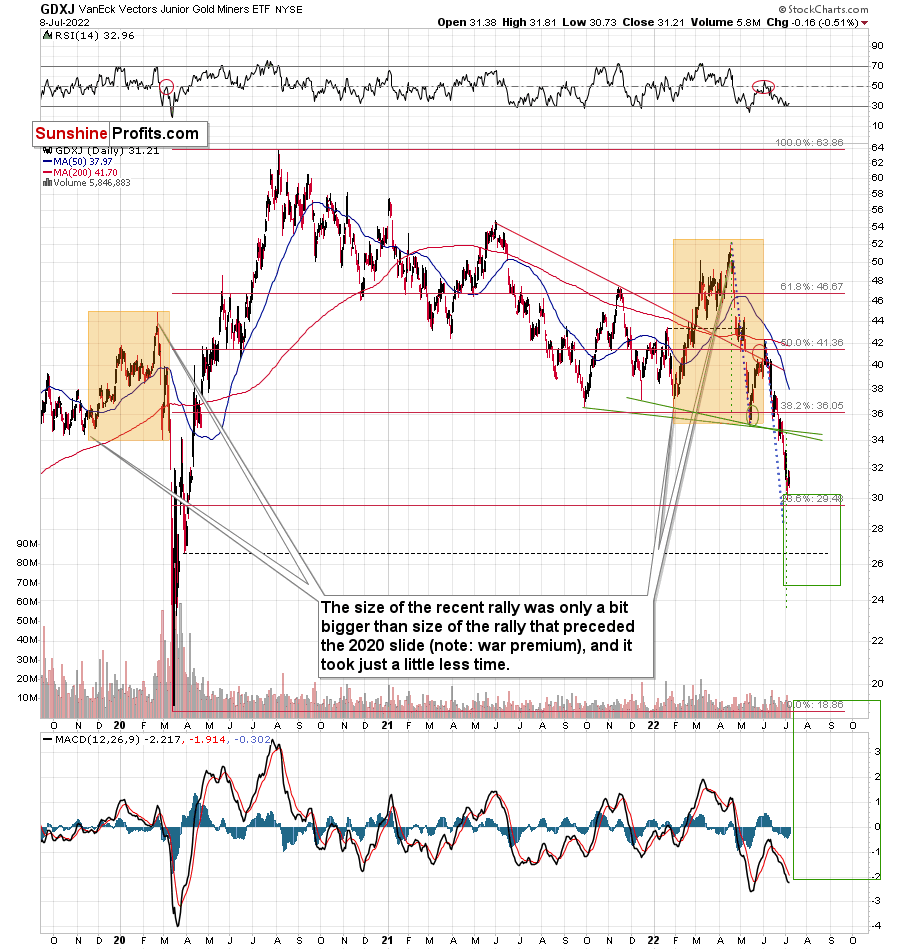
Let’s not forget that junior miners reached the upper part of their target area as well. The support was provided by the psychologically important $30 level and one of the Fibonacci retracement levels.
Based on the above chart, if gold corrects to the neck level of its previously-completed head-and-shoulders pattern, it wouldn’t be surprising to see something similar take place in the GDXJ.
In the case of the junior miners, the neck level (and thus the possible upside target) is slightly above the $34 level, so that’s where the GDXJ could rally. This level is also strengthened by the late-March 2020 top.
Please keep in mind that it could be the case that the GDXJ tops below that, especially if the general stock market declines soon.
So, for now, the old Wall Street saying seems to be the best summary of the short-term outlook and its implications – “when in doubt, stay out.”
Of course, as always, we’ll keep you – our subscribers – informed.
Having said that, let’s take a look at the markets from a more fundamental point of view.
A Job Well Done
With the Fed on a hawkish warpath to curb inflation, the second half of its dual mandate is maximum employment. As a result, a robust U.S. labor market increases the Fed’s confidence to forge ahead with rate hikes.
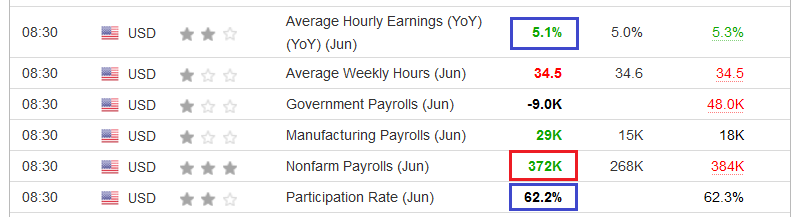
To that point, U.S. nonfarm payrolls outperformed on Jul. 8, and the employment resiliency sets the stage for a much higher U.S. federal funds rate in the coming months.
Please see below:
 Source: Investing.com
To explain, the red box above shows that U.S. nonfarm payrolls came in at 372,000 versus 268,000 expected. Therefore, the ‘bad news is good news’ crowd was dealt a major blow. Furthermore, please focus your attention on the two blue boxes. The data shows that average hourly earnings came in at 5.1% year-over-year (YoY) versus 5% expected, which means that wage inflation remains problematic.
Likewise, the second blue box highlights how the U.S. labor force participation rate declined from 62.3% to 62.2%. This is profoundly inflationary because while labor demand persists, the U.S. workforce shrank in June. In contrast, the Fed needs more Americans to enter the labor market to increase supply and reduce wage inflation. Thus, the data is bullish for hawkish Fed policy.
In addition, the U.S. Bureau of Labor Statistics released its JOLTS job openings report on Jul. 6. The data is for the end of May, so it lags by roughly a month. However, the results also outperformed expectations.
Please see below:
 Source: Investing.com
More importantly, while the Fed has hiked interest rates six times in 2022 (25 basis point increments), the impact has been relatively mild on the U.S. labor market.
Please see below:
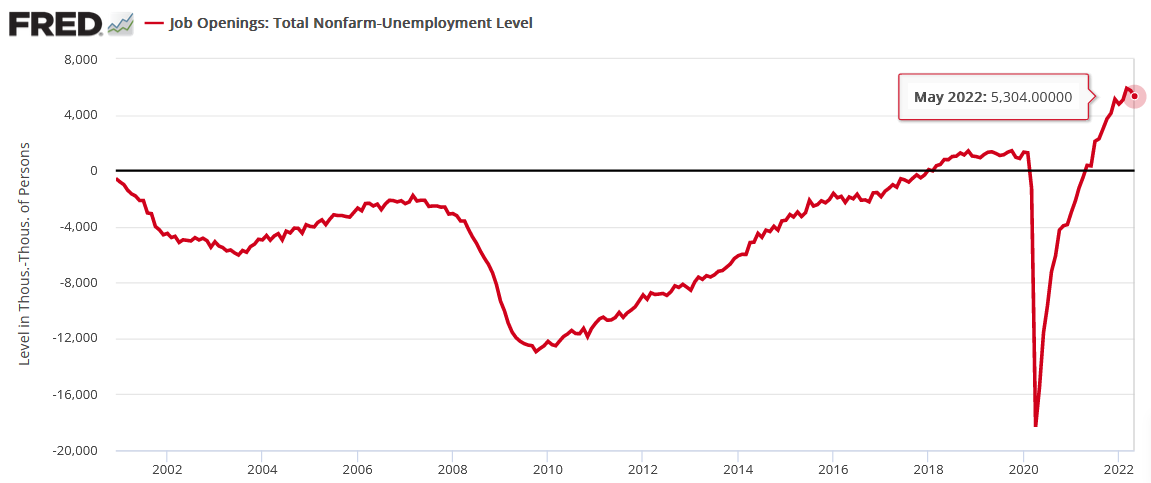
To explain, the red line above tracks the spread between JOLTS job openings and the number of unemployed U.S. citizens. If you analyze the right side of the chart, you can see that there are roughly 5.3 million more job openings than unemployed Americans. As a result, the Fed has to go much further to cool wage inflation and, therefore, output inflation.
In addition, the metric has declined by ~600,000 since March, which equates to ~300,000 per month. At this rate, it will take another ~18 months of declines for the spread to hit zero. Moreover, even a flat figure – where JOLTS job openings equal the number of Americans unemployed – would still signal a relatively strong U.S. labor market, given that the spread has been negative for most of the last ~20 years. As such, the Fed can fire more hawkish bullets without collapsing the U.S. labor market.
To that point, Indeed’s Economic Research Director for North America, Nick Bunker, wrote on Jul. 6:
“If the labor market were quickly and suddenly taking a downturn, we would see employers’ demand for new hires drop and their willingness to let workers go increase. For now, we aren’t seeing a sudden move in either direction. Yes, job openings have drifted down slightly in recent months, but there are still 1.9 job openings for every unemployed worker (…).”
“Despite continued headlines about layoffs, particularly in the tech sector, the layoff rate remains low at 0.9%. This is the 15th straight month that the layoff rate has been below its pre-pandemic bottom.”
As a result:
“There will be a time when the US labor market takes a downturn, jobs are shed at a higher rate, and workers stop quitting their jobs. But that time has yet to come. The labor market remains very tight and very hot. That may change, but it hasn’t yet.”
Thus, while a U.S. recession is likely a done deal over the medium term, robust employment and resilient wage inflation should continue to spur output inflation. Therefore, the Fed needs to induce more demand destruction.
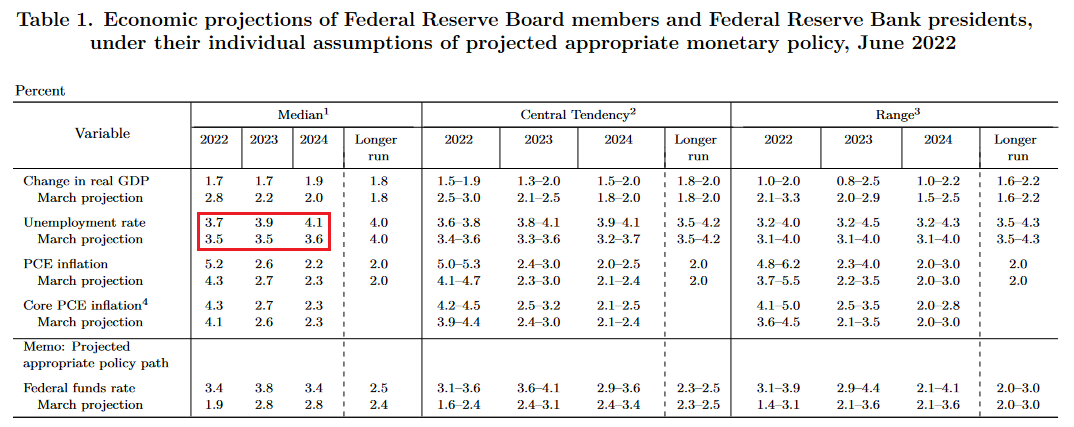
For example, the U.S. unemployment rate held flat at 3.6% in June. However, the FOMC’s latest summary of Economic Projections (SEP) shows officials expect the unemployment rate to hit 3.7% in 2022. Also, the assumptions below assume a “soft landing.”
Please see below:
 Source: U.S. Fed
To explain, the FOMC increased its median inflation expectations and reduced its median real GDP growth expectations relative to officials' March projections. Moreover, with higher inflation requiring a more hawkish policy and slower growth, it also means a higher U.S. unemployment rate.
Thus, the FOMC's optimistic median assumptions have the U.S. unemployment rate hitting 3.7%, 3.9%, and 4.1% in 2022, 2023, and 2024. However, it's still at 3.6%. As a result, we're nowhere near the conditions that support a dovish pivot.
As further evidence, the U6 unemployment rate hit an all-time low in June.
Please see below:
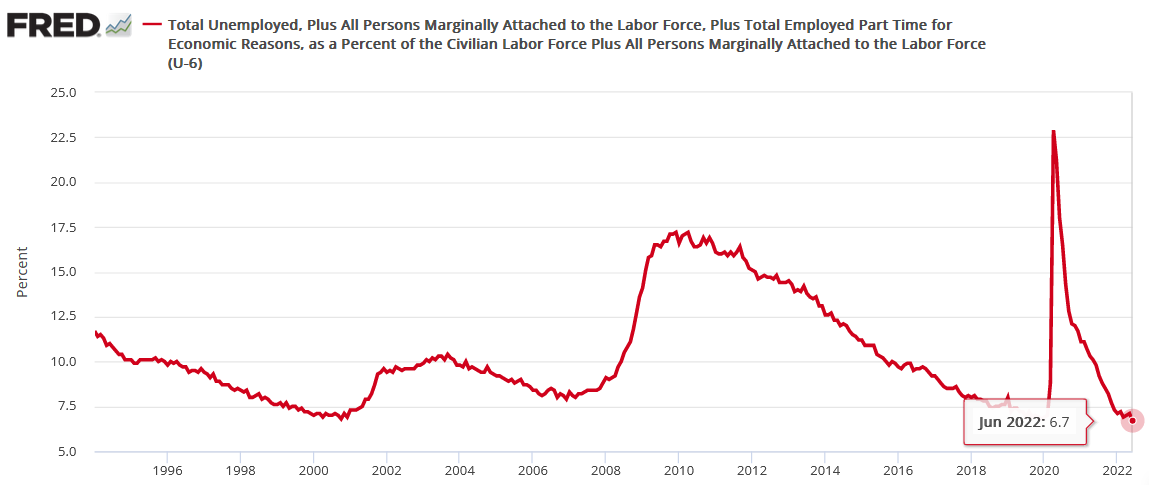
To explain, the U6 unemployment rate tallies the percentage of the U.S. labor force that’s unemployed and underemployed – which means it includes Americans who want full-time work but can only find part-time employment. In May, the figure was 7.1%. However, in June, it declined to 6.7%. Thus, while the Fed wants the unemployment rate to rise, the data is not complying.
As a result, while the Fed’s hawkish disposition has hurt financial assets in 2022, it’s done little to derail the U.S. labor market. Moreover, robust employment is why consumer spending remains elevated and inflation persists. For context, I’ve warned for months that investors’ misjudged the demand side of the inflation equation. Therefore, the Fed needs to push the U.S. federal funds rate much higher to curb the pricing pressures.
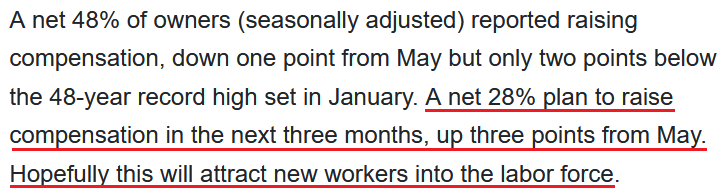
Further supporting the claim, the NFIB released its Small Business Jobs Report on Jul. 7. An excerpt read:
“NFIB’s monthly jobs report shows half of small business owners (seasonally adjusted) reported job openings they could not fill in the current period, down one point from May’s 48-year record high. Twenty-three percent of owners said that labor quality was their top business problem, unchanged from May and in second place behind inflation. Eight percent of owners cited labor costs as their top business problem, historically high.”
More importantly:
 Source: NFIB
Thus, as noted above, the U.S. labor force participation rate declining from 62.3% to 62.2% is profoundly inflationary. Therefore, a continuation of the trend will require U.S. small businesses to raise wages to “attract new workers into the labor force.”
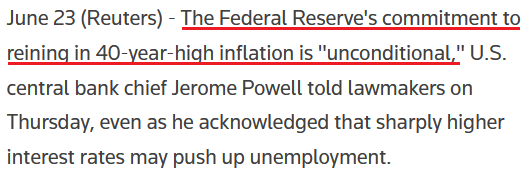
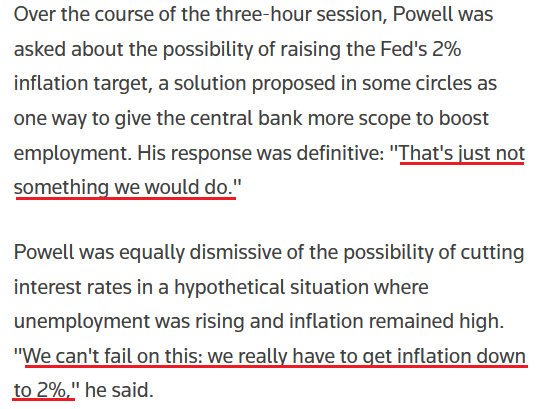
As such, that’s why the Fed is in a lose-lose situation. If officials continue to hike interest rates, demand destruction should eventually unfold and cause a recession. However, if they turn dovish, inflation will rage and cause an even larger collapse down the road. But since the former is the lesser of two evils, I noted on Jun. 24 that Fed Chairman Jerome Powell already knows this. I wrote:
Powell realizes that persistent periods of unanchored inflation are much worse than an impending recession.
Please see below:
 Source: Reuters
In addition
 Source: Reuters
Tighten Your Belt
While the U.S. labor market and its ramifications on inflation highlight the need for more hawkish Fed policy, the quantitative tightening (QT) cycle is taking shape. For context, the runoff starts at $47.5 billion per month and increases to $95 billion per month in September. Moreover, the latter is roughly double the pace of the $50 billion per month maximum that occurred during the 2017 to 2019 QT cycle.
Please see below:
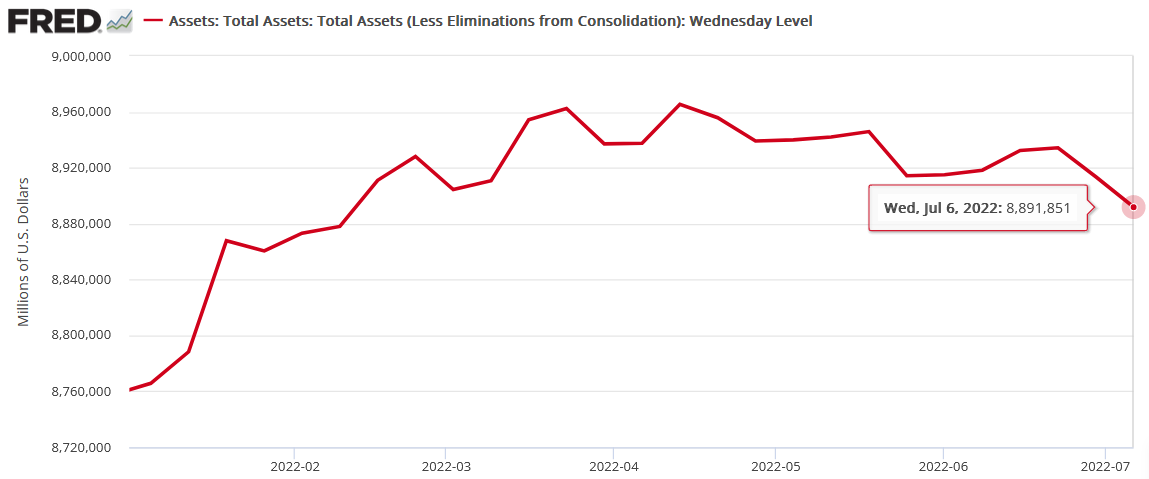
To explain, the red line above tracks the Fed's balance sheet in 2022. Moreover, while QT officially began on Jun. 1, the balance sheet is finally showing a notable decline, dropping by ~$73 billion from its April highs.
Therefore, the liquidity drain is unfolding, and the QT-rate-hike combination is profoundly bearish for the S&P 500 and the GDXJ ETF.
Please see below:
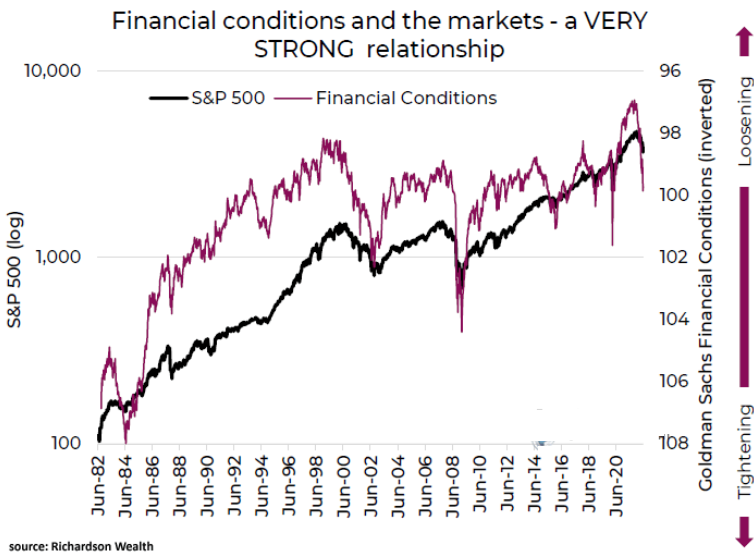
To explain, the black line above tracks the S&P 500, while the purple line above tracks the inverted (down means up) Goldman Sachs Financial Conditions Index (FCI). In a nutshell: when the purple line declines, it means that a stronger U.S. dollar, higher interest rates, and wider credit spreads are curbing demand and making debt more expensive.
If you analyze the relationship, you’ll see that sharp declines in the purple line (FCI rises) often coincide with sharp declines in the S&P 500. Moreover, with the Fed poised to tighten financial conditions even more in the months ahead, the S&P 500 and the GDXJ ETF should suffer as the drama unfolds.
The Bottom Line
With employment and inflation moving further away from the Fed’s goals, the demand destruction necessary to cool the latter is far from present. Moreover, with the NFIB’s data showing that more small businesses plan wage increases in the months ahead, none of this supports inflation normalizing to the Fed’s 2% target. As a result, a more hawkish policy should commence over the medium term, and eventually, a rate-hike-induced recession should push the PMs to their long-term lows.
In conclusion, the PMs were mixed on Jul. 8, as mining stocks underperformed. Moreover, with the USD Index hitting a new 2022 intraday high and the U.S. 10-Year real yield rising to 0.72%, both assets are beneficiaries of the Fed’s war against inflation. In contrast, the PMs should suffer as the liquidity drain intensifies.
Overview of the Upcoming Part of the Decline
- It seems to me that the precious metals market is already in its medium-term decline that is about to take it much lower (to the 2021 lows in case of gold - $1,650 - $1,700). Once that takes place, I expect gold, silver, and mining stocks to start a corrective rally (similar to what we saw in 2013).
- If we see a situation where miners slide in a meaningful and volatile way while silver doesn’t (it just declines moderately), I plan to – once again – switch from short positions in miners to short positions in silver. At this time, it’s too early to say at what price levels this could take place and if we get this kind of opportunity at all – perhaps with gold prices close to $1,600.
- If we see a situation where miners slide in a meaningful and volatile way while silver doesn’t (it just declines moderately), I plan to – once again – switch from short positions in miners to short positions in silver. At this time, it’s too early to say at what price levels this could take place and if we get this kind of opportunity at all – perhaps with gold prices close to $1,600.
- I plan to exit all remaining short positions once gold shows substantial strength relative to the USD Index while the latter is still rallying. This may be the case with gold close to $1,400. I expect silver to fall the hardest in the final part of the move. This moment (when gold performs very strongly against the rallying USD and miners are strong relative to gold after its substantial decline) is likely to be the best entry point for long-term investments, in my view. This can also happen with gold close to $1,400, but at the moment it’s too early to say with certainty.
- The above is based on the information available today, and it might change in the following days/weeks.
You will find my general overview of the outlook for gold on the chart below:
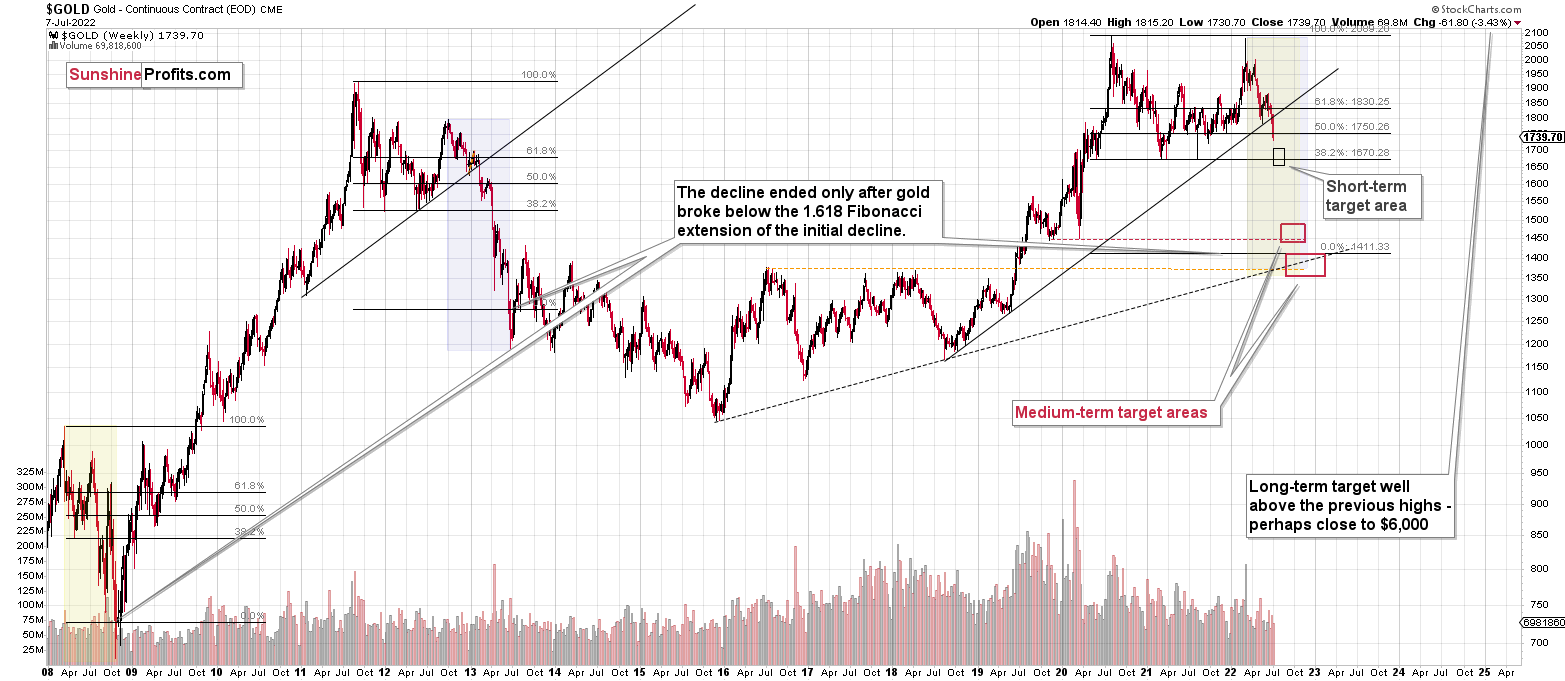
Please note that the above timing details are relatively broad and “for general overview only” – so that you know more or less what I think and how volatile I think the moves are likely to be – on an approximate basis. These time targets are not binding or clear enough for me to think that they should be used for purchasing options, warrants, or similar instruments.
Letters to the Editor
Q: I have some questions. The USD shows a .03 loss. Is that the USD index you're speaking of? Also, I have exited my short positions and am waiting to get in on the long side when Sunshine says so. I traded my $500K account aggressively and used JDST on the short side to make money this time. My concern is that the JDST doesn't correlate all the time with gold/silver. Should I just buy mining stocks or the GDXJ going forward when the market turns? I would appreciate a little insight.
A: The USD Index that I’m describing in my analyses moved lower by 0.13% on Friday. You can find more details about the index over here.
The JDST doesn’t necessarily correlate very highly with gold/silver because it’s not a proxy for gold or silver. It’s a proxy for gold and silver mining stocks, mostly junior mining stocks. Junior mining stocks usually move in tune with the prices of underlying metals (after all, it’s what the miners are either producing or are trying to find and produce/sell in the future). However, things are not that simple. Junior mining shares are ultimately… shares in companies, and companies’ prices are based on their profitability (to a great extent at least). While the prices of precious metals are largely connected with the revenue part of the profit equation, there are also other things that need to be kept in mind. For example, high costs due to high oil prices, or increasing debt costs due to rising interest rates.
I can’t tell you what you should buy, because I can’t – and won’t – provide individual investment advice. I think that for now, the risk-to-reward ratio suggests that the biggest opportunity lies in shorting junior mining stocks (in the case of the next several weeks/months, not necessarily in terms of days) as they are likely to decline more than gold.
After the bottom, I plan to buy miners (GDX and/or GDXJ depending on what seems more ridiculously undervalued – probably junior miners) and I’ll – at least initially – purchase them through ETFs or leveraged ETFs, because of the ease of transaction, and initially I think timing will be the key thing. Also, miners tend to rally the most right after major bottoms, and silver only takes over (rallying more than miners) after several weeks/months.
Again, that’s not investment advice for anyone specifically; I’m just describing my own plans and opinions.
Q: Even with an interest hike next week, that won't be good for a short position? I didn't think the dollar, corrected so much, but I looked at futures only down .194. Is that big? When and at what price was GDXJ when you issued the most recent short position?
A: The FOMC meeting is scheduled for July 26-27, so there’s plenty of time for the market to correct and then decline (or do other things) beforehand.
It’s not the size of the move lower on Friday that mattered, but the fact that it first rallied substantially, and then that this entire rally (and a bit more) was erased before the end of the day. However, I already wrote more about it in today’s analysis, so I don’t want to repeat myself here.
I also discussed the recent trades in the GDXJ in the opening part of today’s analysis, so I think I already replied to this part of your question as well.
Q: Hi. You probably don’t have time to answer this, but I’ve been sitting on the sidelines listening to what you have to say for the last seven months. I was neither long nor short. You said that you wouldn’t be either long or short at this time. Do you think it would be a good idea for me to take 25% of my money and buy silver bullion right now and save the rest to invest if it goes lower, or just save all my money and invest if it goes lower? Thanks.
A: Hello, I do have time to answer this, but I don’t have the ability to provide individual investment advice, which is what you are asking for in your question.
I don’t know and can’t tell you if what you wrote would be a good idea for you. I can tell you what I think about the market in general, and it’s up to you to decide if you plan to make purchases in the way that you outlined, or if a different approach would be better for you.
It’s not only not legal for me to provide individual investment advice, but it’s also not possible through the newsletter arrangement. This requires lots of research, one-on-one discussions about goals, circumstances, limitations, and so on. Although the CFA charter implies that I passed 3 exams, that also included insights regarding providing investment advice. I’m not a registered investment adviser, and I don’t provide those services.
I care too much about anyone I do business with to just provide a mediocre service, so I’m neither providing investment advice nor pretending to do it.
So, I’ll briefly ask several questions that might help you come up with an answer on your own instead.
What if silver declines to $7-14, because that’s the range where I expect it to bottom at the end of this decline? Yes, it’s a broad range, because a lot “depends” on many factors. And after silver bottoms there, what if it rallies over $100 over the course of the next few years (because that also seems likely to me)? Would you be happy with the purchase of some of the silver bullion a bit earlier? Would it matter to you financially / psychologically? The latter might be even more important than the former, because, for example, if buying some silver initially allows you to then be more patient about waiting for the final bottom (at extremely low prices), then it actually might be a better choice than to wait with the entire capital only to panic-buy using the entire capital well above the bottom, just because the psychological pressure to get back into the market is so enormous then.
What if I’m wrong about all this, and silver just bottomed? If it moves over $100 without an additional decline? How would you feel about the current decision to move in with a part of your capital at this time?
I can’t and won’t make this decision for you. I can only make the decisions for myself based on what I know about myself, and I can say that my ability and willingness to take a risk is above average.
The bottom line is: please, treat my analyses as inspiration for your own decisions that you base on your in-depth knowledge of yourself and not as something that you “have to adhere to, to the letter.” Of course, discussing matters with an investment adviser might also be a good idea.
Summary
Summing up, it seems that while the medium-term trend in the precious metals sector remains down, we might see a corrective upswing soon. The short-term outlook is currently too neutral in my view to justify any trading position at this time.
Whether the corrective upswing starts right away, or after an additional decline, doesn’t change the fact that right now the risk to reward ratio doesn’t support any positions. I expect to see another shorting opportunity soon, perhaps as early as this week, but even if not, then later this month.
After the final sell-off (that takes gold to about $1,350-$1,500), I expect the precious metals to rally significantly. The final part of the decline might take as little as 1-5 weeks, so it's important to stay alert to any changes.
As always, we'll keep you – our subscribers – informed.
To summarize:
Trading capital (supplementary part of the portfolio; our opinion): No positions
Long-term capital (core part of the portfolio; our opinion): No positions (in other words: cash)
Insurance capital (core part of the portfolio; our opinion): Full position
Whether you’ve already subscribed or not, we encourage you to find out how to make the most of our alerts and read our replies to the most common alert-and-gold-trading-related-questions.
Please note that we describe the situation for the day that the alert is posted in the trading section. In other words, if we are writing about a speculative position, it means that it is up-to-date on the day it was posted. We are also featuring the initial target prices to decide whether keeping a position on a given day is in tune with your approach (some moves are too small for medium-term traders, and some might appear too big for day-traders).
Additionally, you might want to read why our stop-loss orders are usually relatively far from the current price.
Please note that a full position doesn't mean using all of the capital for a given trade. You will find details on our thoughts on gold portfolio structuring in the Key Insights section on our website.
As a reminder - "initial target price" means exactly that - an "initial" one. It's not a price level at which we suggest closing positions. If this becomes the case (as it did in the previous trade), we will refer to these levels as levels of exit orders (exactly as we've done previously). Stop-loss levels, however, are naturally not "initial", but something that, in our opinion, might be entered as an order.
Since it is impossible to synchronize target prices and stop-loss levels for all the ETFs and ETNs with the main markets that we provide these levels for (gold, silver and mining stocks - the GDX ETF), the stop-loss levels and target prices for other ETNs and ETF (among other: UGL, GLL, AGQ, ZSL, NUGT, DUST, JNUG, JDST) are provided as supplementary, and not as "final". This means that if a stop-loss or a target level is reached for any of the "additional instruments" (GLL for instance), but not for the "main instrument" (gold in this case), we will view positions in both gold and GLL as still open and the stop-loss for GLL would have to be moved lower. On the other hand, if gold moves to a stop-loss level but GLL doesn't, then we will view both positions (in gold and GLL) as closed. In other words, since it's not possible to be 100% certain that each related instrument moves to a given level when the underlying instrument does, we can't provide levels that would be binding. The levels that we do provide are our best estimate of the levels that will correspond to the levels in the underlying assets, but it will be the underlying assets that one will need to focus on regarding the signs pointing to closing a given position or keeping it open. We might adjust the levels in the "additional instruments" without adjusting the levels in the "main instruments", which will simply mean that we have improved our estimation of these levels, not that we changed our outlook on the markets. We are already working on a tool that would update these levels daily for the most popular ETFs, ETNs and individual mining stocks.
Our preferred ways to invest in and to trade gold along with the reasoning can be found in the how to buy gold section. Furthermore, our preferred ETFs and ETNs can be found in our Gold & Silver ETF Ranking.
As a reminder, Gold & Silver Trading Alerts are posted before or on each trading day (we usually post them before the opening bell, but we don't promise doing that each day). If there's anything urgent, we will send you an additional small alert before posting the main one.
Thank you.
Przemyslaw Radomski, CFA
Founder, Editor-in-chief

