

Briefly: gold and the rest of the precious metals market are likely to decline in the next several weeks/months and then start another powerful rally. Gold’s strong bullish reversal/rally despite the USD Index’s continuous strength will likely be the signal confirming that the bottom is in.
Welcome to this week's Gold Investment Update. Predicated on last week’s price moves, our most recently featured outlook remains the same as the price moves align with our expectations. On that account, there are parts of the previous analysis that didn’t change at all in the earlier days, which will be written in italics.
The key thing that we saw this week is an initial slide, and then a comeback. Does it change anything? Most likely not. Why not? Please read more for details.
Let’s start today’s analysis with a recap of what recently happened on the fundamental front.
The Weekly Fundamental Roundup
While the rapid rise in real yields and the USD Index headlined the early part of the week, the Bank of England’s (BoE) emergency QE intervention reduced some of the momentum. Moreover, while the S&P 500 resumed its sell-off on Sep. 29, gold, silver and mining stocks were relative outperformers.
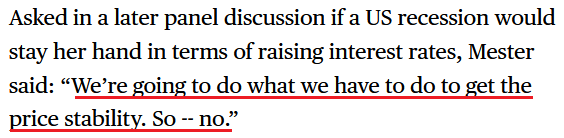
However, with the hawkish realities that helped upend the PMs in 2021 and 2022 still going strong, more downside should commence over the next few months. For example, Cleveland Fed President Loretta Mester said on Sep. 29:
“At this point price stability is still job one. We have to get that out of the way. As inflation moves back down, then those decisions become judgments about when do you hold, how long do you hold, when do you move things back down. But right now the focus is on making sure that we’ve achieved price stability.”
She added:
“In my [Summary of Economic Projections] SEP I have inflation coming down, but we have to bring interest rates up to get that downward shift in inflation,”
Thus, while the financial markets continue to react negatively, Fed officials remain united in curbing inflation. More importantly, Mester said that a recession would not reduce the Fed’s resolve.
Please see below:
 Source: Bloomberg
Amplifying that sentiment, St. Louis Fed President James Bullard said on Sep. 29:
“We’re determined to get to the right level of the policy rate in order to put meaningful downward pressure on inflation here…. If you look at the dots, it does look like the committee is expecting a fair amount of additional moves this year.”
Furthermore, Bullard noted how the bond market sell-off shows that Fed officials’ message was “digested by markets and does seem to be the right interpretation.” As a result, his revelation highlights their deliberate attempt to reshape investors’ expectations.
Please see below:
 Source: Bloomberg
To that point, I warned on Apr. 6 that investors were ignoring the warning signs at their own peril. I wrote:
Please remember that the Fed needs to slow the U.S. economy to calm inflation, and rising asset prices are mutually exclusive to this goal. Therefore, officials should keep hammering the financial markets until investors finally get the message.
Moreover, with the Fed in inflation-fighting mode and reformed doves warning that the U.S. economy “could teeter” as the drama unfolds, the reality is that there is no easy solution to the Fed’s problem. To calm inflation, it has to kill demand. As that occurs, investors should suffer a severe crisis of confidence.
Thus, with the projection proving prescient, the S&P 500 and the GDXJ ETF are down by 18.8% and 38.3% from their Apr. 6 closes. In addition, the analysis still holds. Inflation is nowhere near the Fed’s 2% target and higher interest rates are needed to alleviate the pricing pressures.
Likewise, while most ‘macro’ strategists labeled supply-chain disruptions as the primary culprit for inflation, I warned numerous times that demand is much more resilient than the consensus realizes. As a result, a higher U.S. federal funds rate (FFR) should materialize, and the continued liquidity drain is profoundly bearish for gold, silver and mining stocks.
Hawkish Calls
With Q3 earnings season ramping up in mid-October, Wall Street banks are the first to debut their results. However, with material prints hitting the wire in recent days, the findings are bullish for the FFR, real yields and the USD Index.
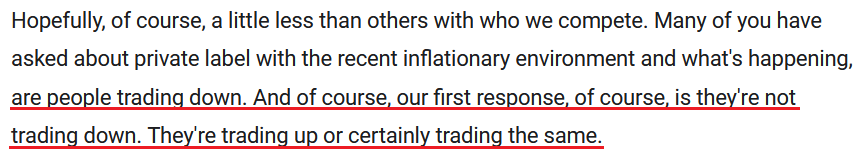
For example, Costco – the third-largest retail company in the U.S. – released its fourth-quarter earnings on Sep. 22. CFO Richard Galanti said during the Q4 earnings call:
“We've seen minor [inflation] improvement in a few areas. But all in, pressures from higher commodity prices, higher wages and higher transportation costs and supply chain disruptions. They're still present, but we are seeing just a little light at the end of the tunnel; and if you recall in the third quarter, we indicated that price inflation overall was about 7% plus for us.
“For the fourth quarter and talking with our merchants, the estimated price inflation overall was about 8%, a little higher on the food and sundries side, a little lower on fresh foods, and both higher and lower on the non-food side.”
So while Galanti noted that minor inflation progress signals “a little light at the end of the tunnel,” the important point is that Costco’s consolidated inflation increased from ~7% in Q3 to ~8% in Q4. Therefore, while the Fed’s 12 25 basis point rate hikes in 2022 have had some impact (which is expected), we’re still a long way from 2%. As such, Costco’s experience highlights why the FFR should rise materially in the months ahead.
In addition, Galanti’s rhetoric signals that demand remains resilient. For context, consumers often swap brand name products for generic labels when they’re suffering financially. However, Galanti noted that he hasn’t seen a downward shift in Costco customers’ spending habits, and the revelation highlights why the Fed’s inflation fight will be so challenging.
Please see below:
 Source: Costco/The Motley Fool
Continuing the theme, I’ve warned repeatedly that the U.S. labor market is an extremely important variable when projecting future Fed policy. Moreover, with job losses a profound warning sign of dwindling demand, the bulls need the labor market to collapse to reduce inflation and engineer a dovish pivot. To explain, I wrote on Sep. 22:
Powell said on Sep. 21 that “we need to have softer labor market conditions” as supply and demand “continues to be out of balance.” Likewise, he cited how U.S. job openings greatly outnumber unemployed Americans and how the imbalance helps fuel wage inflation.
However, if you’ve been reading my daily Gold & Silver Trading Alert, I’ve covered this extensively, and none of this is news to you. Yet, with the crowd now cheering on a higher unemployment rate, labor market destruction has become the new bull case.
Please see below:
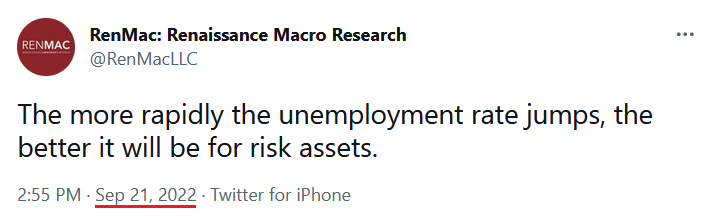
Well, despite RenMac’s obvious assessment being many months too late, the reality is that the U.S. labor market remains in a healthy position; and as long as that’s the case, the Fed has the green light to hammer inflation.
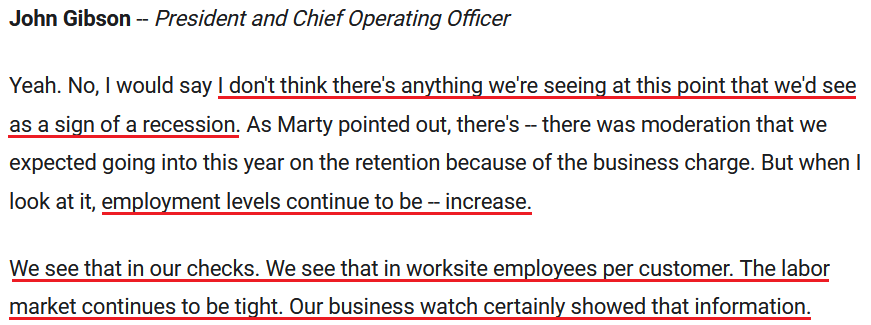
To that point, Paychex released its first-quarter earnings on Sep. 27. For context, the company provides human resource, payroll and benefits outsourcing services for small and medium-sized businesses. CEO Marty Mucci said during the Q1 earnings call:
“We continue to regularly monitor our key leading indicators for signs of changes to the macroeconomic trends; and while we have seen some moderation in key issues, we have not yet seen any significant changes.
“As an example, the latest Paychex IHS small business employment watch showed that workers of U.S. small businesses continue to benefit from higher wages. New jobs continue to grow but at a more moderated pace, and job growth at U.S. small businesses remains resilient even in the face of a tight labor market and inflation pressures.
“Employment levels at our existing clients have continued to increase as they're finding more people to fill those positions.”
As such, while the post-GFC crowd prays for demand destruction, the data suggests otherwise. Moreover, since a resilient U.S. labor market is bullish for wage inflation, it’s also bullish for the FFR, real yields and the USD Index.
Also, with COO John Gibson still seeing solid employment, investors’ recession calls are early because resilient employment should keep demand uplifted for the foreseeable future.
Please see below:
 Source: Paychex/The Motley Fool
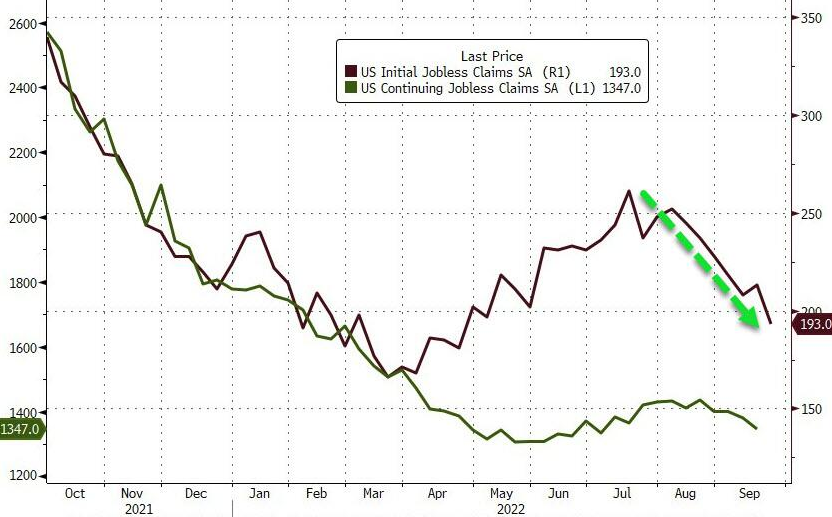
As further evidence, the U.S. Department of Labor (DOL) revealed on Sep. 29 that initial unemployment claims came in at “193,000, a decrease of 16,000 from the previous week’s revised level.”
Furthermore, with initial and continuing unemployment claims declining recently, they also signal that the U.S. labor market remains on solid footing.
Please see below:
 Source: Bloomberg/ZeroHedge
To explain, the purple and green lines above track the initial and continuing jobless claims. If you analyze the right side of the chart, you can see that the former has rolled over and the latter is also heading south. Therefore, fewer Americans are filing for unemployment than last month, and a higher FFR is needed to reduce labor demand enough to normalize inflation.
The Bottom Line
While gold, silver, and mining stocks outperformed the general stock market on Sep. 29, the BoE-induced decline in the USD Index and the U.S. 10-Year real yield have helped increase their appeal. However, with the pullbacks having much more semblance than substance, the Fed’s inflation fight should help push both metrics higher over the medium term. As a result, we expect the PMs to head in the opposite direction.
In conclusion, the PMs were mixed on Sep. 29, as mining stocks diverged from gold and silver. However, the PMs are no longer oversold, and further gains require more than just short-covering. Thus, with their medium-term technical and fundamental outlooks still profoundly bearish, the ‘buy the dip crowd’ should pay the price like they did throughout 2021 and 2022.
What to Watch for Next Week
With more U.S. economic data releases next week, the most important are as follows:
- Oct. 3: ISM Manufacturing PMI
As a nationwide survey, the ISM's data provides a credible look into the growth, employment and inflation developments in the U.S.
- Oct. 4: JOLTS job openings
While the results are lagged, official government data is essential to monitor due to its implications for future Fed policy.
- Oct. 5: S&P Global Composite PMI, ISM Services PMI
The ISM’s service sector results enhance the findings from its manufacturing survey, while S&P Global’s nationwide survey will include additional information about the health of the U.S. economy.
- Oct. 6: Challenger job cuts
Since fewer layoffs are bullish for Fed policy, the job cuts data will tell us how many Americans were let go in September.
- Oct. 7: U.S. nonfarm payrolls, unemployment rate, labor force participate rate, average hourly earnings
Resilient employment and wage inflation are profoundly hawkish, so healthy results should only embolden the Fed. Thus, as long as the U.S. labor market remains uplifted, the FFR should seek higher ground.
All in all, economic data releases impact the PMs because they impact monetary policy. Moreover, if we continue to see higher employment and inflation, the Fed should keep its foot on the hawkish accelerator. If that occurs, the outcome is profoundly bearish for the PMs.
Technically Speaking
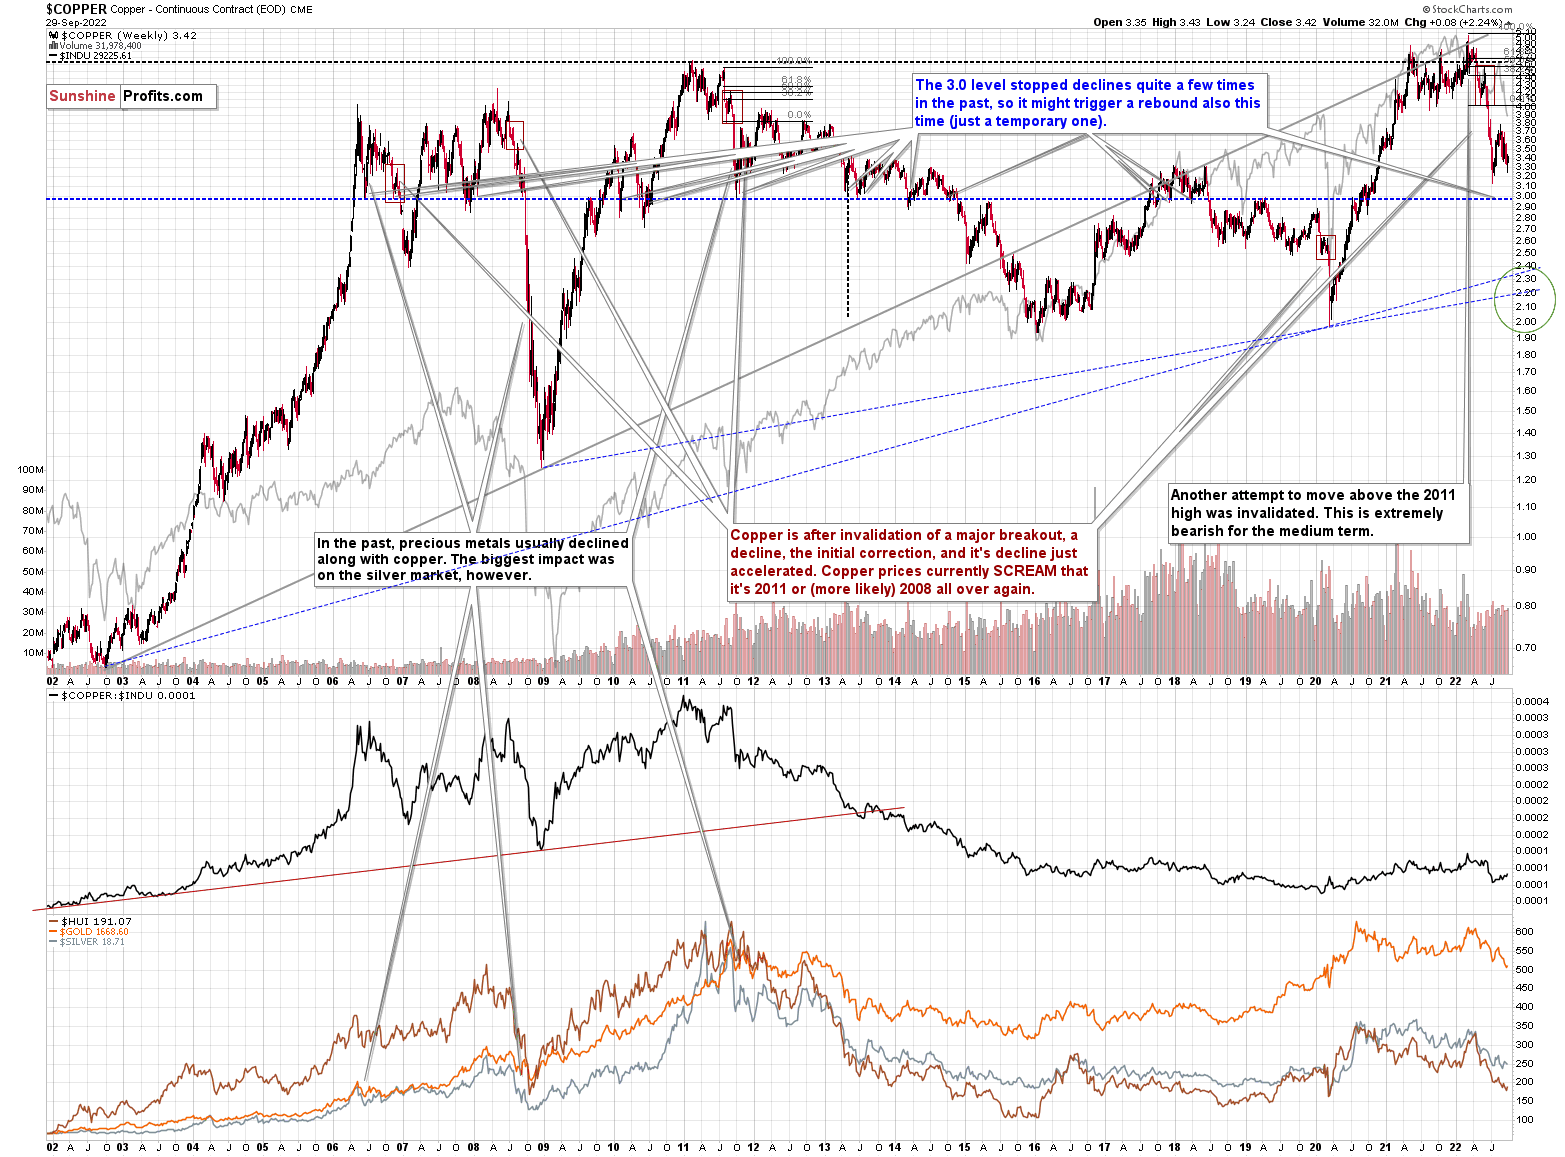
Let’s start today’s technical discussion with a quick check on copper prices.
Practically, everything that I wrote about it last week (and in the previous weeks/months) remains up-to-date:
Copper recently CLEARLY invalidated another attempt to move above its 2011 high. This is a very strong technical sign that copper (one of the most popular commodities) is heading lower in the medium term.
It seems to me that there might be some kind of smaller corrective upswing or a pause when copper moves to about $3.0, but that it would then decline profoundly once again, only to bottom in the $2.0-2.4 area. That’s where we have rising, long-term support lines and also the previous – 2016 and 2020 – lows.
Interest rates are going up, just like they did before the 2008 slide. What did copper do before the 2008 slide? It failed to break above the previous (2006) high, and it was the failure of the second attempt to break higher that triggered the powerful decline. What happened then? Gold declined, but silver and mining stocks truly plunged.
Again, copper is after invalidation of a major breakout, a decline, the initial correction, and its decline just accelerated. Copper prices currently SCREAM that it’s 2011 or (more likely) 2008 all over again. This is extremely bearish for mining stocks (especially juniors) and silver.
No market moves in a straight line, up or down, but since we just saw a corrective upswing, the downtrend might now resume.
Based on the recent short-term move lower, it seems that the downtrend has already resumed. This week’s rebound is barely visible from the long-term point of view, and it doesn’t change anything.
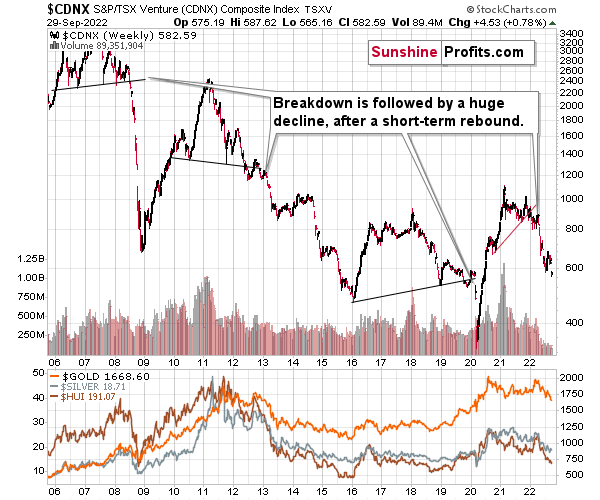
Having said that, let’s check junior miners’ really big picture.
I previously commented on the above chart in the following way:
The Toronto Stock Exchange Venture Index includes multiple junior mining stocks. It also includes other companies, but juniors are a large part of it, and they truly plunged in 2008.
In fact, they plunged in a major way after breaking below their medium-term support lines and after an initial corrective upswing. Guess what – this index is after a major medium-term breakdown and a short-term corrective upswing. It’s likely ready to fall – and to fall hard.
So, what’s likely to happen? We’re about to see a huge slide, even if we don’t see it within the next few days.
Having said that, let’s turn to gold.
Let’s start with context:
Between 2020 and now, quite a lot happened, quite a lot of money was printed, and we saw a war breaking out in Europe. Yet, gold failed to rally to new highs.
In fact, it’s trading very close to its 2011 high, which tells you something about the strength of this market. It’s almost absent.
Truth be told, what we see in gold is quite in tune with what we saw after the 2011 top, and in particular, shortly after the 2012 top. The long-term gold price chart below provides details.
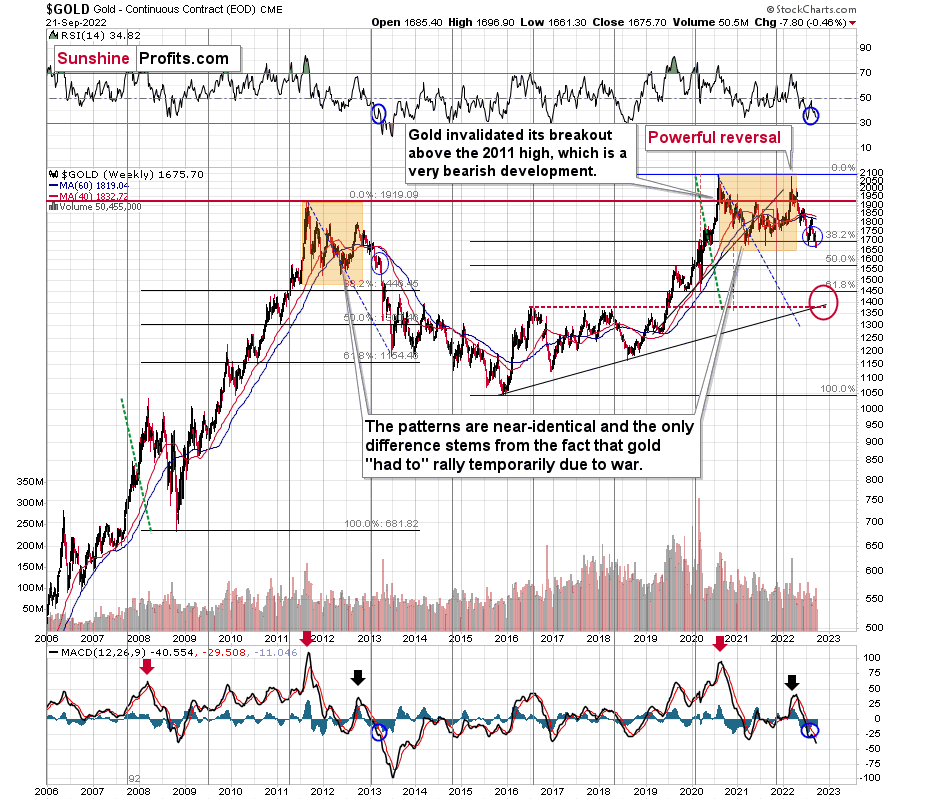
Basically, the key thing about gold’s long-term chart is that it doesn’t show any important changes. The downtrend continues in tune with the 2013 price action, and this week’s intraweek rally is barely visible.
Gold is sometimes forced to react to some geo-political events as the safe-haven buying kicks in, but these moves are usually short-term lived. Looking at long-term charts helps to keep things in proper perspective.
Consequently, my previous comments remain up-to-date:
Based on the above chart, it’s quite clear that the situation that is now being repeated. The patterns marked with orange rectangles and blue ellipses are almost identical (also in the MACD indicator, and to a lesser extent in the RSI indicator).
Sure, the situations are not identical, as this time we had a Russian invasion of Ukraine that pushed gold temporarily higher. Other than that, the situations are extremely similar.
Based on the stage of the self-similarity and the confirmed breakdown below the $1,700 level, gold is now likely to slide.
Based on the analogy to 2013, it’s not only likely to slide, it’s likely to slide profoundly in a sharp manner. These may be the last days or hours before the slide fully begins.
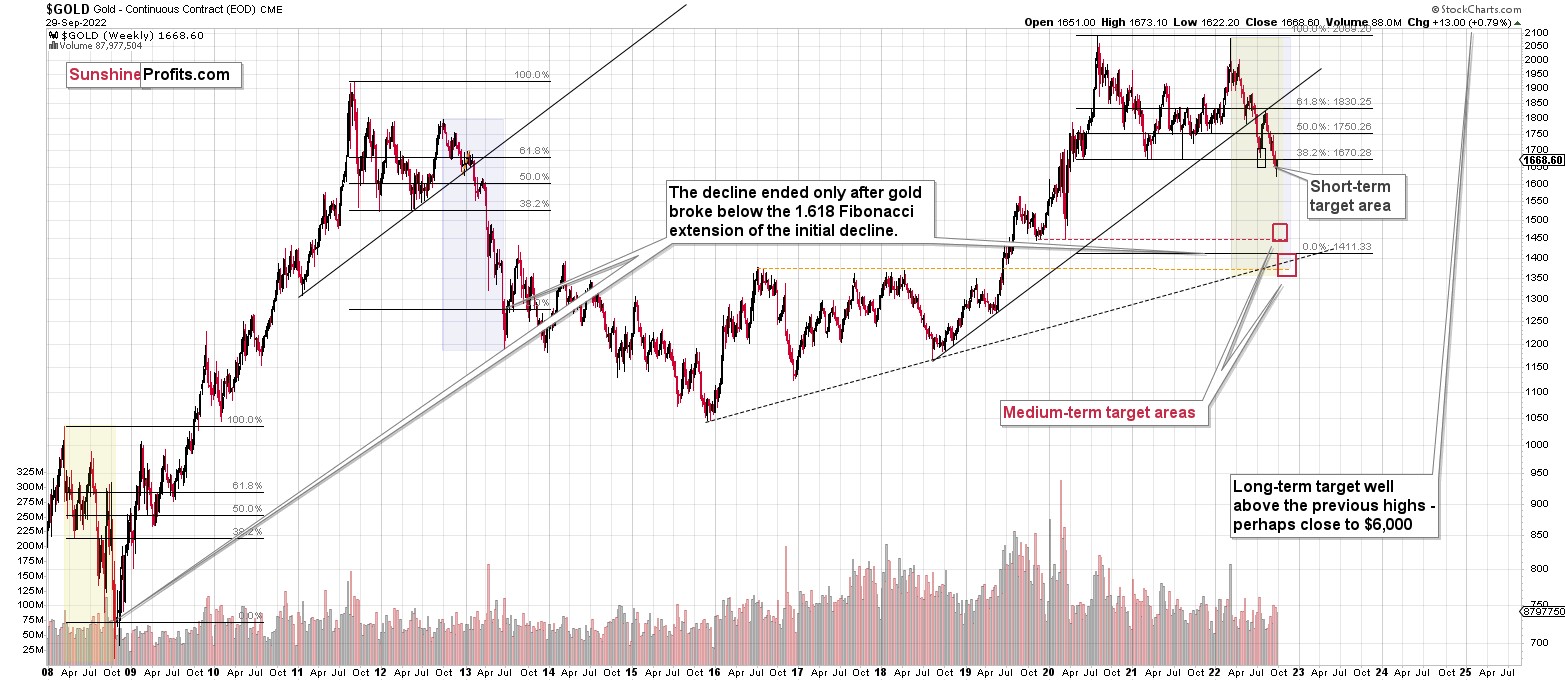
How low is gold likely to go during this upcoming decline? Perhaps as low as its 2020 low – to the $1,450-1,500 area.
I realize this is far from the current price, but nonetheless, this target area appears justified in my opinion. There are two important Fibonacci retracements based on the 2015-2020 rally that gold can bounce from (it recently bounced from the 38.2% retracement). These are 50% and 61.8% retracements.
The support provided by the 61.8% retracement is strengthened by the 2020 low and the support provided by the 50% retracement is strengthened by the 2019 high.
However, based on gold’s self-similarity to 2013, it seems that we’re about to see a slide that’s bigger than what we’ve been seeing so far this year. This time – based on the similarity – gold is likely to decline profoundly, but no longer in the back-and-forth mode. If gold formed its next local low at the 50% retracement (so at about $1,560), then it might do so still within the declining, short-term trend channel (sometime in September).
However, if gold is to stick to the link to 2013, then it should decline more rapidly. In this case, the technique that can help us estimate the short-term target is the one that says that after a breakdown from a trend channel, price is likely to move approximately by as much as the height of the previous trend channel. In this case, gold could break below the trend channel soon and then decline even more. Based on the height of the trend channel, the above means that a move to the 61.8% retracement as the next downside target is more likely than a move to the 50% retracement.
I previously wrote that the above-mentioned decline in gold would likely be linked to a breakdown in the EUR/USD below 1, and we already saw both: decline in gold, and a breakdown in the EUR/USD below 1. The implications remain bearish.
Let’s zoom in on what happened in 2013 after the analogous rebound.
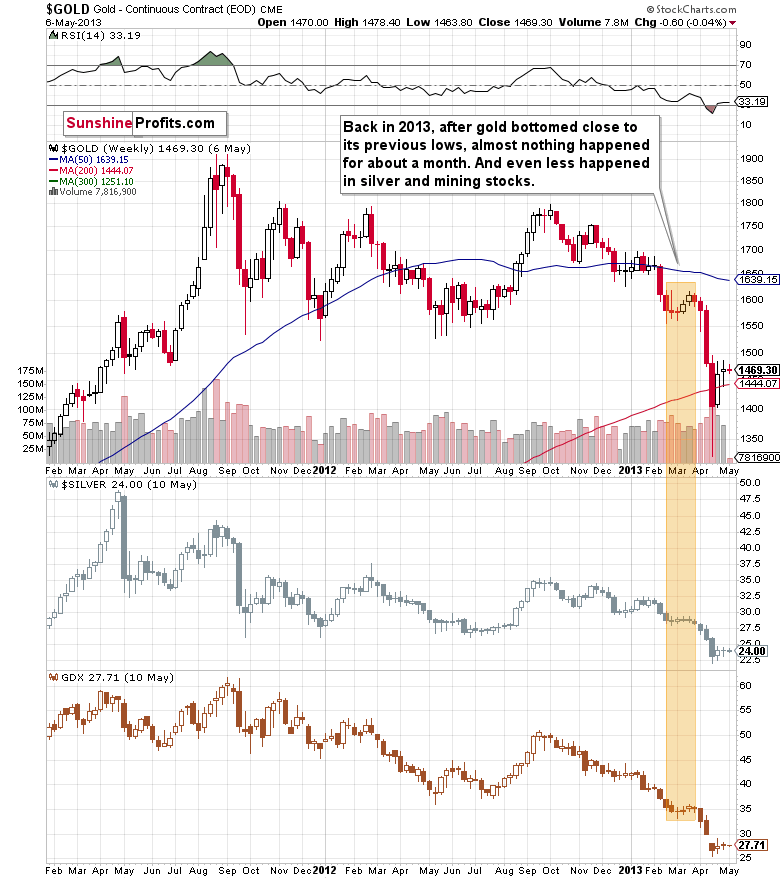
Well, gold consolidated for a few weeks and plunged only after that consolidation.
That’s what we saw recently as well. Of course, we haven’t seen the big plunge yet, but the other parts of the recent price patterns are very, very similar to what we saw in 2013.
Please note that back in 2013, there was a visible intraweek pause right before the two powerful weekly slides. Consequently, seeing a corrective upswing this week does not break the analogy – it’s in tune with it.
The key thing about historical analogies is that they tend to rhyme and not repeat themselves to the letter. 100% identical moves take place from time to time, but it’s not a good idea to expect this to happen each and every time. History can rhyme in all sorts of ways, and the broader look one has, the better they will be able to detect which part of the price / volume movement is being repeated, and what is just meaningless “price noise”.
In other words, on a more-or-less basis, gold is doing exactly what it’s been doing in April 2013, right before the biggest part of the slide.
This means that right now is probably one of the worst moments to be exiting the short position in the precious metals sector, and perhaps one of the best ones to be entering the short position if one doesn’t already have it at their desired size.
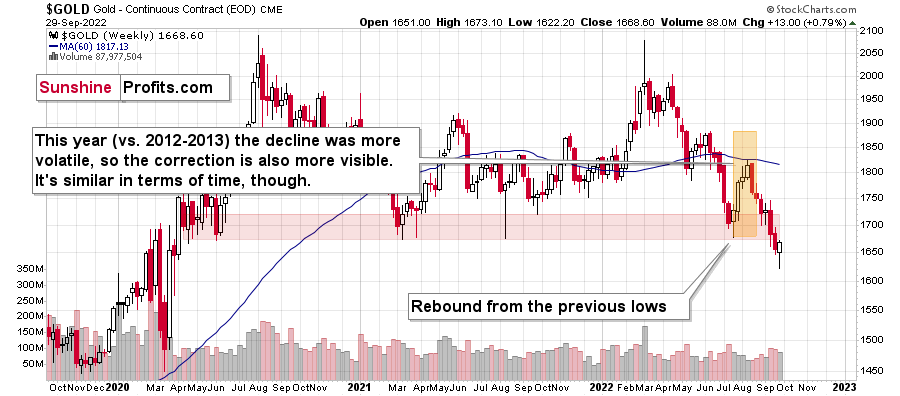
Having said that, let’s zoom in to see gold’s short-term price moves.
Gold moved higher very recently, and… It didn’t change anything.
I talked about it in yesterday’s video analysis, but to make a long story short, gold didn’t get back above the previous – very strong – support zone. This means that it’s currently verifying a very strong resistance zone. It’s unlikely to break it, simply because the resistance is so strong and because the link to 2013 remains in place.
The real rates are still climbing and so is the USD Index (despite the current quick correction), and these are the two main fundamental drivers of the gold price.
So, both: technicals and fundamentals favor lower gold prices, not higher ones.
This means that my previous comments on gold remain up-to-date:
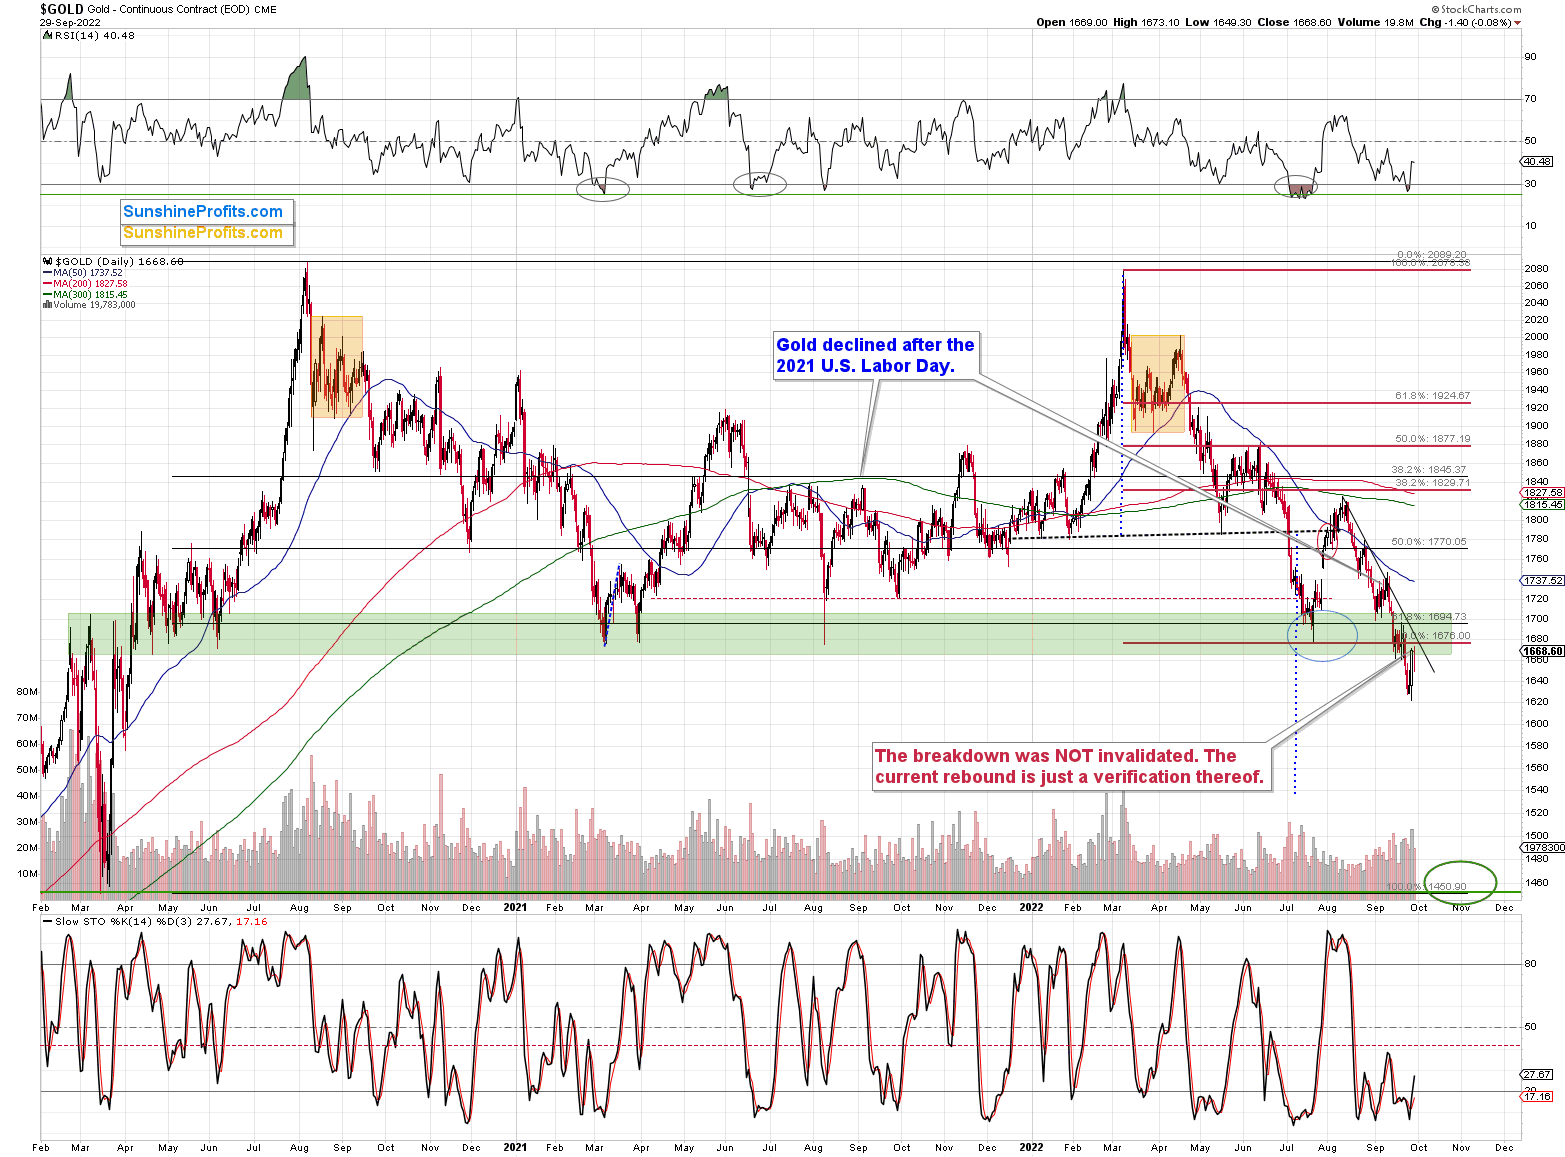
What didn’t happen in the gold market is most important. Namely, gold didn’t move back above $1,700. This breakdown is now more than verified for the first time since mid-2020.
Having said that, let’s take a look at the silver market.
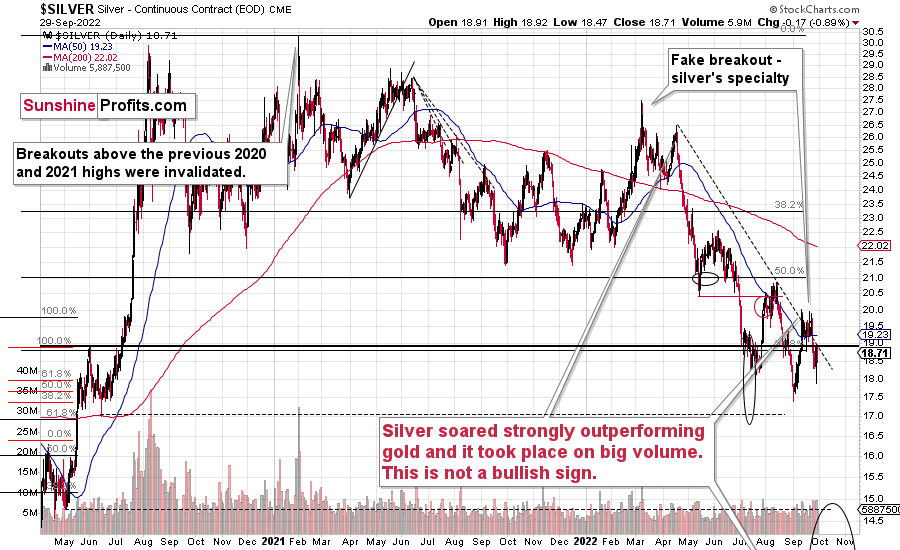
Silver just moved back to its previous resistance line once again. The breakout above this line was already invalidated, so it remains doubtful if silver is able to move – and hold – above it.
In today’s pre-market trading, silver jumped higher, and it’s once again above the declining dashed resistance line, but it’s unlikely to hold those gains. What appears more likely is that we’ll see another “fakeout” that is then followed by severe declines in silver.
Silver is known for its fake moves – at least to those who have been following my analyses for some time. I even marked one of the previous “fakeouts” (not breakouts) on the above chart. There’s also one that’s not marked, but it’s quite prominent. The early-2021 high that formed when everyone and their brother wanted to buy silver based on popular forum posts. At that time, I warned that while most of the featured reasons for silver to move higher were correct, the timing was awful. Over and over, people fail to grasp the obvious thought that just because something is very likely to happen, it absolutely doesn’t mean that it’s likely to happen soon.
Anyway, silver prices soared above the 2020 high only to invalidate the breakout almost immediately, and those who bought then have been on the losing side of the trade practically ever since.
Now, how do we “know” (there are no certainties in the markets, so one can just “assume” or “hypothesize” what’s going to happen, but never “know”) that silver is now faking the breakout above the declining dashed resistance line?
Because we’re looking at what’s happening in other markets, and where the markets are relative to similar patterns from history. And mining stocks have already verified their breakdowns to new lows, and silver is also (just like gold and miners) repeating its 2013 performance. You can see more details on silver’s long-term chart.
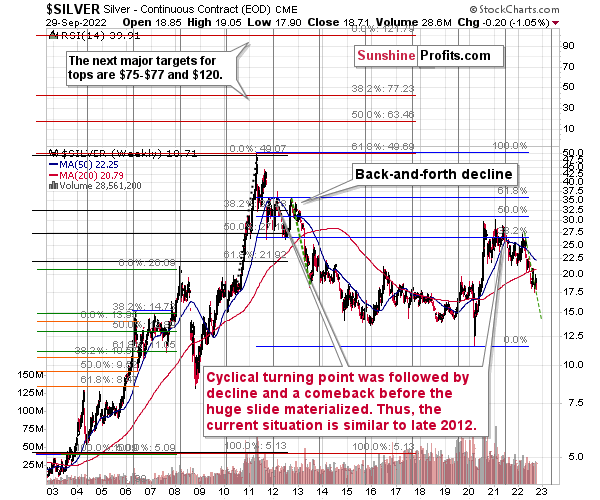
As you can see on the above chart, silver corrected about 50% of the previous downswing, and this correction ended at about $30, a long time ago. Ever since, silver has been declining, and even the outbreak of war in Europe didn’t make silver rally above that level.
On the above chart, you can see how silver first topped in 2011, then declined and formed another top at the cyclical turning point. Next, it declined once again – to the previous lows. After that, silver rallied (in 2012 and 2022), and it topped between its 50-week moving average (marked in blue) and the previous top. Now silver is declining in a back-and-forth manner (you can see it more clearly on the previous short-term silver chart).
Back in 2012, these were just the early days of a gargantuan decline, and the same appears likely to be the case this time. Interest rates are going up after all, and the Fed is determined to quench inflation.
Let’s not forget that rising interest rates are likely to negatively impact not just commodities, but practically all industries. This will likely cause silver’s price to decline profoundly, as silver’s industrial demand could be negatively impacted by lower economic growth (or a decline in economic activity).
Besides, please note that silver didn’t even manage to rally as much as copper (which tried to move to new highs recently) or most other commodities, thus being rather weak.
Consequently, it seems that silver will need to decline profoundly before it rallies (to new all-time highs) once again.
Having said that, let’s take a look at what happened in mining stocks.
History tends to repeat itself. Not to the letter, but in general. The reason is that while economic circumstances change and technology advances, the decisions to buy and sell are still mostly based on two key emotions: fear and greed. They don’t change, and once similar things happen, people’s emotions emerge in similar ways, thus making specific historical events repeat themselves to a certain extent.
For example, right now, gold stocks are declining similarly to how they did in 2008 and in 2012-2013.
As gold was practically forced to rally based on geo-political events (UK’s QE and tactical nuclear warfare scare), so were gold stocks.
Did it change anything technically? No, it changed nothing.
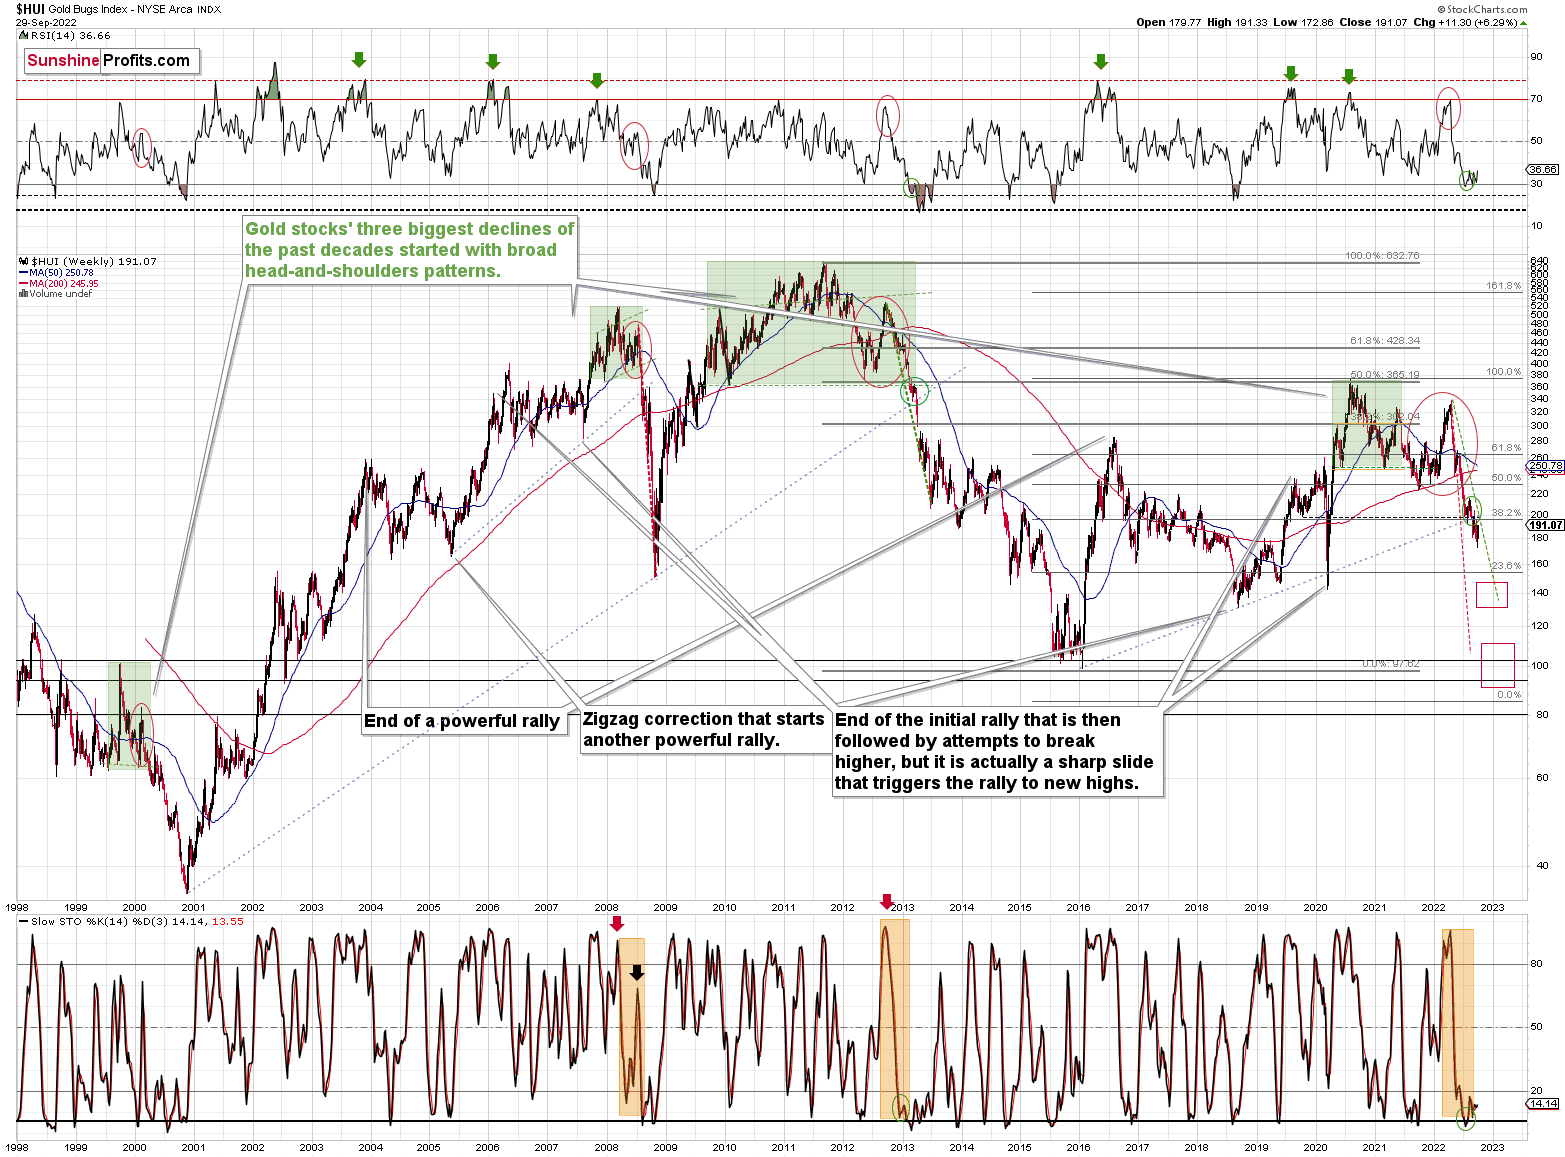
The HUI Index remains below their long-term support line, which now turned into strong resistance.
This resistance is currently at about 200, so even if gold stocks rally some more right now, they are likely to remain in a major downtrend.
Looking at this chart is particularly useful while estimating whether it’s a good idea to close the current short position or not.
If you look at the clear analogy to 2013, it becomes rather obvious where the really big potential is – in the huge decline, not in the small corrective upswings.
That’s what we don’t want to miss, not the tiny counter-trend moves. Therefore, I think that keeping the short position intact remains justified by the risk to reward ratio.
Moreover, over a month ago, I commented on the above chart in the following way:
On a short-term basis, we see a short-term (only) downside target of around 200. That’s about 10% below yesterday’s (Thursday’s) closing price. There are several reasons for it:
- It’s a round number, and those tend to be more important psychologically than other numbers.
- That’s where we have the rising medium-term support line based on the 2016 and 2018 lows. The temporary move below this line triggered a massive rally in 2020.
- That’s where we have the 61.8% Fibonacci retracement level based on the entire 2016-2020 rally.
The 200 target was then reached and briefly breached, and it was followed by a rally.
Analogy-wise, it’s what we previously saw in 2013. It might not be obvious which part of the chart to look at, as the upswings are not that visible from the long-term point of view, so I marked them with green ellipses (also in RSI and Stochastic).
This time, the corrective upswing was a bit bigger, but overall the self-similarity remains remarkably up-to-date. If it continues (and it’s likely to continue), then gold stocks are about to slide.
How low can the HUI Index fall during the next big downswing?
As it’s the case with gold and silver, a move back to the 2020 lows is definitely in the cards. Please note that this level is also strengthened (as support) by other major lows: the 2019, 2014, and 2008 ones.
However, I wouldn’t rule out a move even lower on a temporary basis. If gold were to decline to about $1,450-1,500, it would mean that it would double its current 2022 decline. If the HUI Index does that, it will move below 150.
So, all in all, 120-150 is my current target area for the upcoming slide in the HUI Index.
All right, let’s zoom in and see how mining stocks declined in 2008.

Back then, the GDXJ ETF was not yet trading, so I’m using the GDX ETF as a short-term proxy here.
The decline took about 3 months, and it erased about 70% of the miners’ value. The biggest part of the decline happened in the final month, though.
However, the really interesting thing about that decline – that might also be very useful this time – is that there were five very short-term declines that took the GDX about 30% lower.
I marked those declines with red rectangles. After that, a corrective upswing started. During those corrective upswings, the GDX rallied by 14.8-41.6%. The biggest corrective upswing (where GDX rallied by 41.6%) was triggered by a huge rally in gold, and since I don’t expect to see anything similar this year, it could be the case that this correction size is an outlier. Not paying attention to the outlier, we get corrections of between 14.8% and 25.1%.
Fast forward to the current situation. Let’s take a look at the GDXJ ETF.
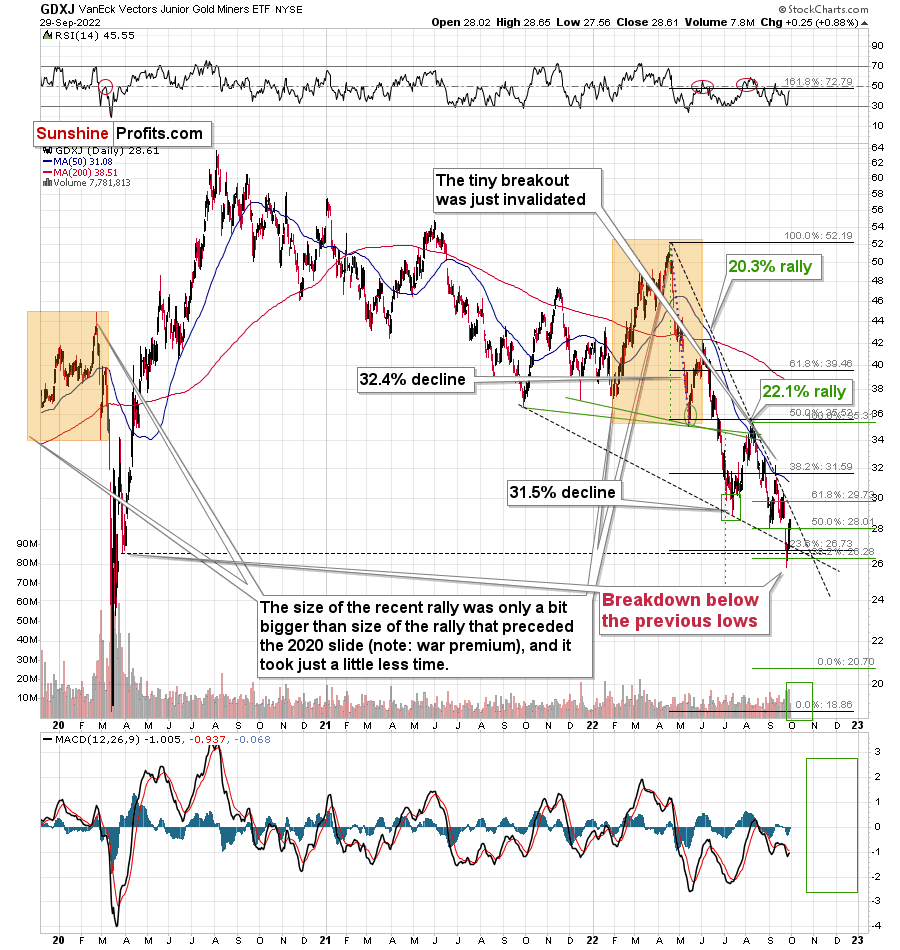
When I previously commented on the GDXJ in a flagship weekly analysis it was right after a close at $29.23.
Yesterday, it closed at $28.61. So, it’s lower.
Yes, it plunged recently, and now it moved back to the upper border of the previous price gap, but that’s quite normal. That’s another thing that I spoke about in yesterday’s video analysis.
This is a verification of a breakdown, just like what we see in gold, and what we see from long-term point of view in case of the HUI Index. That’s not bullish.
What we saw very recently appears to be analogous to the back-and-forth trading that we saw in the first half of October 2008. Of course, these patterns are not identical, but they were never supposed to be identical. They are similar enough for the analogy to remain intact, though, and for the implications to remain extremely bearish.
Over a week ago, I wrote following about GDXJ’s 1-hour chart:
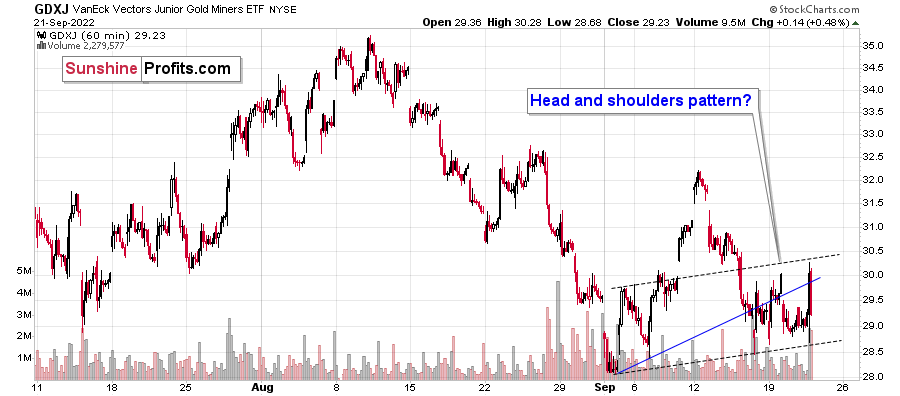
In yesterday’s analysis, I wrote that juniors (the GDXJ ETF) are now moving sideways and that they might create a head-and-shoulders pattern once they break below $28.5. Based on yesterday’s decline, they are now quite close.
The above will imply a decline to at least $25. The emphasis here is on “at least,” because there’s strong support at the 2020 lows. Such a move would likely correspond to a move to the 2020 low in gold.
Despite yesterday’s intraday volatility, the GDXJ ended the day only slightly higher, and the head-and-shoulders pattern could be completed any day – or hour – now.
Indeed, juniors declined shortly thereafter and completed the bearish head-and-shoulders formation – and then they declined more.
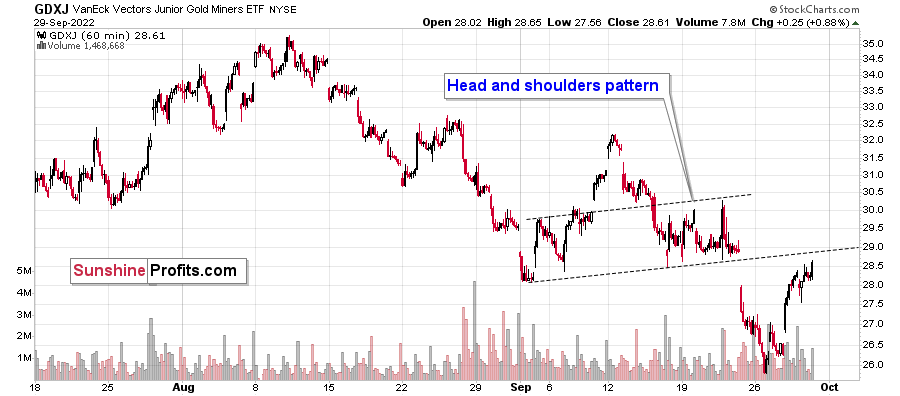
We now see a comeback to the previous neck level and to the upper border of the price gap.
It’s likely that the resistance will hold and that we’ll see lower prices shortly.
Meanwhile, the relative performance of junior miners compared to senior miners continues to deteriorate in a medium-term trend.
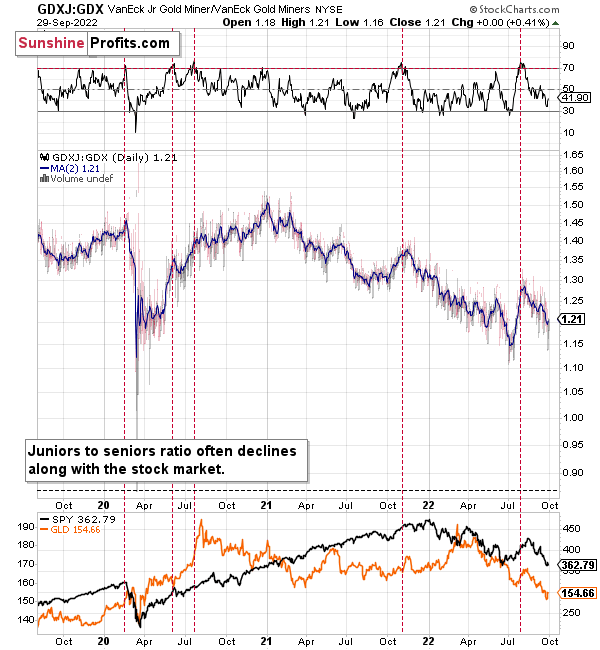
During their previous upswing, juniors rallied relative to seniors, and the situation was recently excessive from the short-term point of view. At least the RSI indicator suggested that juniors were now likely to decline relative to seniors.
It seems that this next move lower in juniors to seniors is already underway. The RSI seems to have topped above 70, and the ratio itself seems to have formed a top too.
This implies bigger declines in the GDXJ in the future.
Also, let’s not forget about the forest while looking at individual trees. By that, I mean looking at how gold stocks perform relative to gold. That’s one of the major indications that the current situation is just like what we saw at the 2012 top.
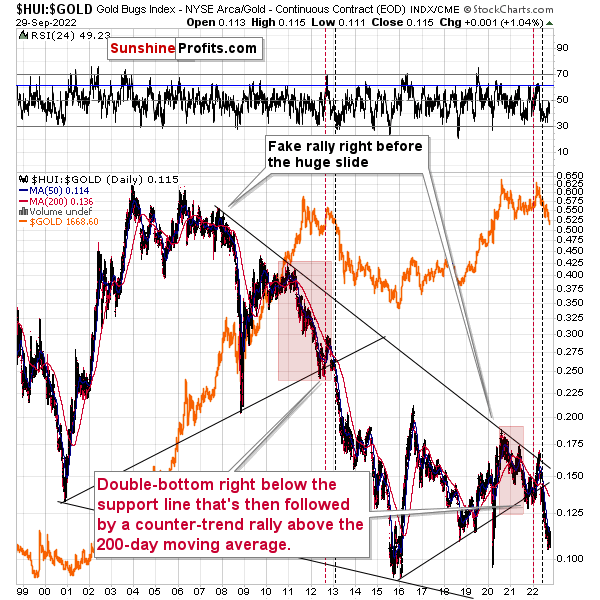
The situation in the gold stock to gold ratio is similar to what we saw in late 2012 and early 2013. The HUI to gold ratio invalidated its first attempt to break lower (marked with red, dashed lines), but after a corrective upswing, it then broke lower more decisively. That’s what I marked using black, dashed lines.
If history is to rhyme, we’re about to see a profound decline. In fact, we’re likely already past its beginning.
Also, please note that the pattern that we currently see, which started in early 2016, is somewhat similar to what happened between 2003 and 2008.
Back in 2008, the breakdown from the consolidation resulted in sharply lower ratio values and much lower prices of gold stocks.
So, if the situation is analogous to 2012-2013, we’re likely to see a big decline in the following weeks/months, and if it’s analogous to 2008, we’re likely to see an enormous decline in the following weeks/months.
Declining stock prices would only add fuel to the bearish fire (after all, gold stocks are… just stocks) and that’s exactly what’s likely to happen.
The technical picture in the case of world stocks remains extremely bearish, and my previous comments on it were just confirmed.
After a brief pause, the freefall continues, just like in 2008. This has profoundly bearish implications for the mining stocks that declined severely back then.
Here’s what I’ve been writing about the above chart for quite a few weeks now:
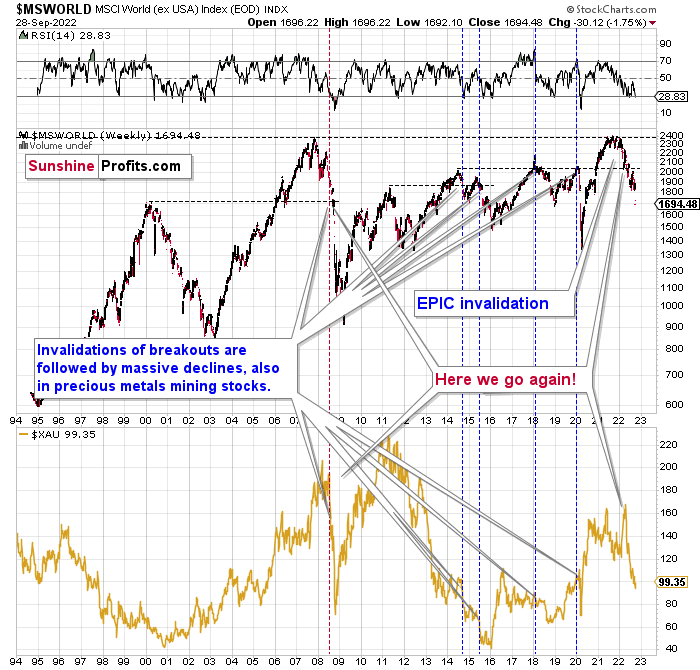
World stocks have already begun their decline, and based on the analogy to the previous invalidations, the decline is not likely to be small. In fact, it’s likely to be huge.
For context, I explained the ominous implications on Nov. 30. I wrote:
Something truly epic is happening in this chart. Namely, world stocks tried to soar above their 2007 high, they managed to do so, and… failed to hold the ground. Despite a few attempts, the breakout was invalidated. Given that there were a few attempts and that the previous high was the all-time high (so it doesn’t get more important than that), the invalidation is a truly critical development.
It's a strong sell signal for the medium - and quite possibly for the long term.
From our – precious metals investors’ and traders’ – point of view, this is also of critical importance. All previous important invalidations of breakouts in world stocks were followed by massive declines in mining stocks (represented by the XAU Index).
Two of the four similar cases are the 2008 and 2020 declines. In all cases, the declines were huge, and the only reason why they appear “moderate” in the lower part of the above chart is that it has a “linear” and not a “logarithmic” scale. You probably still remember how significant and painful (if you were long, that is) the decline at the beginning of 2020 was.
All those invalidations triggered big declines in the mining stocks, and we have “the mother of all stock market invalidations” at the moment, so the implications are not only bearish, but extremely bearish.
World stocks have declined below their recent highs, and when something similar happened in 2008, it meant that both stocks and gold and silver mining stocks (lower part of the chart) were about to slide much further.
The medium-term implications for mining stocks are extremely bearish.
However, let’s get back to the short- and medium-term points of view.
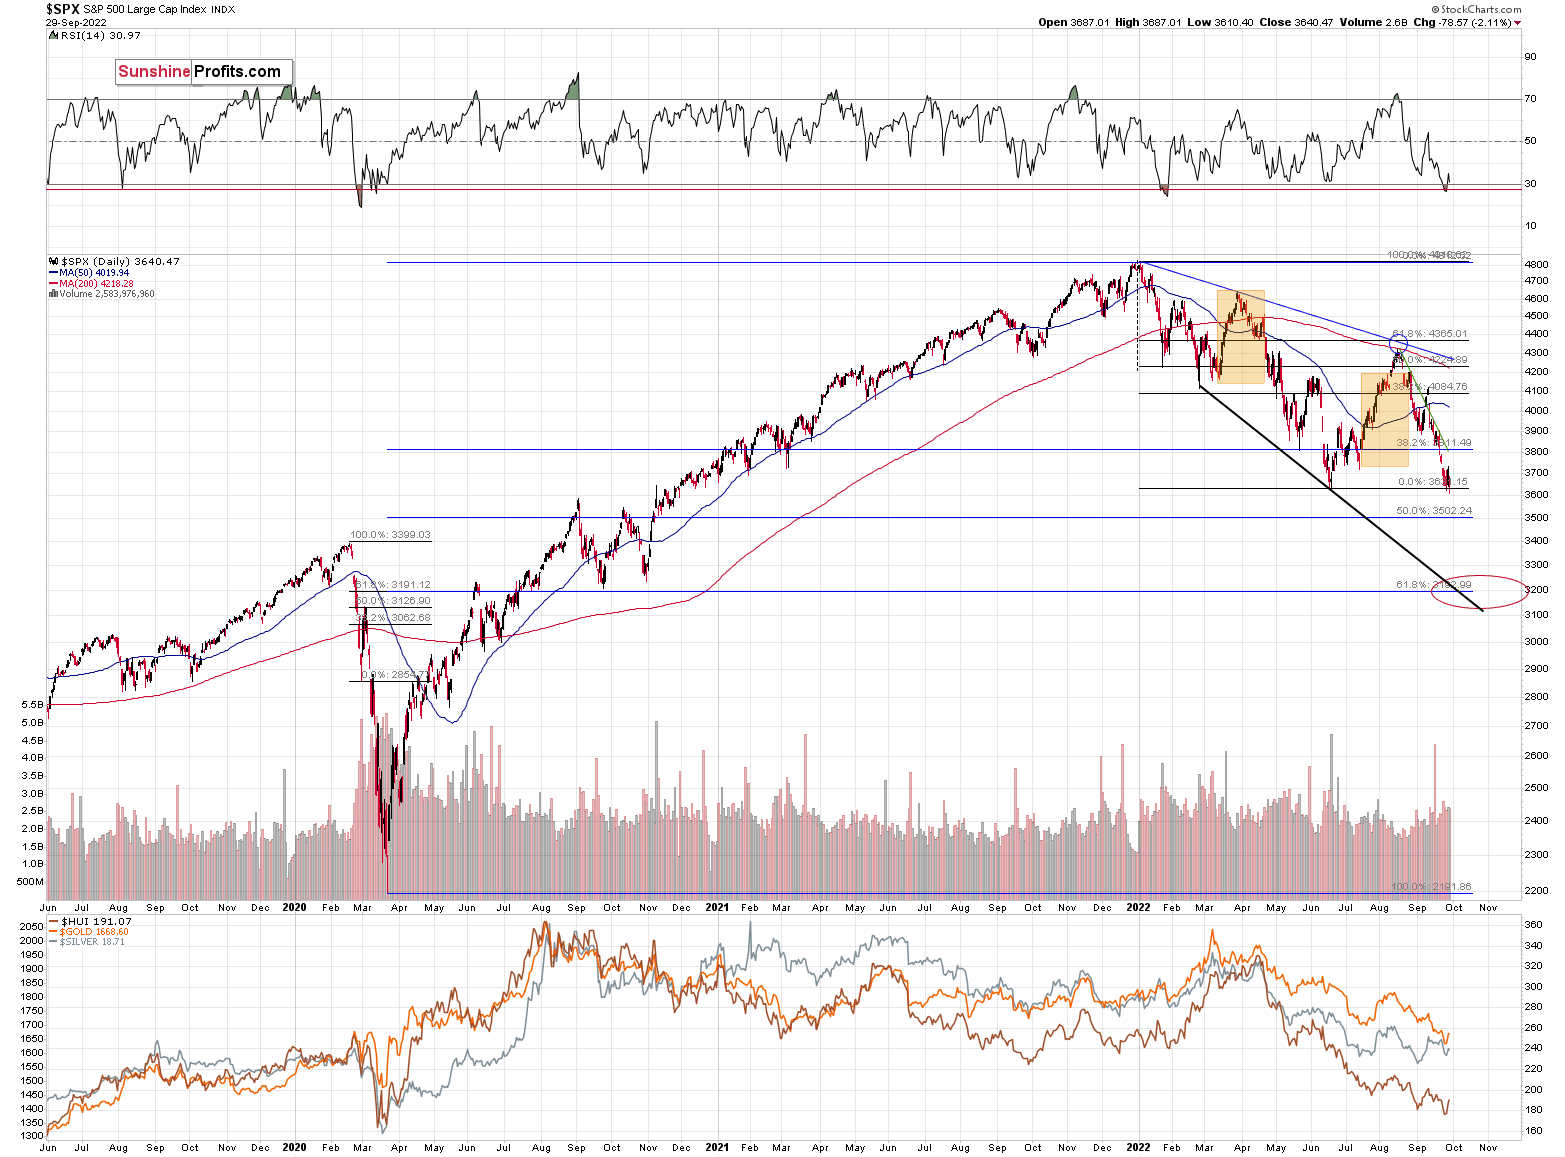
Just when investors and traders thought that the breakdown below the June lows in the S&P 500 Index was invalidated and that stocks are about to soar… They declined to new yearly lows.
Yes, yesterday’s session marked lowest daily close of 2022 and lowest intraday low. Here’s a zoomed-in picture:
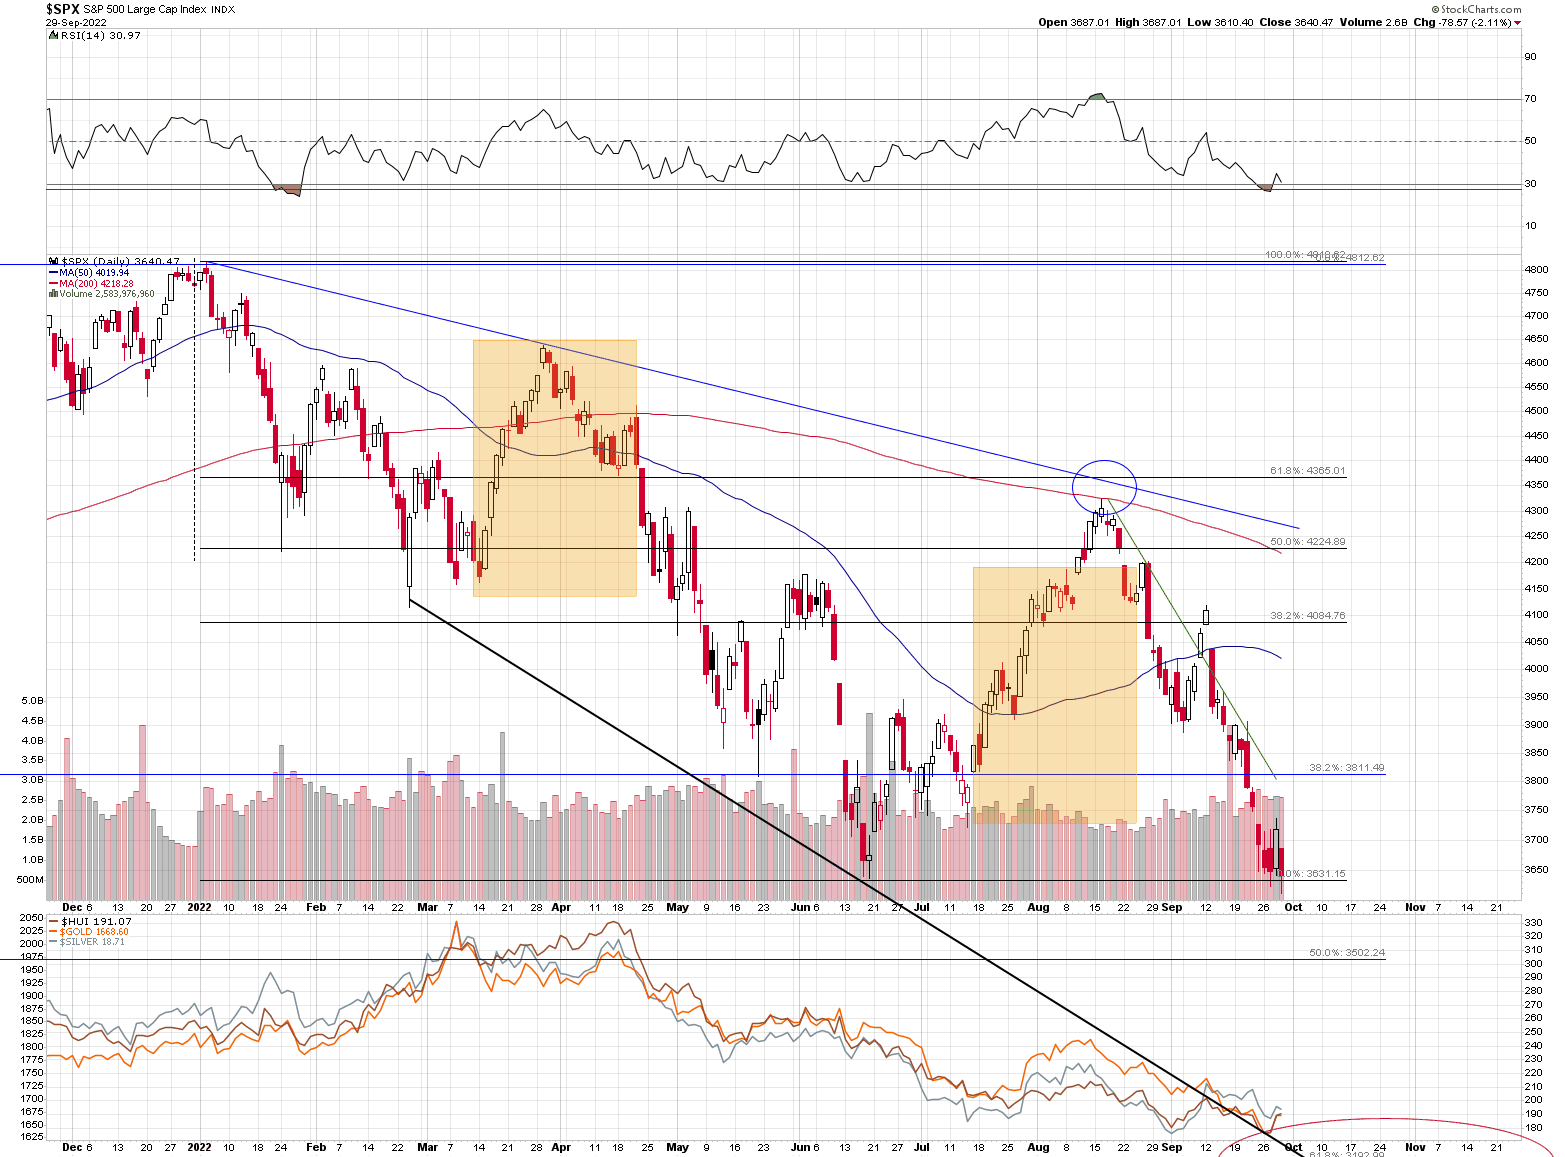
Despite Wednesday’s rally, stocks were unable to rally yesterday. This shows just how weak the bulls are.
The theoretically important support in the form of June lows failed. All it was able to generate was a single-session rally. I don’t want to call this rally “pathetic”, but I can’t find a better word to describe it, either.
Overnight, stocks made another attempt to rally above June’s lowest close, and they once again failed. At the moment of writing these words, the S&P 500 futures are trading slightly below this level.
As interest rates are likely to go up, the stock market is likely to go down – perhaps as low as 3,500 or 3,200 on a short-term basis – and then – after a correction – even lower.
Most interestingly, though, such a decline would likely have a devastating effect on the prices of mining stocks (especially junior mining stocks) and silver. There might be some impact on gold, too.
The above would also be in tune with an extra rally in the USD Index. After all, less competitive exports are not that favorable for the U.S. economy.
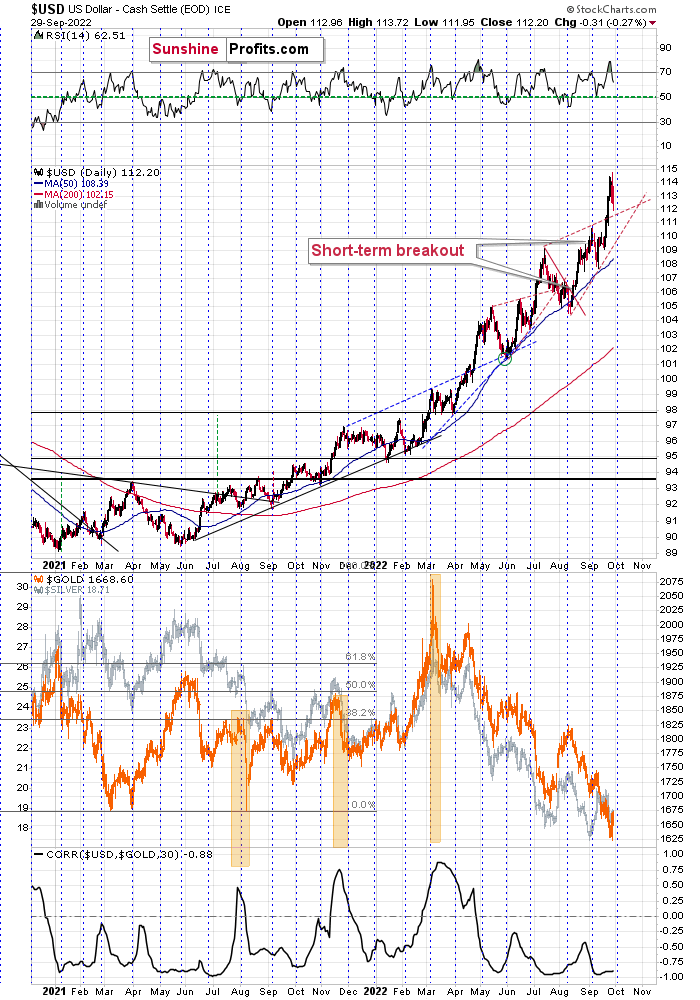
The rally in the USD Index simply continues. While the USDX is verifying the breakout above the September highs, gold is verifying its breakdown below $1,700 (and July lows in general). Both these moves are likely to continue. The implications are particularly bearish for junior mining stocks as they are likely to be hammered by both declining gold and declining stock prices.
Please note that it’s the turn of the month, and that’s when the USD Index tends to reverse its course. Recently, it was mostly the case that the USDX rallied shortly after the new month started. This tendency is currently bullish for the USDX and bearish fore the precious metals sector.
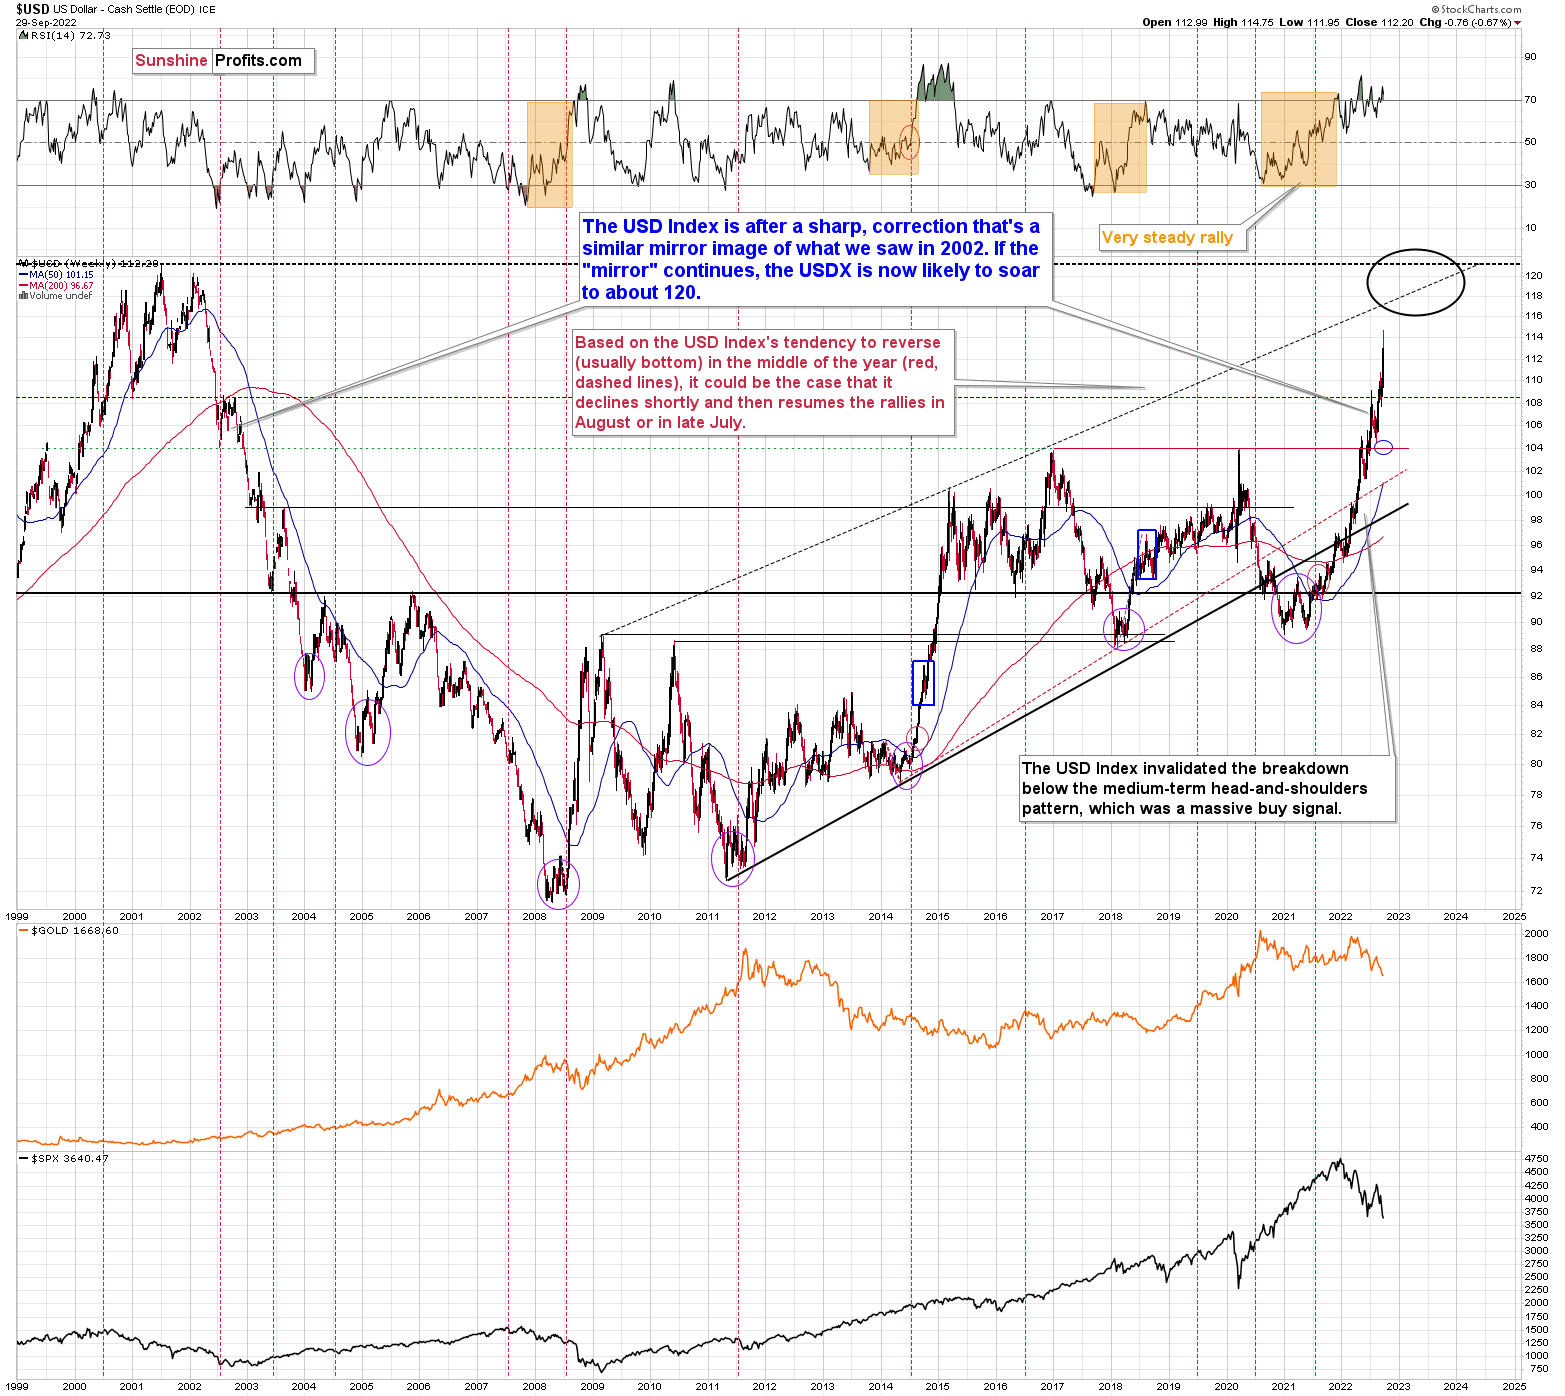
From the long-term point of view, the USD Index is currently rallying in approximately the mirror image of how it declined in 2002. Based on this, it seems that one shouldn’t be surprised by a rather quick move from the current levels to about 120 – USD Index’s long-term highs. Of course, the implications for the precious metals market are profoundly bearish.
This doesn’t rule out quick corrections along the way – those don’t interrupt the big, weekly/monthly moves at all, and they don’t break the analogy.
Still, since the USD Index has already corrected around the 106 level, just like it did in 2022, it seems that it can now soar to 118-120 area without bigger corrections. This is extremely bearish for gold and the rest of the precious metals sector.
This week’s correction doesn’t necessarily invalidate the above as it’s not significant from the medium-term point of view.
Overview of the Upcoming Part of the Decline
- It seems to me that the corrective upswing is over or about to be over, and that the next big move lower is already underway.
- If we see a situation where miners slide in a meaningful and volatile way while silver doesn’t (it just declines moderately), I plan to – once again – switch from short positions in miners to short positions in silver. At this time, it’s too early to say at what price levels this could take place and if we get this kind of opportunity at all – perhaps with gold prices close to $1,600.
- I plan to switch from the short positions in junior mining stocks or silver (whichever I’ll have at that moment) to long positions in junior mining stocks when gold / mining stocks move to their 2020 lows (approximately). While I’m probably not going to write about it at this stage yet, this is when some investors might consider getting back in with their long-term investing capital (or perhaps 1/3 or 1/2 thereof).
- I plan to return to short positions in junior mining stocks after a rebound – and the rebound could take gold from about $1,450 to about $1,550, and it could take the GDXJ from about $20 to about $24.
- I plan to exit all remaining short positions once gold shows substantial strength relative to the USD Index while the latter is still rallying. This may be the case with gold prices close to $1,400 and GDXJ close to $15 . This moment (when gold performs very strongly against the rallying USD and miners are strong relative to gold after its substantial decline) is likely to be the best entry point for long-term investments, in my view. This can also happen with gold close to $1,400, but at the moment it’s too early to say with certainty.
- The above is based on the information available today, and it might change in the following days/weeks.
You will find my general overview of the outlook for gold on the chart below:
Please note that the above timing details are relatively broad and “for general overview only” – so that you know more or less what I think and how volatile I think the moves are likely to be – on an approximate basis. These time targets are not binding nor clear enough for me to think that they should be used for purchasing options, warrants, or similar instruments.
Summary
Summing up, it seems that the biggest part of the 2013-like decline is taking place right now, and – while I can’t make any promises regarding performance - it seems likely to me that our big profits are about to become huge, and then ridiculously big in the relatively near future.
The current quick upswing most likely doesn’t change anything. Fundamentals and technical continue to point to lower precious metals values in the following weeks / months. The current geo-political-news-based rally is likely to serve as nothing more than just a verification of the breakdown below the previous lows in gold.
Things might happen very fast in the coming days, and if I plan to make any adjustments, I’ll keep you informed. Still, if the targets that I’m mentioning in the “Trading” part of the summary are reached, I think that profits should be taken off the table without an additional confirmation from me. I will probably get on the long side of the market at that time, but I’ll send a confirmation if I decide to do so.
After the final sell-off (that takes gold to about $1,350-$1,500), I expect the precious metals to rally significantly. The final part of the decline might take as little as 1-5 weeks, so it's important to stay alert to any changes.
As always, we'll keep you – our subscribers – informed.
To summarize:
Short-term outlook for the precious metals sector (our opinion on the next 1-6 weeks): Bearish
Medium-term outlook for the precious metals sector (our opinion for the period between 1.5 and 6 months): Bearish initially, then possibly Bullish
Long-term outlook for the precious metals sector (our opinion for the period between 6 and 24 months from now): Bullish
Very long-term outlook for the precious metals sector (our opinion for the period starting 2 years from now): Bullish
As a reminder, Gold Investment Updates are posted approximately once per week. We are usually posting them on Friday, but we can’t promise that it will be the case each week.
Our preferred ways to invest in and to trade gold along with the reasoning can be found in the how to buy gold section. Additionally, our preferred ETFs and ETNs can be found in our Gold & Silver ETF Ranking.
Moreover, Gold & Silver Trading Alerts are posted before or on each trading day (we usually post them before the opening bell, but we don’t promise doing that each day). If there’s anything urgent, we will send you an additional small alert before posting the main one.
Thank you.
Przemyslaw Radomski, CFA
Founder, Editor-in-chief

