

Briefly: in our opinion, full (250% of the regular size of the position) speculative short position in gold and silver are justified from the risk/reward perspective at the moment of publishing this Alert. We are moving the stop-loss levels for silver slightly higher.
Whenever there is a sharp uptick across precious metals, the bullish bets of the investment crowd tend to rise in tune with the perceived market strength. Perceived, that is the key word here. And how to judge the market strength? The answer to both these points lies in the market context. It reveals quite a few aspects to keep a close eye on right now.
Quite a lot happened yesterday, but not all that much since after we sent out our intraday Alert, which means that what we wrote in it remains up-to-date. In particular, the comments about silver and about the levels gold stocks just reached. Let's start with the HUI Index chart (proxy for gold stocks) that we mentioned in the Alert:
Miners at an Important Retracement
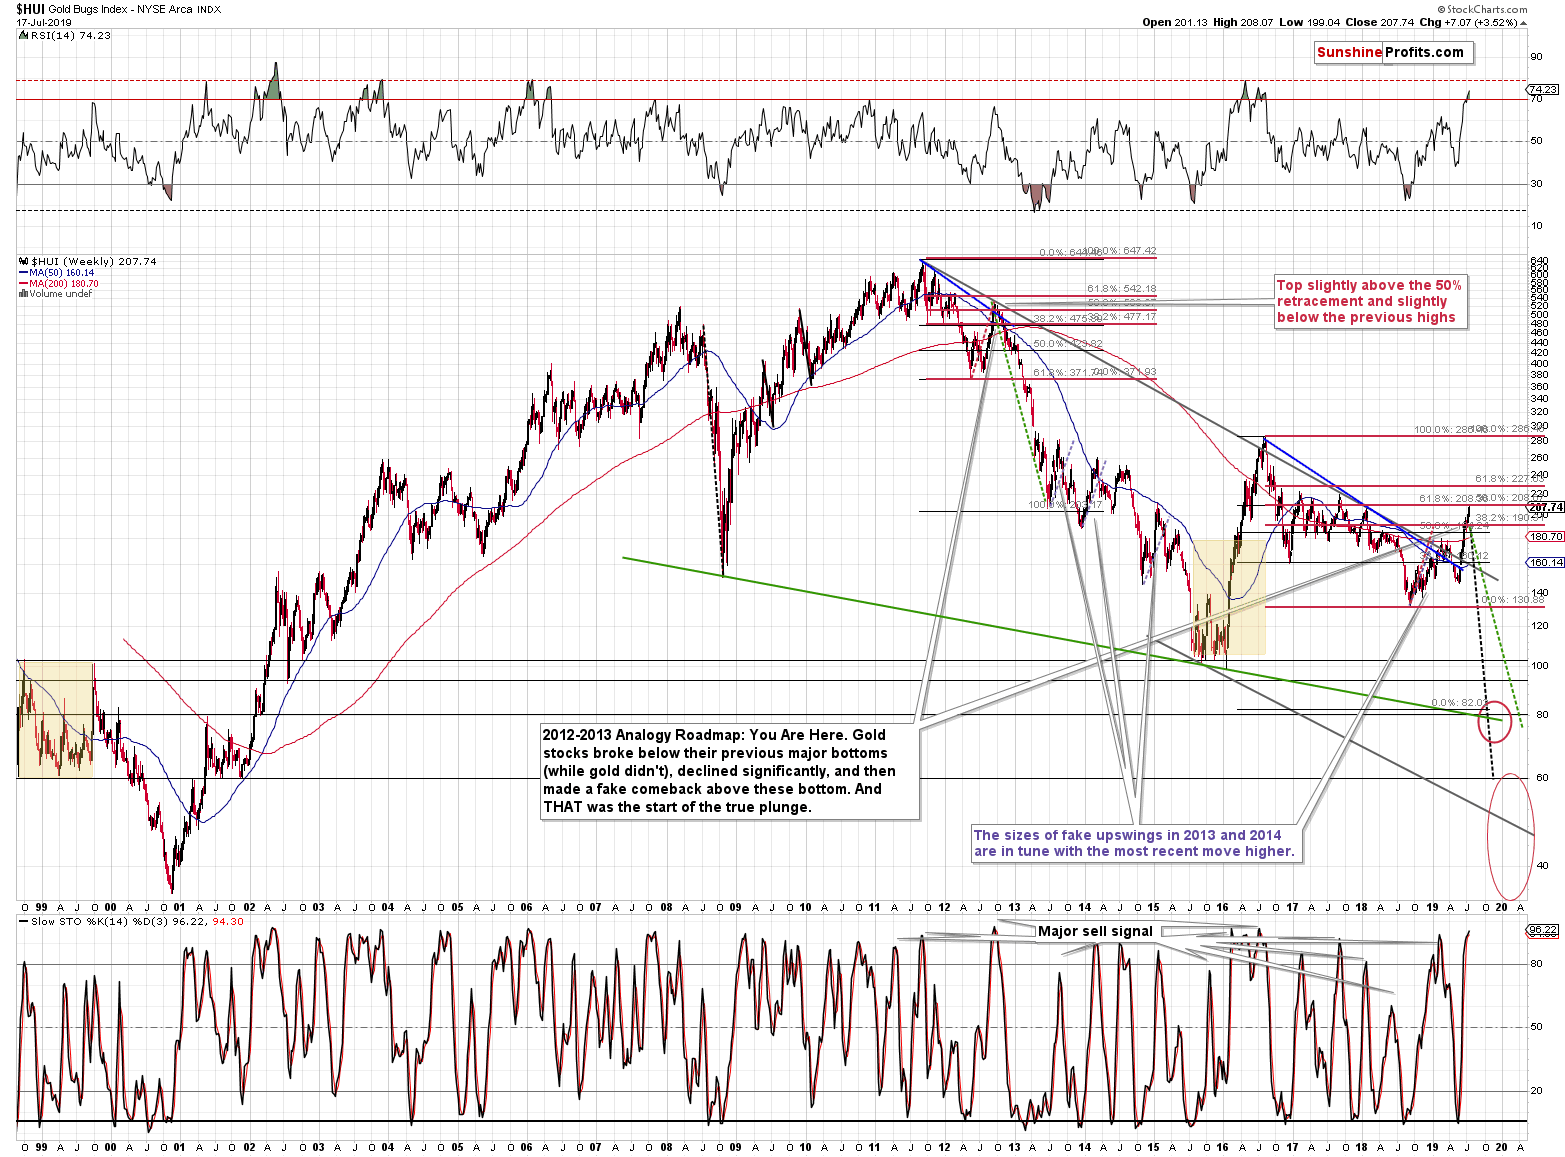
Yesterday's upswing - although sharp on a day to day basis - remains in tune with the sharp yet temporary upswing of the late 2012. Back in late 2012, the HUI Index moved a bit above its 50% retracement of the preceding decline before the top was formed. The analogous retracement is currently at about 208. Yesterday's high in the HUI Index was 208.07 - very close to the 50% retracement. In 2012, the 50% retracement was temporarily broken before the top formed, so a move even higher here would not change that much in terms of the similarity to the past move.
Why is the situation likely to repeat itself? Because this is what generally tends to happen in the market. Not every time, but often enough to make it worth one's while to look for the similarities. The more similar the moves are, the more likely it is that the follow-up action will be similar as well. Please note that the shape of the 2018 - now rally is also similar to the one that we saw in 2012. The entire rally consisted of two parts that were separated by a decline that started from the 200-week moving average (marked with red). The second rally was sharper and bigger than the initial one. We see the same thing right now. In yesterday's first Alert, we emphasized the similarity with regard to volume in silver - the late-2012 top was one of the cases that were similar to the current situation.
Of course, just as it was the case in late 2012, we now have multiple analysts and investors that are convinced that the entire precious metals market is taking off to new highs. But will this really be the case? We doubt it.
Before looking at the short-term changes, please consider the current breakout above 200 and how similar it is to the early 2016 breakdown below the 100 level. Both numbers are very round and in both cases, gold miners moved to new extremes even though gold didn't. In 2016 the fake breakdown meant the start of the biggest rally in years. With the current strength, are we about to see the biggest decline in years? This appears very likely, also based on silver's outperformance and SLV's epic volume that we discussed yesterday.
The Dynamics Across PMs Sector
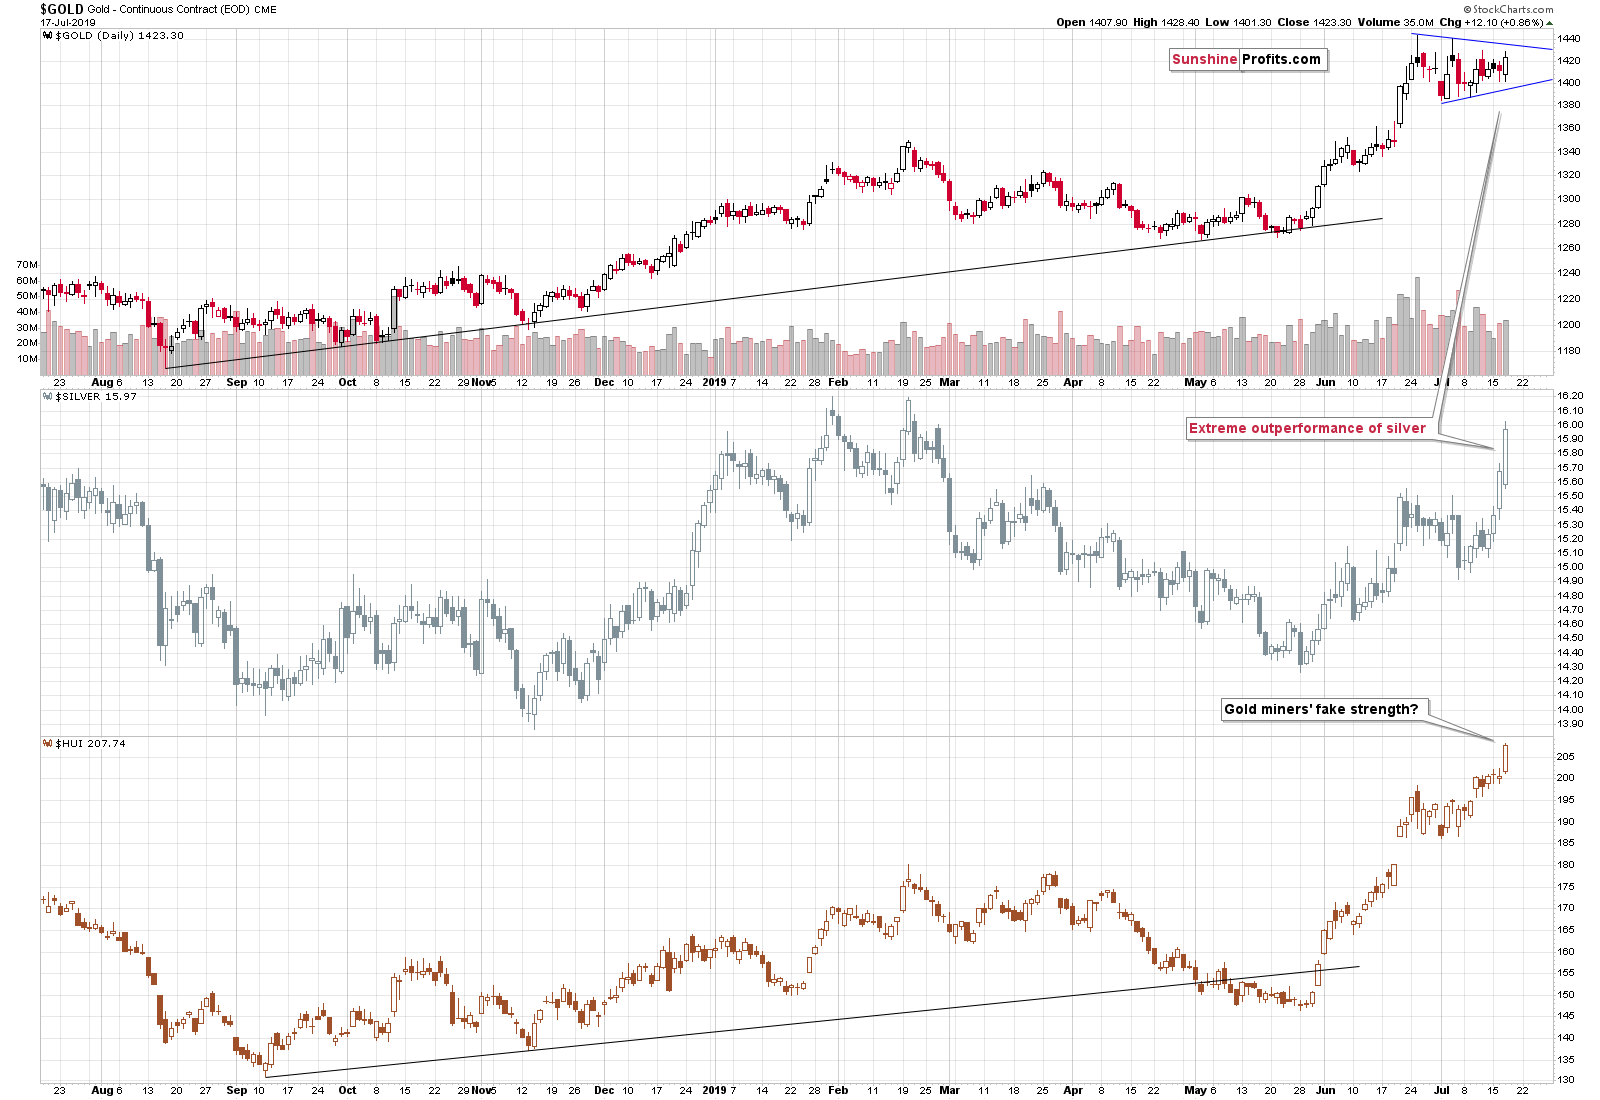
The above short-term chart shows that gold hasn't done much yesterday and that it didn't move above the previous highs, but silver and mining stocks did. The outperformance of silver was once again extreme, which makes Tuesday's signal from the SLV ETF even stronger. Gold didn't move to the declining resistance line based on the previous intraday highs, which means that a move to it might still be in the cards - possibly later today. Please note that the consolidation in gold takes form of a pennant, which is sometimes viewed as a continuation pattern. In reality, it depends on the way in which the pattern is broken. If gold confirms the breakout above the upper border of the pennant, the implications will be bullish for the short term. But if it confirms the breakdown below its lower border, the implications will be bearish. The extreme outperformance in silver strongly points to the latter scenario as being much more likely.
Still, if gold moves to the upper border of the pattern today, gold miners are likely to move higher once again today, which is why we are not reopening the speculative short positions in them just yet.
Speaking of gold and silver, let's take a look at the gold to silver ratio.
Gold to Silver Ratio Keeps Marching Higher
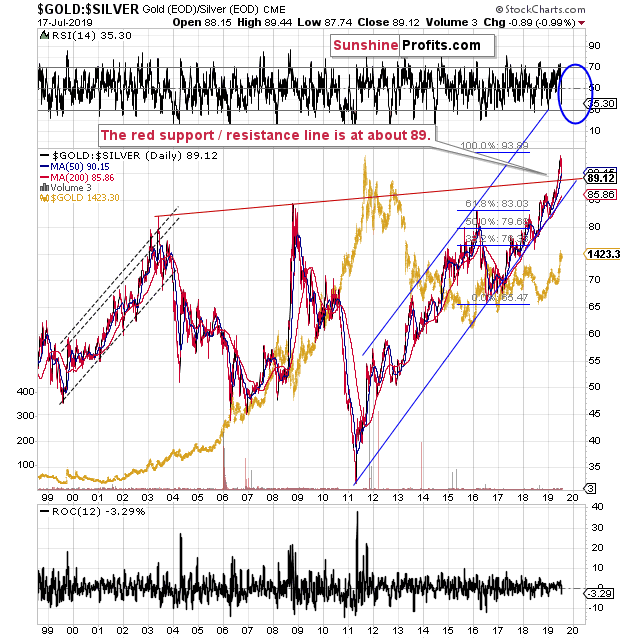
The ratio had recently broken significantly above the rising red resistance line and it now moved back to this line. This is a normal post-breakout phenomenon. The ratio didn't break below this line, so the breakout was not invalidated. What we see is simply the breakout's verification that doesn't change the bullish outlook for gold's relative performance versus silver.
In other words, recent strength in silver is most likely just a temporary phenomenon and we are likely to see the return of silver's underperformance shortly (this or next week).
Let's not forget about the situation in the USD Index chart. It has declined yesterday, but it doesn't change the good possibility that we see the completion of the inverse head-and-shoulders pattern with very bullish implications for the short- and medium term.
The USD Took a Breather Yesterday
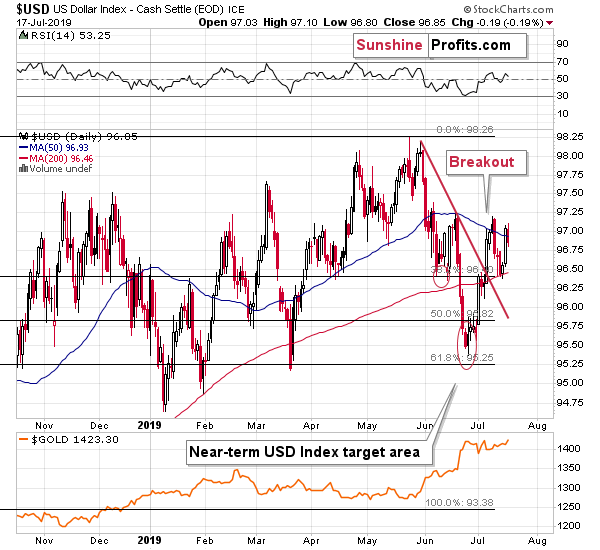
Consequently, the very bullish implications that we described several days ago are even more up-to-date now:
The USD Index formed a bullish reversal yesterday, which means that the post-breakout pullback may already be over. If we see higher USD values here - and we are likely to see them - then the USD might soon complete an inverse head and shoulders pattern. The early June bottom would be the left shoulder and the current bottom would be the right shoulder. This pattern - if it is completed - would imply a rally at least as big as the size of the "head" of the pattern starting from the "neck". The head's size is about 1.9, and the neck is at about 97.2, which implies an upside target of at least 99.1. This means a breakout to new 2019 highs.
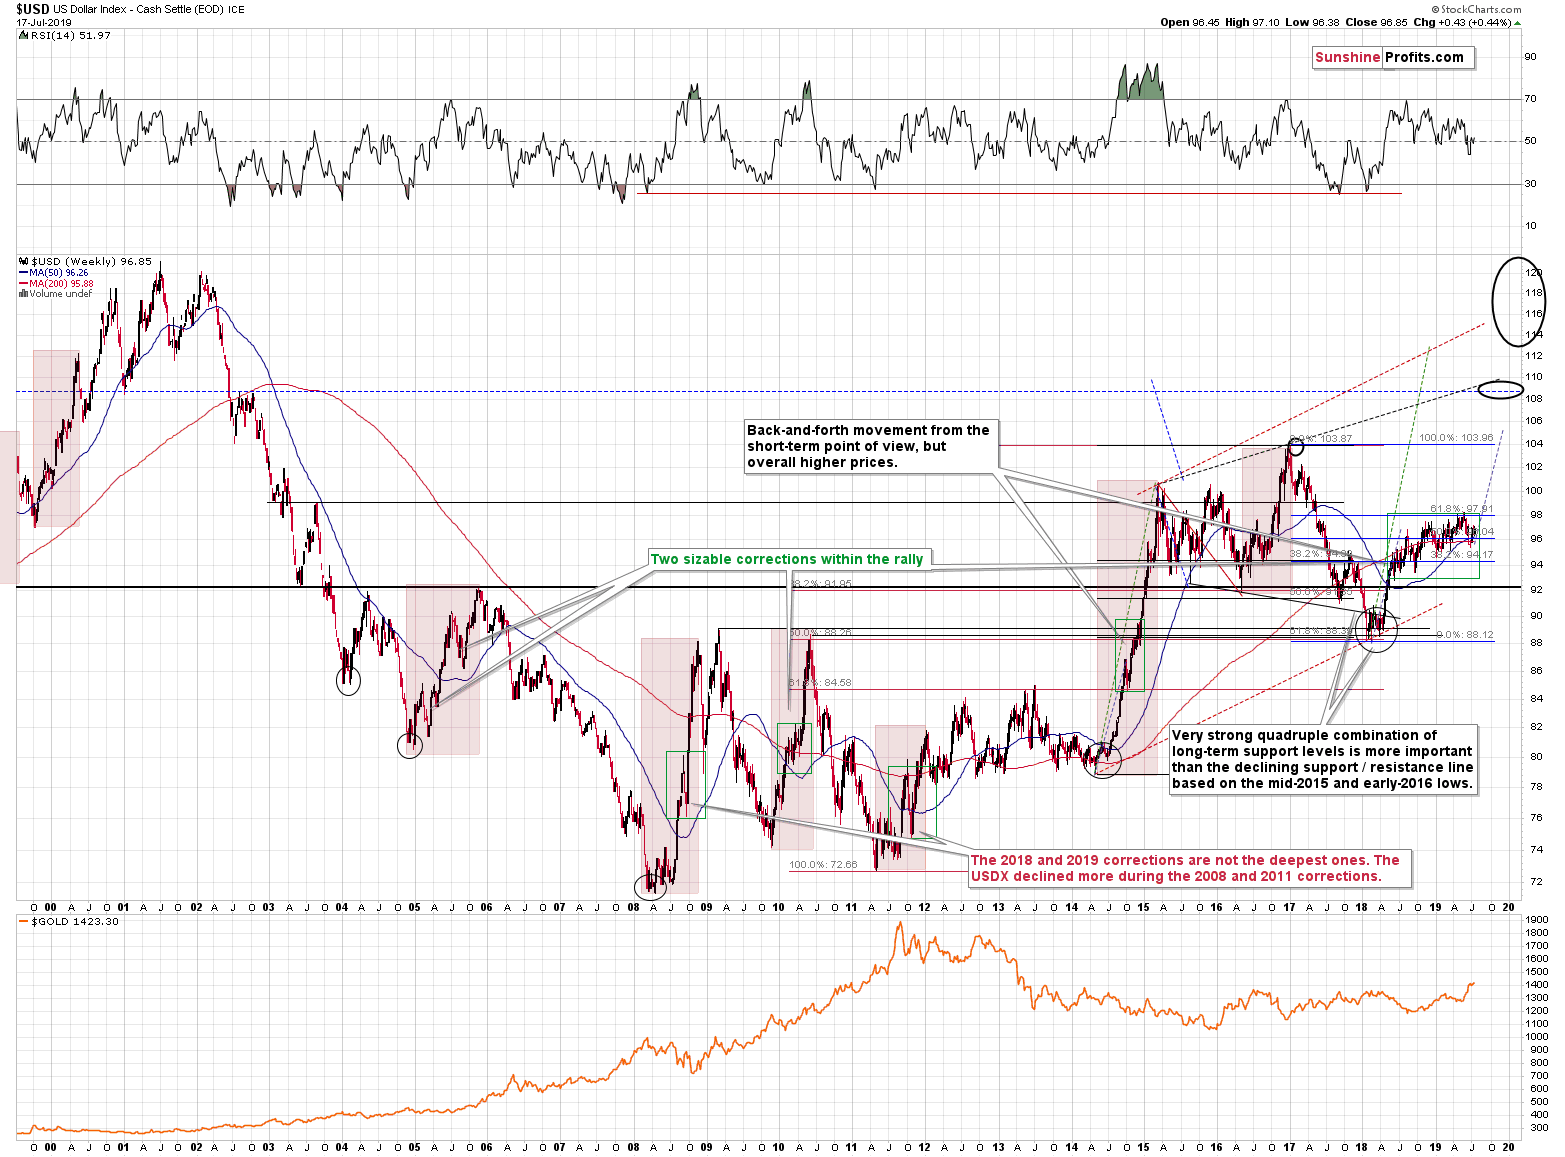
It would also mean a breakout above the running consolidation and this would imply an upside target of about 105, as the moves that follow consolidations tend to be similar to those that preceded them.
This, in turn, would imply a breakout above the 2016 / 2017 high that could - and likely would - result in an even more profound rally. The next big resistance is at about 108 level. Such a big USD rally is very likely to translate into new lows in gold.
The price of gold and the value of the USD Index don't move in perfect inverse tune at all times, but they move in the opposite directions in general, and big moves in the USDX are very unlikely to be ignored by the yellow metal. And this all might have started with yesterday's reversal.
Summary
Summing up, silver's big rally has extremely bearish implications as it wasn't accompanied by similar action in gold and mining stocks, and the size of the volume that accompanied the SLV shooting star candlestick created an extraordinary combination of profound importance. While the situation in the gold stocks appears encouraging, it's actually very similar (especially the positive attitude among most gold analysts and investors) to what we saw at the 2012 top. Given that it all happened in addition to and after we saw multiple long-term signs pointing to lower prices in the following months, i.a. the clear huge-volume-confirmed bearish shooting star candlestick in gold, huge volume topping signs from both: gold and silver, the triangle-vertex-based reversals, and epic volume from silver stocks. The next big move in the precious metals sector is most likely going to be down, not up.
We expect to resume our speculative short positions in the mining stocks shortly.
We are moving the stop-loss levels for silver slightly higher.
As always, we'll keep you - our subscribers - informed.
To summarize:
Trading capital (supplementary part of the portfolio; our opinion): Full short position (250% of the full position) in gold and silver is justified from the risk/reward perspective with the following stop-loss orders and exit profit-take price levels:
- Gold: profit-take exit price: $1,241; stop-loss: $1,452; initial target price for the DGLD ETN: $51.87; stop-loss for the DGLD ETN $31.67
- Silver: profit-take exit price: $13.81; stop-loss: $16.53; initial target price for the DSLV ETN: $39.38; stop-loss for the DSLV ETN $23.17
Long-term capital (core part of the portfolio; our opinion): No positions (in other words: cash)
Insurance capital (core part of the portfolio; our opinion): Full position
Whether you already subscribed or not, we encourage you to find out how to make the most of our alerts and read our replies to the most common alert-and-gold-trading-related-questions.
Please note that the in the trading section we describe the situation for the day that the alert is posted. In other words, it we are writing about a speculative position, it means that it is up-to-date on the day it was posted. We are also featuring the initial target prices, so that you can decide whether keeping a position on a given day is something that is in tune with your approach (some moves are too small for medium-term traders and some might appear too big for day-traders).
Plus, you might want to read why our stop-loss orders are usually relatively far from the current price.
Please note that a full position doesn't mean using all of the capital for a given trade. You will find details on our thoughts on gold portfolio structuring in the Key Insights section on our website.
As a reminder - "initial target price" means exactly that - an "initial" one, it's not a price level at which we suggest closing positions. If this becomes the case (like it did in the previous trade) we will refer to these levels as levels of exit orders (exactly as we've done previously). Stop-loss levels, however, are naturally not "initial", but something that, in our opinion, might be entered as an order.
Since it is impossible to synchronize target prices and stop-loss levels for all the ETFs and ETNs with the main markets that we provide these levels for (gold, silver and mining stocks - the GDX ETF), the stop-loss levels and target prices for other ETNs and ETF (among other: UGLD, DGLD, USLV, DSLV, NUGT, DUST, JNUG, JDST) are provided as supplementary, and not as "final". This means that if a stop-loss or a target level is reached for any of the "additional instruments" (DGLD for instance), but not for the "main instrument" (gold in this case), we will view positions in both gold and DGLD as still open and the stop-loss for DGLD would have to be moved lower. On the other hand, if gold moves to a stop-loss level but DGLD doesn't, then we will view both positions (in gold and DGLD) as closed. In other words, since it's not possible to be 100% certain that each related instrument moves to a given level when the underlying instrument does, we can't provide levels that would be binding. The levels that we do provide are our best estimate of the levels that will correspond to the levels in the underlying assets, but it will be the underlying assets that one will need to focus on regarding the signs pointing to closing a given position or keeping it open. We might adjust the levels in the "additional instruments" without adjusting the levels in the "main instruments", which will simply mean that we have improved our estimation of these levels, not that we changed our outlook on the markets. We are already working on a tool that would update these levels on a daily basis for the most popular ETFs, ETNs and individual mining stocks.
Our preferred ways to invest in and to trade gold along with the reasoning can be found in the how to buy gold section. Additionally, our preferred ETFs and ETNs can be found in our Gold & Silver ETF Ranking.
As a reminder, Gold & Silver Trading Alerts are posted before or on each trading day (we usually post them before the opening bell, but we don't promise doing that each day). If there's anything urgent, we will send you an additional small alert before posting the main one.
=====
Latest Free Trading Alerts:
The delicate balance of forces at the Fed has been disturbed. The doves grew stronger recently, and with new governors coming, their strength may increase even further. Will gold warm up to them?
Two Fed Nominations Every Gold Investor Should Be Aware Of
Stocks retraced some of their recent advance on Wednesday, as investors took short-term profits off the table. The S&P 500 index fell below the 3,000 level and closed 1.1% below the Monday's new record high of 3,017.80. So is this a downward reversal or just a correction before another leg up?
Stocks Turning Lower, Earnings in Play
=====
Thank you.
Sincerely,
Przemyslaw Radomski, CFA
Editor-in-chief, Gold & Silver Fund Manager

