

Briefly: in our opinion, full (250% of the regular size of the position) speculative short position in gold, silver, and mining stocks are justified from the risk/reward perspective at the moment of publishing this Alert.
Gold's moves yesterday and earlier today might look like a consolidation above $1,400. As something normal, healthy and expected. Before passing such a verdict, let's take a look at how these moves fit the chart patterns seen. The miners also have a word or two to say here. And who could forget about the USD Index? We're looking there at something tremendously important, hiding in plain sight...
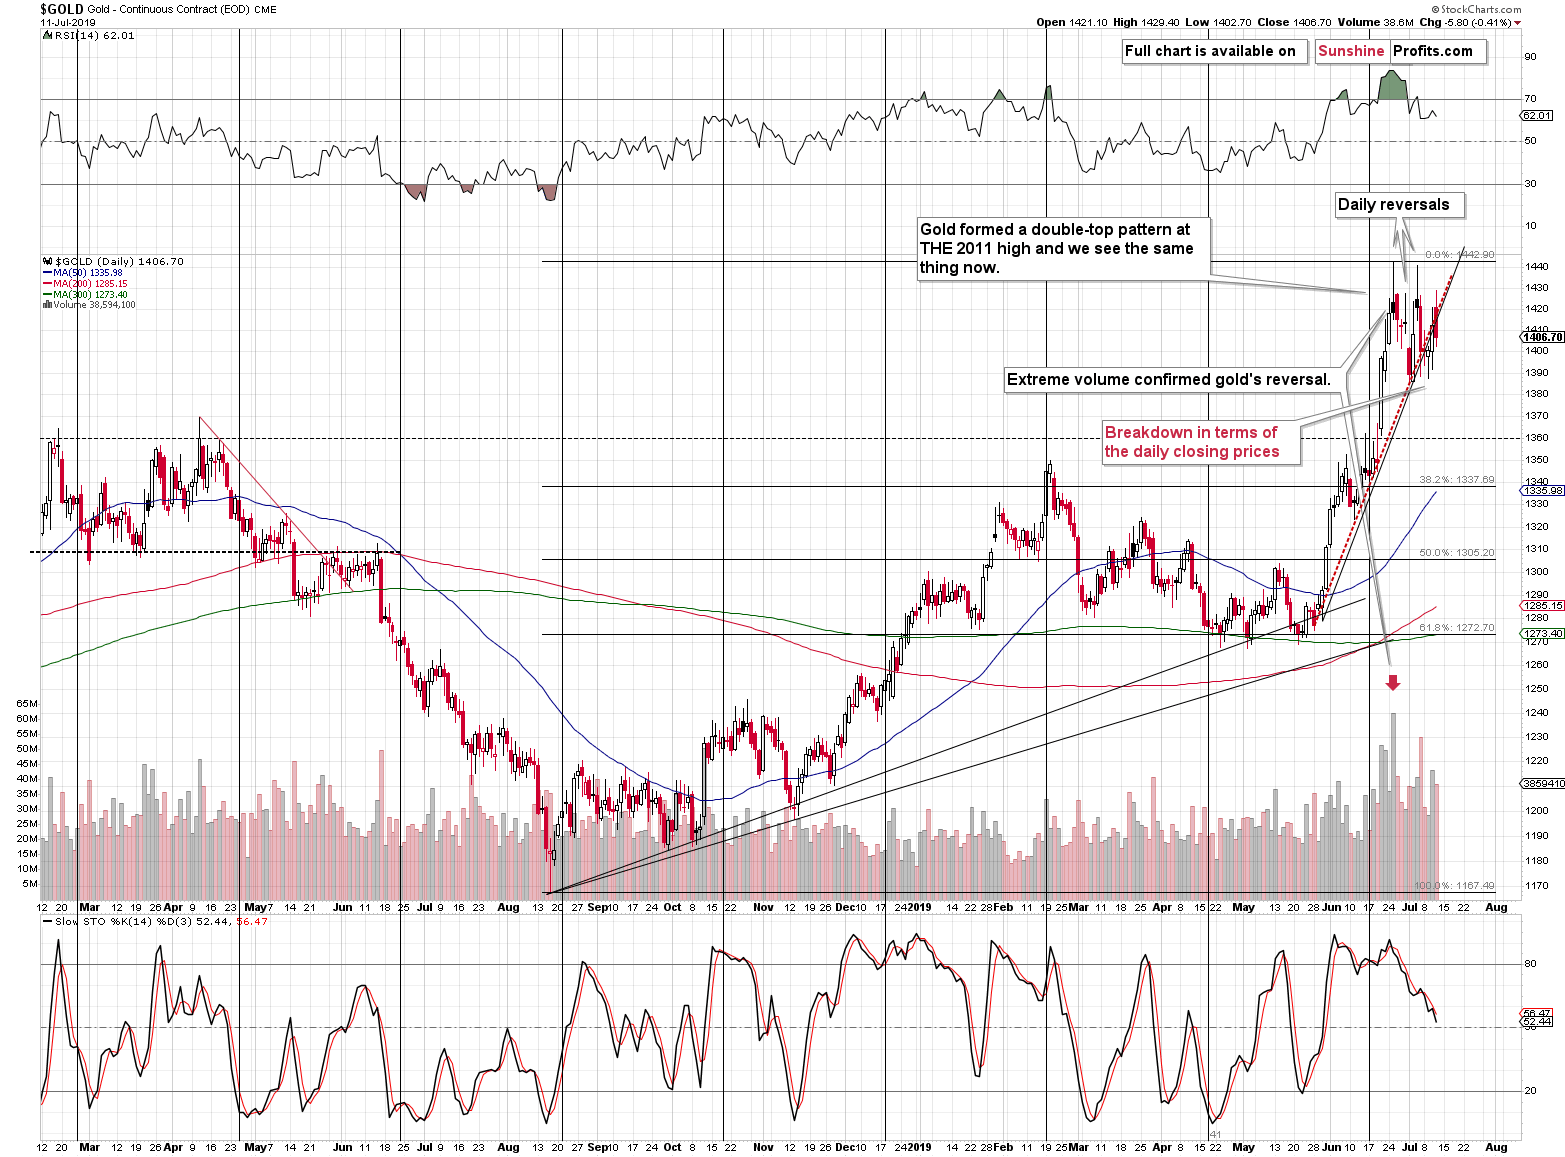
In yesterday's Alert, we emphasized that gold is in the process of verifying the breakdown below the rising short-term support line. Today's Alert is going to be a follow-up to this analysis in light of what happened yesterday. Namely, gold moved back to the resistance line and then closed visibly below it. The breakdown is clear. And while this is the case based on the charts from our regular data provider, looking at the situation through a different chart provider, the situation is even more bearish, as the breakdown had already been confirmed previously.
Gold Breakdown Verification Any Way You Look At It
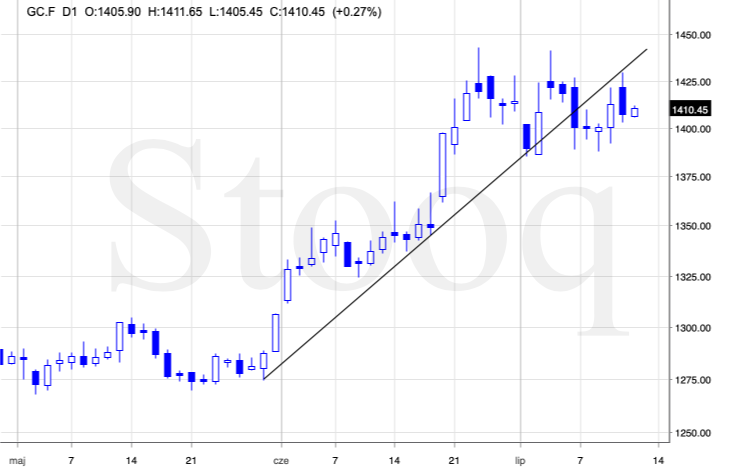
Both charts feature gold, but on the second chart, the situation is clearly bearish. Gold made another - weaker - attempt to rally, which once again failed, but this time it failed below the support line. Moreover, the second chart shows that the breakdown actually took place last week and that it was confirmed this week. It also shows that yesterday's "encouraging rally" was actually nothing more than a final verification of the breakdown - a goodbye kiss after which declines are to be expected.
Overall, our yesterday's comments on gold remain up-to-date:
The week ends tomorrow, and it will be important where the closing price is. If the above-mentioned breakdown is confirmed by the weekly closing price, it will be quite clear that gold's slide has already started.
We know that this back and forth trading at around (mostly above) $1,400 level is tiring, but please note that this may be viewed as something relatively normal as far as double tops are concerned.
Gold has been moving back and forth above $1,400 for a bit longer than two weeks now. In 2011, gold has been moving back and forth above $1,800 for more than 4 weeks before declining back below $1,600. So even if this back and forth action took twice as much time right now (which is doubtful), it would only match the topping time that we saw in 2011. We don't know if you remember the overall "feeling" back then - people were practically religiously convinced that gold will soar above $2,000 and that this back and forth movement was just a correction. Similarly, there are quite many people right now who are convinced that gold is going to shoot above $1,500 soon.
All in all, gold's yesterday's upswing seems to have been just a post-breakdown corrective upswing. And what did we see in silver?
Breakdown Verification In Silver Too
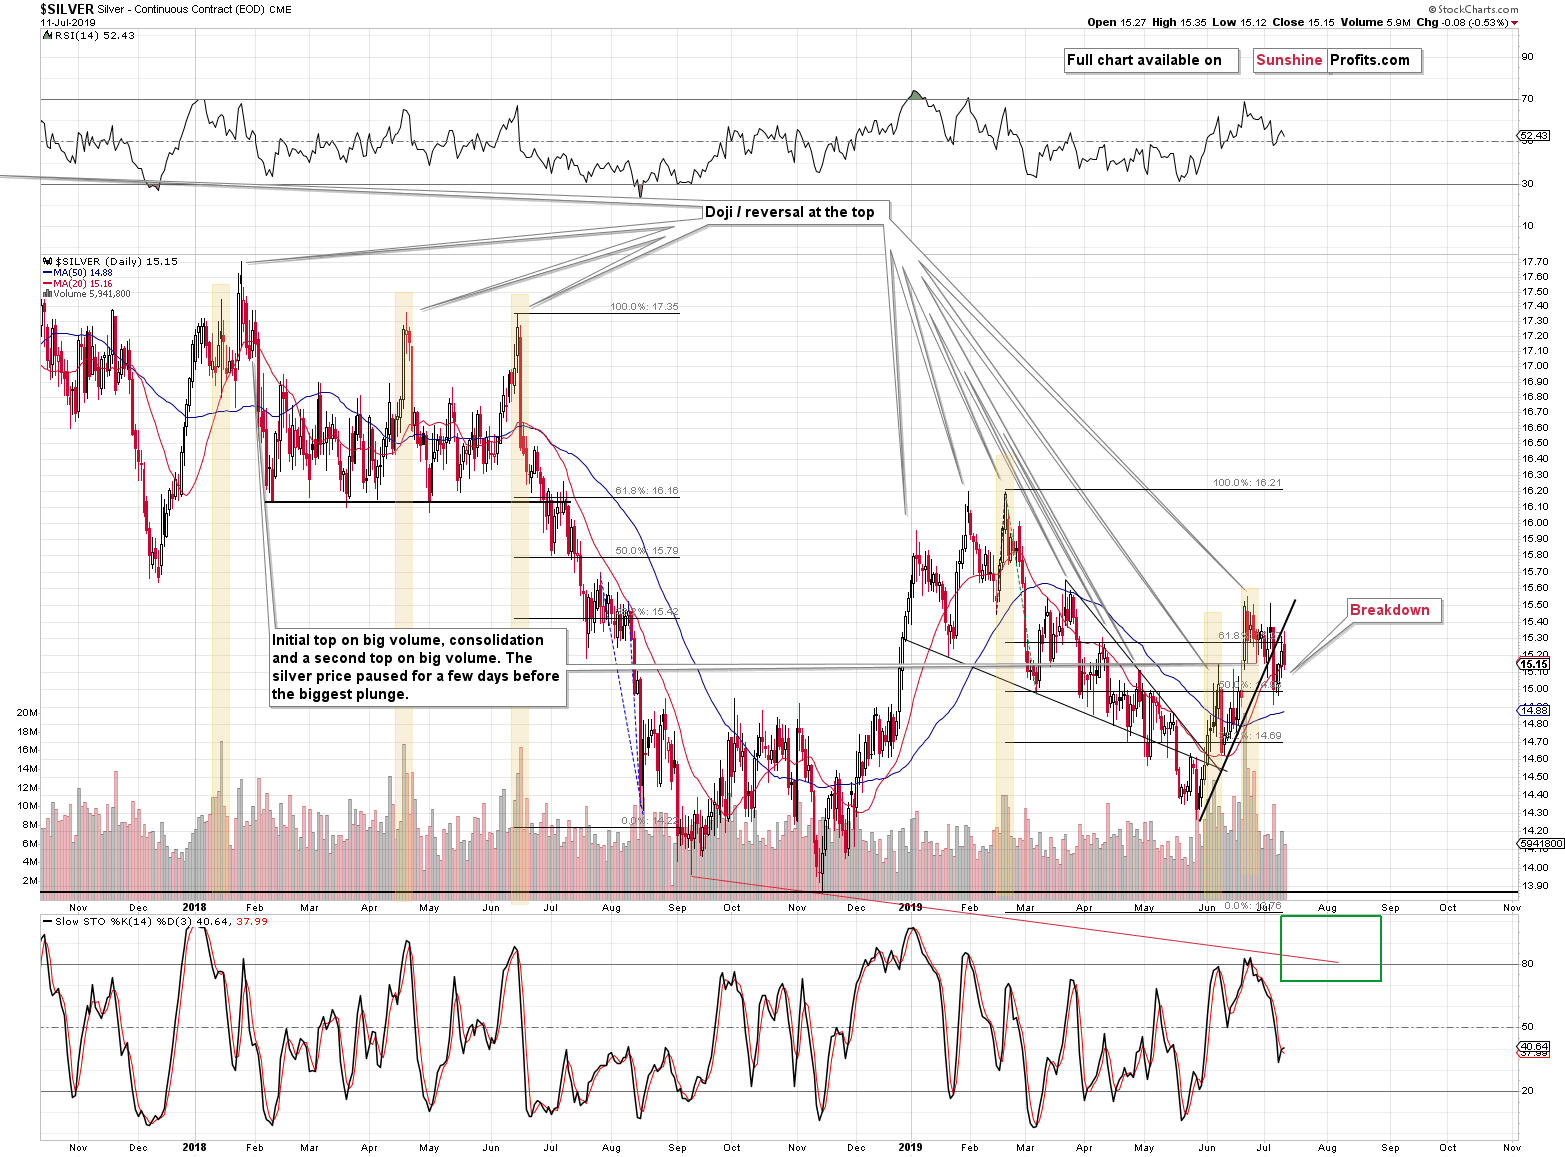
Silver more or less repeated its previous day's performance, so our yesterday's comments on it remain up-to-date as well:
Silver had broken below its own rising support line earlier and it already confirmed the breakdown by closing below the line for three subsequent trading days. Yesterday's upswing was just a move back up and a verification of the breakdown. Some traders call it a "goodbye kiss" to the previous support. Whether one calls it that, or a final verification of the breakdown, the implications are still bearish. It's nothing more than a regular technical development that is a part of moving from a short-term uptrend to a short-term downtrend; and it suggests that silver is already in the latter.
We see a mirror image of the above in the USD Index.
...While The USD Breakout Verification Appears Over
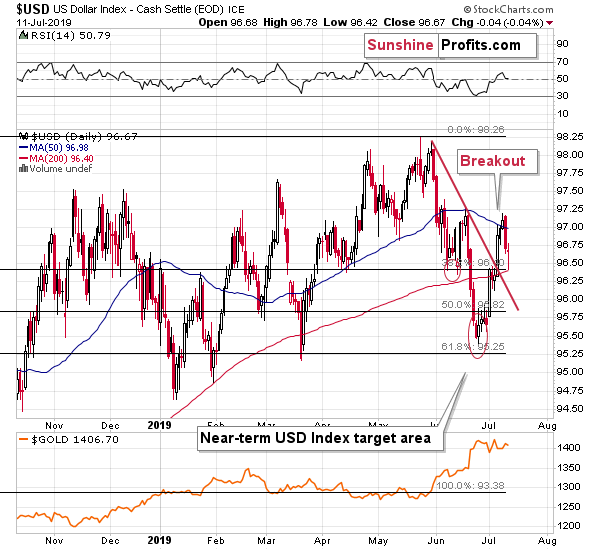
The USD Index formed a bullish reversal yesterday, which means that the post-breakout pullback may already be over. If we see higher USD values here - and we are likely to see them - then the USD might soon complete an inverse head and shoulders pattern. The early June bottom would be the left shoulder and the current bottom would be the right shoulder. This pattern - if it is completed - would imply a rally at least as big as the size of the "head" of the pattern starting from the "neck". The head's size is about 1.9, and the neck is at about 97.2, which implies an upside target of at least 99.1. This means a breakout to new 2019 highs.
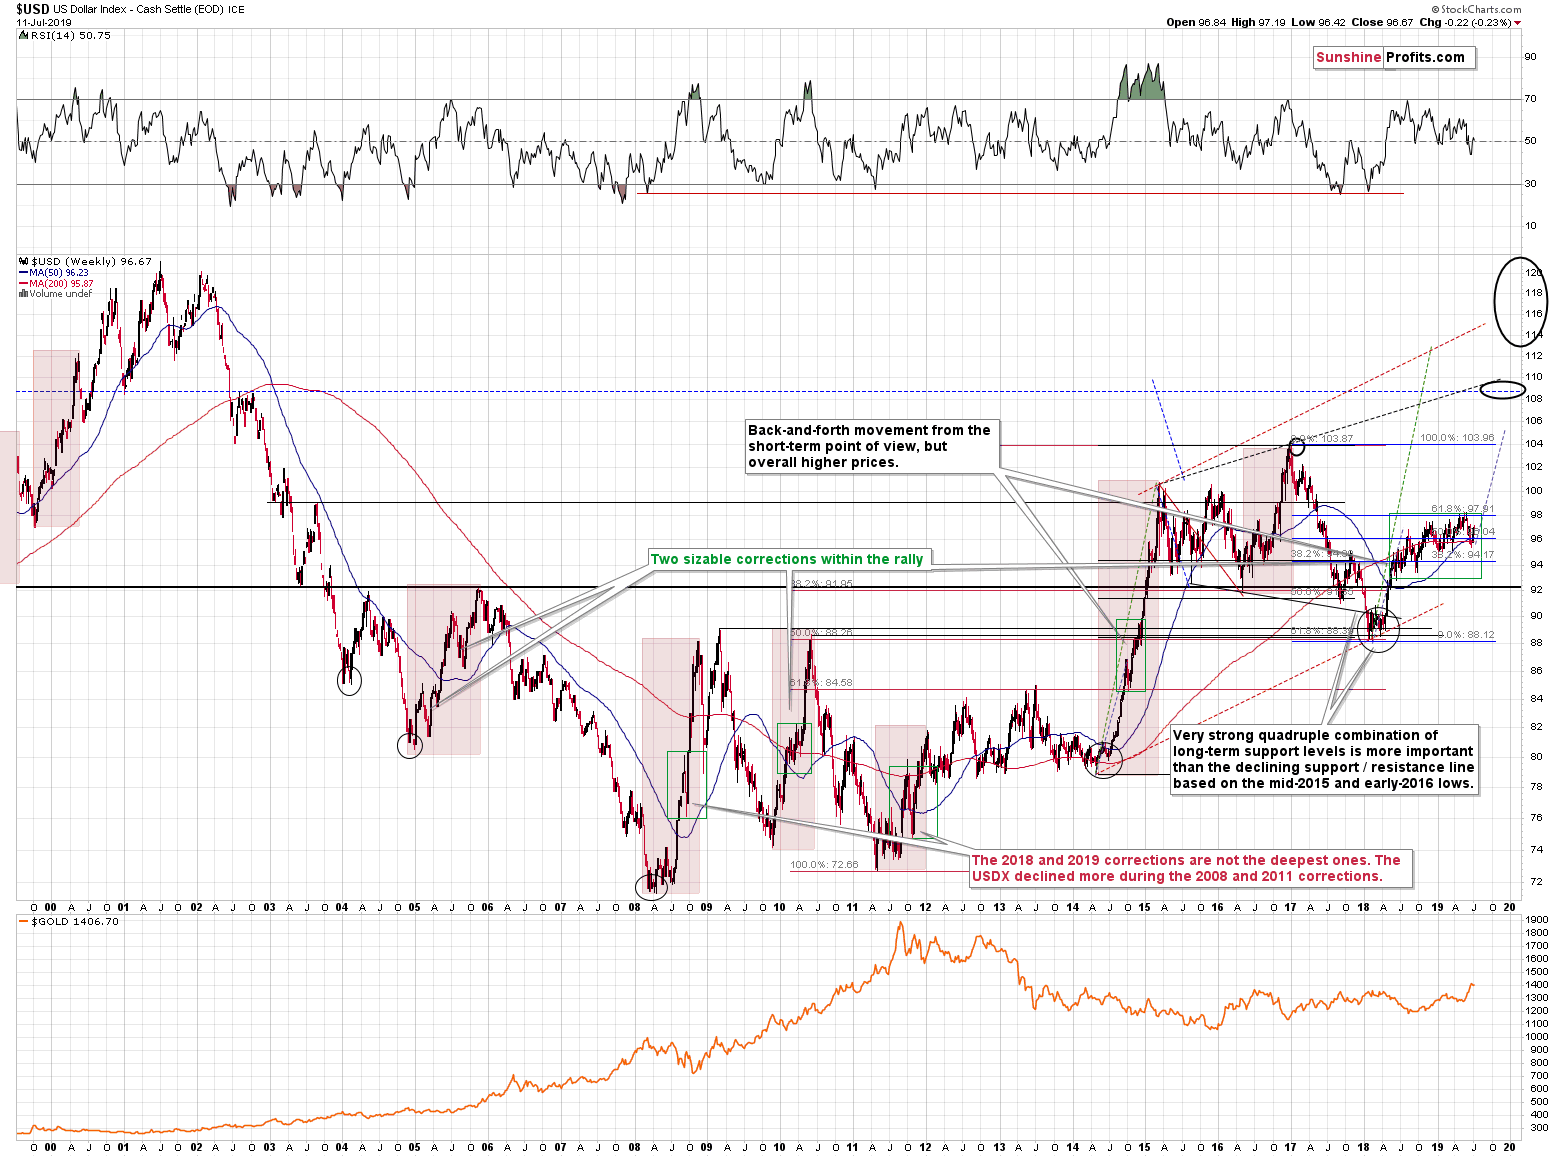
It would also mean a breakout above the running consolidation and this would imply an upside target of about 105, as the moves that follow consolidations tend to be similar to those that preceded them.
This, in turn, would imply a breakout above the 2016 / 2017 high that could - and likely would - result in an even more profund rally. The next big resistance is at about 108 level. Such a big USD rally is very likely to translate into new lows in gold.
There price of gold and the value of the USD Index don't move in perfect inverse tune at all times, but they move in the opposite directions in general, and big moves in the USDX are very unlikely to be ignored by the yellow metal. And this all might have started with yesterday's reversal.
Let's get back to the precious metals sector and take a look at the mining stocks.
Are Mining Stocks Breaking Out, Or Not Really?
In yesterday's analysis, we wrote the following about gold stocks' breakout:
Is it a breakout? It definitely is. But is it meaningful? One thing is that it has not confirmed, and the other thing is that we saw four similar cases in the past 1.5 years. We marked them with red rectangles - gold miners moved above the previous highs temporarily or even closed above them before the most sizable declines.
The move above the previous highs and the close at about 200 level may seem indeed encouraging at first sight, but it just doesn't add up with gold's and silver's breakdowns, and the USD breakout.
Yesterday's price action is somewhat unclear with regard to the above.
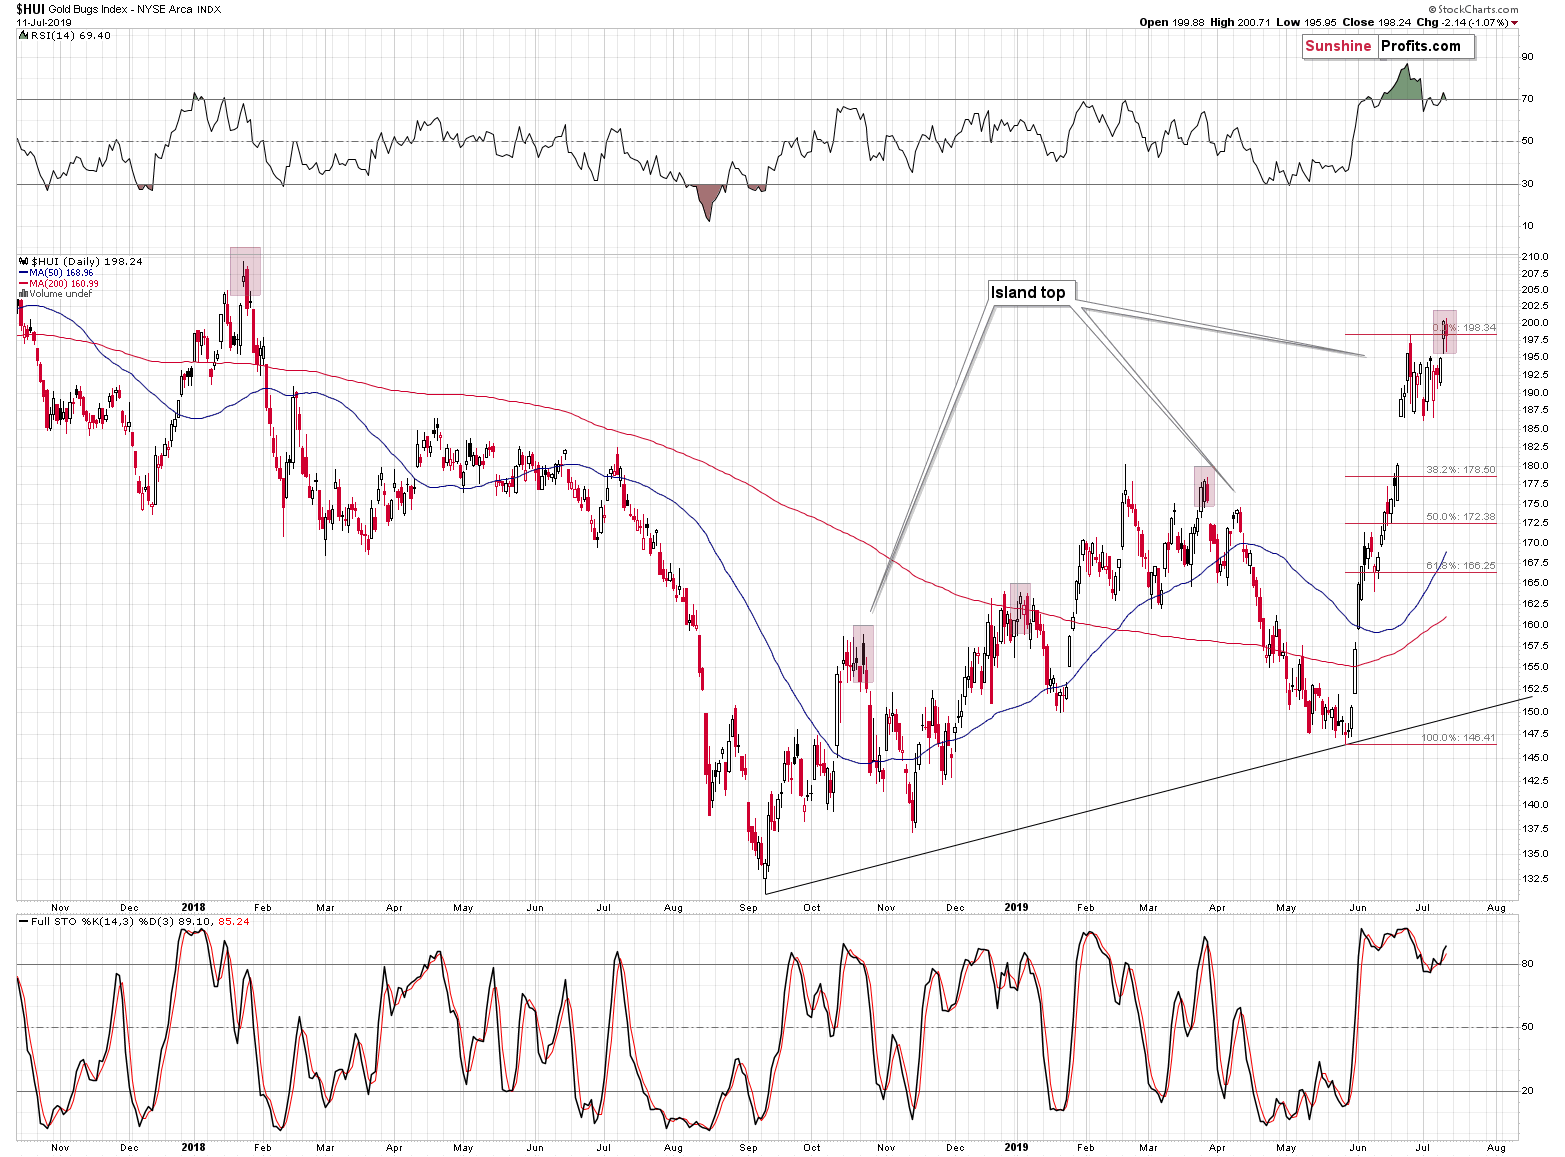
The HUI Index didn't invalidate the breakout.
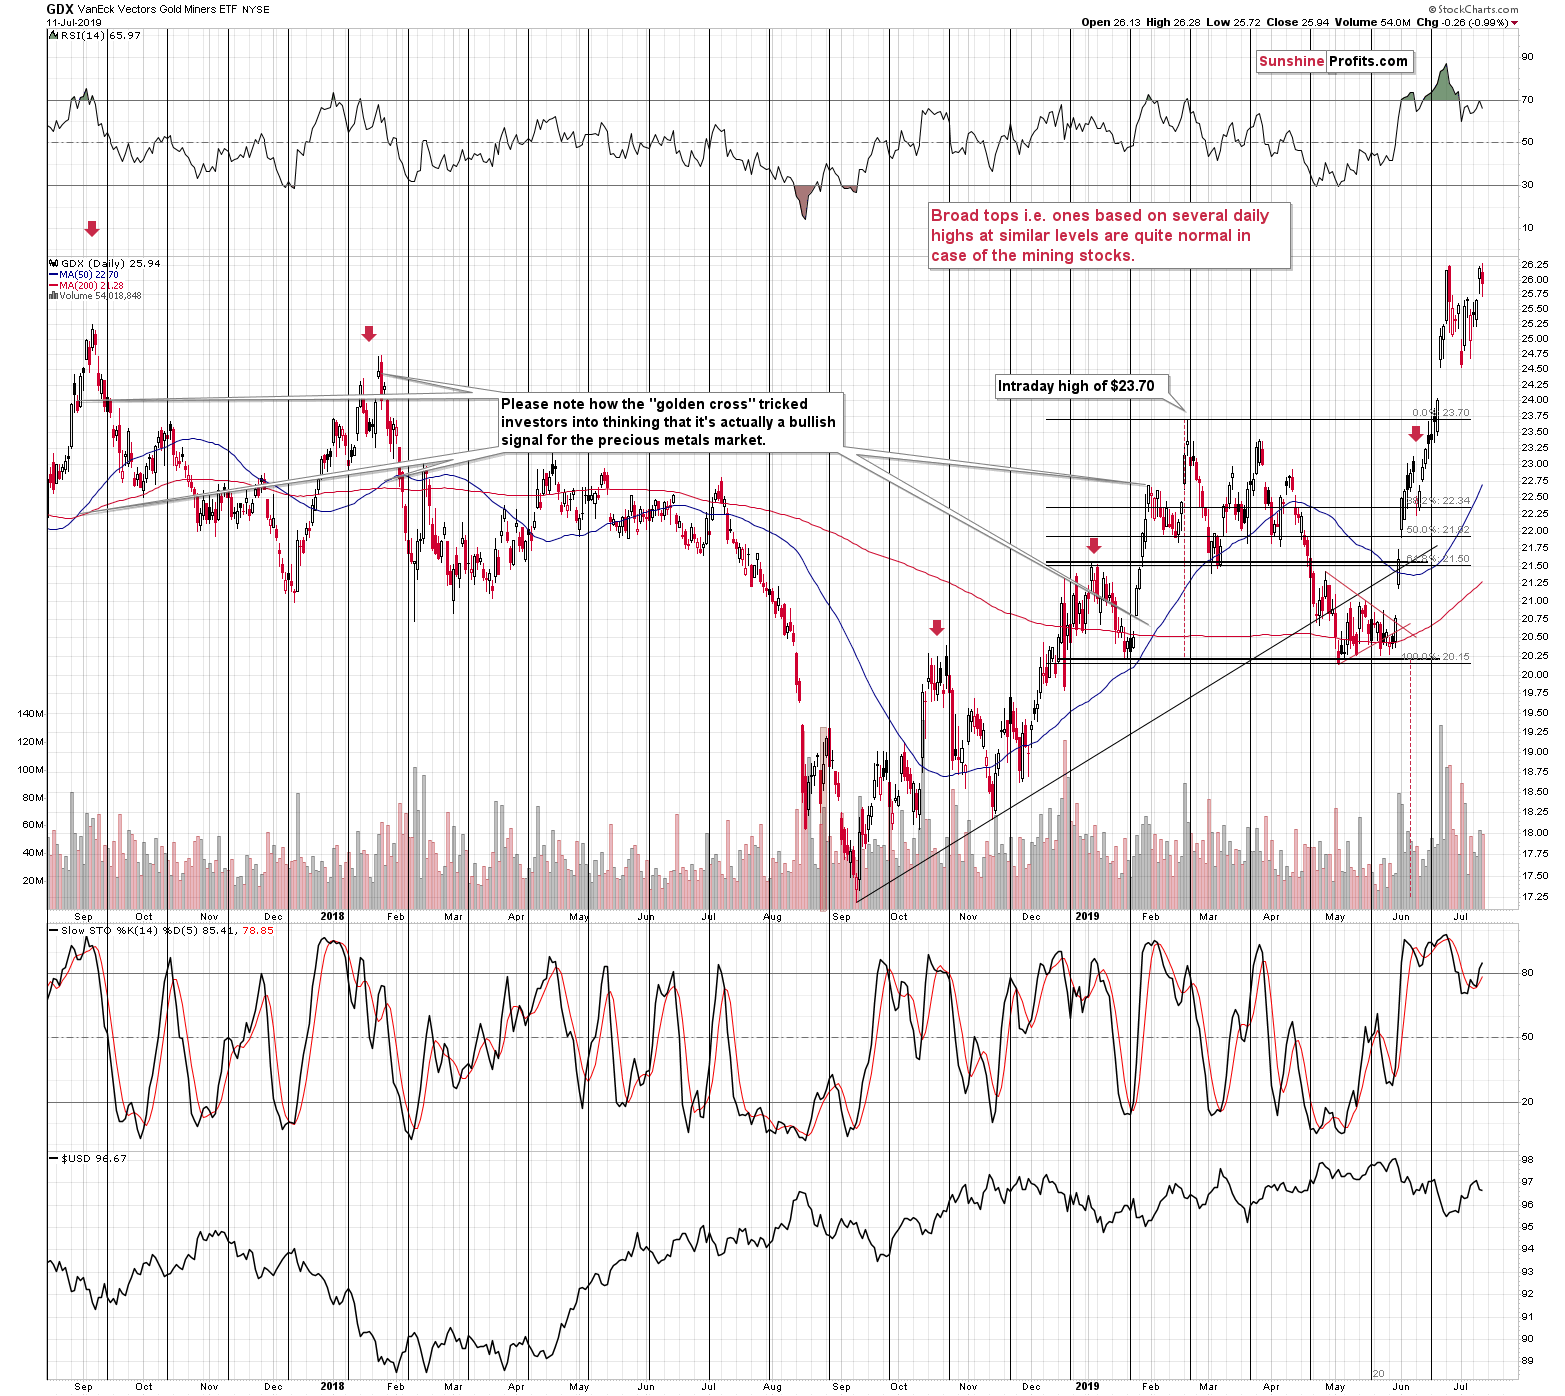
The GDX ETF, however, did. The XAU Index didn't invalidate it, while the silver stocks (SIL ETF) didn't break above the previous highs in the first place.
Overall, the situation became a bit more bearish, because of GDX's invalidation. The fact that there was no invalidation in the HUI or XAU is neutral, because the breakout hasn't been confirmed either.
Summary
Summing up, gold and silver confirmed their breakdowns below their rising short-term support lines, which is yet another bearish factor currently in play for the precious metals market. The above happened in addition and after we saw multiple long-term signs pointing to lower prices in the following months, i.a. the clear huge-volume-confirmed bearish shooting star candlestick in gold, huge volume topping signs from both: gold and silver, the triangle-vertex-based reversals, and epic volume from silver stocks. The next big move in the precious metals sector is most likely going to be down, not up.
As always, we'll keep you - our subscribers - informed.
To summarize:
Trading capital (supplementary part of the portfolio; our opinion): Full short position (250% of the full position) in gold, silver, and mining stocks is justified from the risk/reward perspective with the following stop-loss orders and exit profit-take price levels:
- Gold: profit-take exit price: $1,241; stop-loss: $1,452; initial target price for the DGLD ETN: $51.87; stop-loss for the DGLD ETN $31.67
- Silver: profit-take exit price: $13.81; stop-loss: $16.32; initial target price for the DSLV ETN: $39.38; stop-loss for the DSLV ETN $23.87
- Mining stocks (price levels for the GDX ETF): profit-take exit price: $17.61; stop-loss: $26.47; initial target price for the DUST ETF: $34.28; stop-loss for the DUST ETF $9.87
In case one wants to bet on junior mining stocks' prices (we do not suggest doing so - we think senior mining stocks are more predictable in the case of short-term trades - if one wants to do it anyway, we provide the details), here are the stop-loss details and target prices:
- GDXJ ETF: profit-take exit price: $24.71; stop-loss: $37.17
- JDST ETF: profit-take exit price: $78.21 stop-loss: $22.47
Long-term capital (core part of the portfolio; our opinion): No positions (in other words: cash)
Insurance capital (core part of the portfolio; our opinion): Full position
Whether you already subscribed or not, we encourage you to find out how to make the most of our alerts and read our replies to the most common alert-and-gold-trading-related-questions.
Please note that the in the trading section we describe the situation for the day that the alert is posted. In other words, it we are writing about a speculative position, it means that it is up-to-date on the day it was posted. We are also featuring the initial target prices, so that you can decide whether keeping a position on a given day is something that is in tune with your approach (some moves are too small for medium-term traders and some might appear too big for day-traders).
Plus, you might want to read why our stop-loss orders are usually relatively far from the current price.
Please note that a full position doesn't mean using all of the capital for a given trade. You will find details on our thoughts on gold portfolio structuring in the Key Insights section on our website.
As a reminder - "initial target price" means exactly that - an "initial" one, it's not a price level at which we suggest closing positions. If this becomes the case (like it did in the previous trade) we will refer to these levels as levels of exit orders (exactly as we've done previously). Stop-loss levels, however, are naturally not "initial", but something that, in our opinion, might be entered as an order.
Since it is impossible to synchronize target prices and stop-loss levels for all the ETFs and ETNs with the main markets that we provide these levels for (gold, silver and mining stocks - the GDX ETF), the stop-loss levels and target prices for other ETNs and ETF (among other: UGLD, DGLD, USLV, DSLV, NUGT, DUST, JNUG, JDST) are provided as supplementary, and not as "final". This means that if a stop-loss or a target level is reached for any of the "additional instruments" (DGLD for instance), but not for the "main instrument" (gold in this case), we will view positions in both gold and DGLD as still open and the stop-loss for DGLD would have to be moved lower. On the other hand, if gold moves to a stop-loss level but DGLD doesn't, then we will view both positions (in gold and DGLD) as closed. In other words, since it's not possible to be 100% certain that each related instrument moves to a given level when the underlying instrument does, we can't provide levels that would be binding. The levels that we do provide are our best estimate of the levels that will correspond to the levels in the underlying assets, but it will be the underlying assets that one will need to focus on regarding the signs pointing to closing a given position or keeping it open. We might adjust the levels in the "additional instruments" without adjusting the levels in the "main instruments", which will simply mean that we have improved our estimation of these levels, not that we changed our outlook on the markets. We are already working on a tool that would update these levels on a daily basis for the most popular ETFs, ETNs and individual mining stocks.
Our preferred ways to invest in and to trade gold along with the reasoning can be found in the how to buy gold section. Additionally, our preferred ETFs and ETNs can be found in our Gold & Silver ETF Ranking.
As a reminder, Gold & Silver Trading Alerts are posted before or on each trading day (we usually post them before the opening bell, but we don't promise doing that each day). If there's anything urgent, we will send you an additional small alert before posting the main one.
=====
Latest Free Trading Alerts:
How likely is a recession in the United States? Predicting a recession is difficult, but one can make some nice money with a good forecast. Consequently, we invite you to read our today's article, which discusses the most important recessionary models developed by the Fed, and find out what do they imply for the gold market.
Fed's Recessionary Indicators and Gold
=====
Thank you.
Sincerely,
Przemyslaw Radomski, CFA
Editor-in-chief, Gold & Silver Fund Manager

