

Briefly: in our opinion, full (250% of the regular size of the position) speculative short position in gold, silver, and mining stocks are justified from the risk/reward perspective at the moment of publishing this Alert.
If we had to pick one day, or one situation when a single market provided most indications during a single day, it would be yesterday's performance of silver.
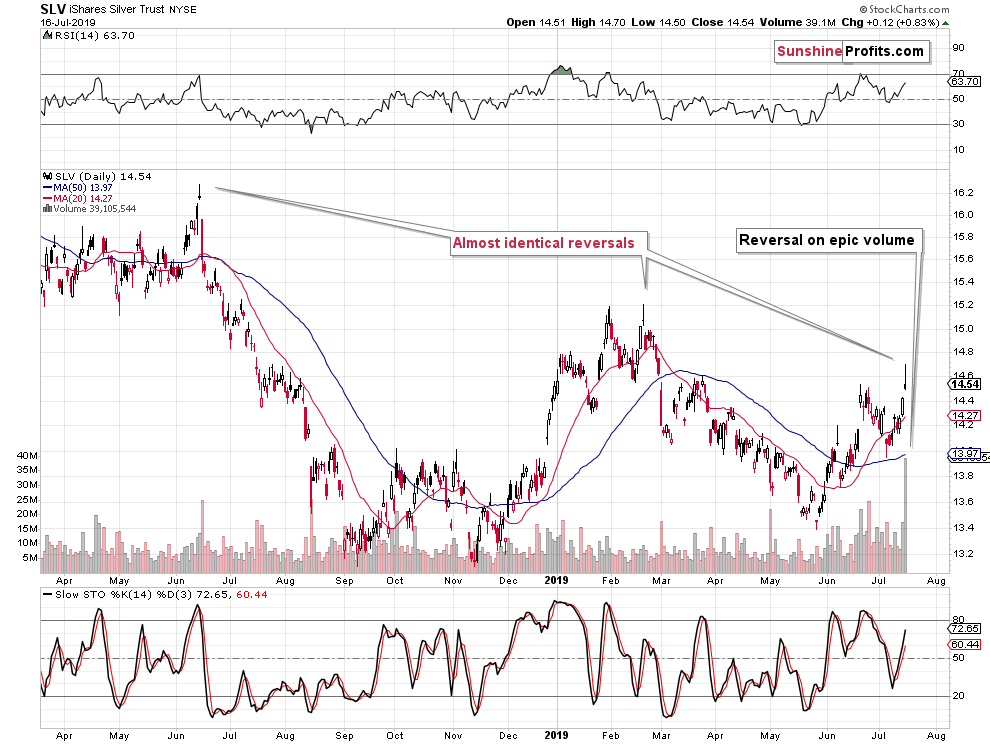
There's not much to say about yesterday's session while looking at gold and mining stocks - they both moved a bit lower. But things are very much different when we look at silver. The white metal jumped higher decisively, rallying above the June highs and the SLV ETF soared on volume that we haven't seen so far this year. The volume was even higher than what we saw at the 2016 top! It was bigger than what we saw at the late-2012 top (that one was close, though)! In fact, the only year when we saw higher daily volume during silver's upswing was 2011. Except for THE silver top, the mid-2012 rebound, and the late-2010 massive run-up, all other cases when silver soared, were accompanied by volume what was lower than what we saw yesterday. And these were almost always major tops. Combining this with the shape of yesterday's candlestick in the SLV gives us very clear indications. They are beyond-words bearish.
Let's take a look at the chart for details.
Silver's Volume Record
SLV may be viewed as paper silver by some (just as GLD may be viewed as a form of paper gold), but it can be very useful for detecting market turnarounds, because of its relative popularity among individual silver investors.
Looking at the past year, it's obvious that the shape of yesterday's candlestick is just like what we saw at the 2019 high and at the mid-2018 top. Silver opened the day higher, then rallied only to give away the intraday gains before the session was over. This all happened while gold and mining stocks declined a bit, so it was a crystal-clear case of silver's outperformance.
Reversals, such as shooting stars in silver, should be confirmed by big volume as the session should represent how bears overwhelmed bulls in a fierce battle. In this way, the session shows that bulls gave their best but still lost to bears. From that point, lower prices are to be expected as bears have proven to be stronger, and because when nothing happens in the market (there are no buyers and no sellers), the price simply falls. The important part of all this is volume, because its absence means no fierce battle. This means no profound victory of bears - just a back-and-forth action without much meaning.
To say that yesterday's volume was big would be like saying that continuously smashing one's face against the wall is not the best use of their time. It's true, but it doesn't cover the full story either. The silver volume was huge. It was breathtaking, and it was epic. The above chart is not big enough to show to huge it really was, because there is nothing else that's similarly big.
Silver's Volume Record: Full Perspective
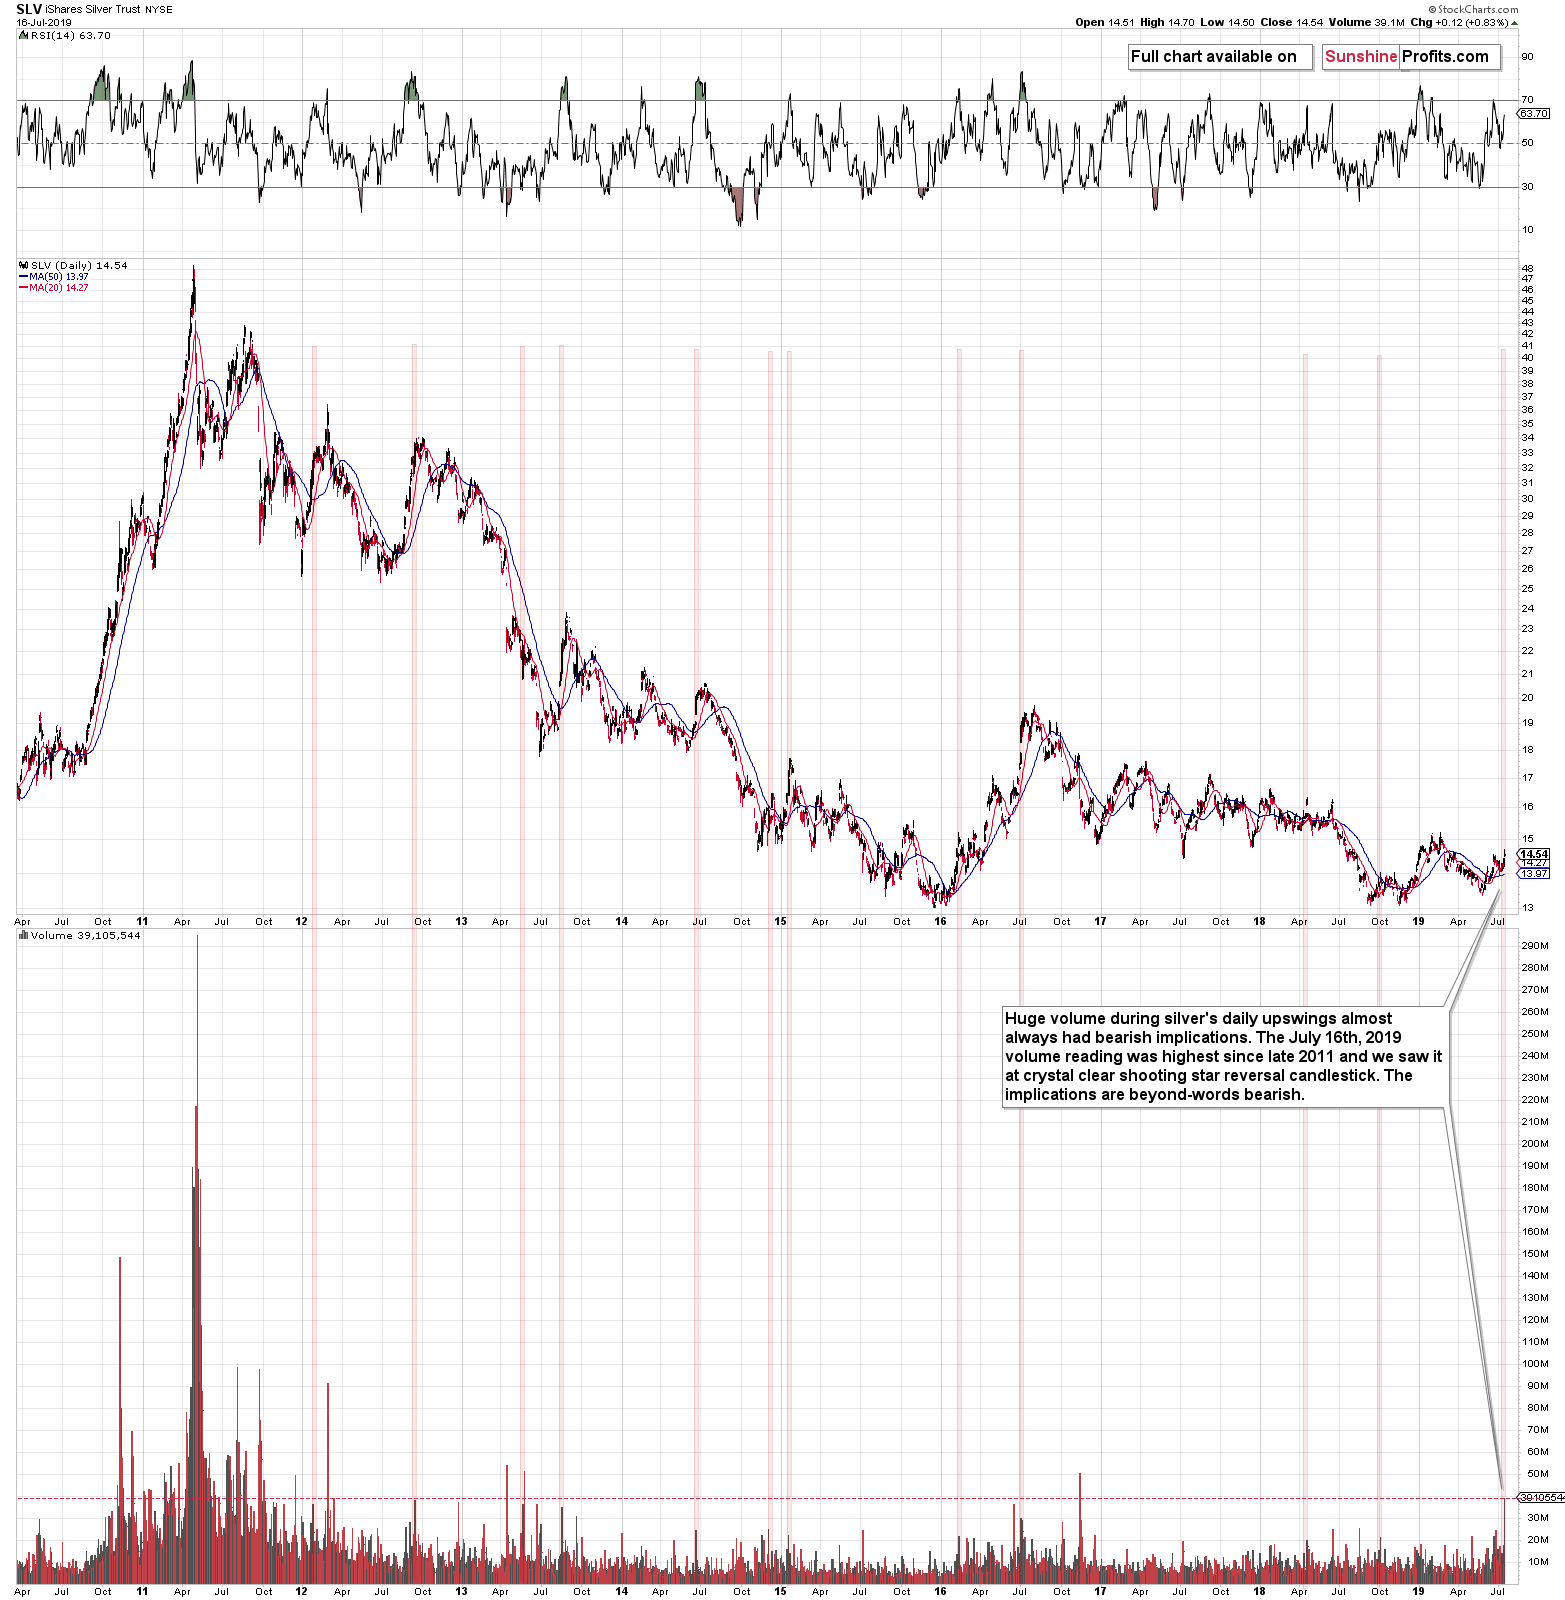
We enlarged the volume readings and we added a horizontal red line, to make it clear when volume was bigger than it was yesterday - we haven't seen it as high as we did yesterday since late 2011. Of course, we mean only the days when silver moved higher.
We marked other cases when volume was somewhat similarly high or when it was big on relative basis (yesterday it was huge in both: absolute and relative terms). In the vast majority of cases, these were excellent opportunities to short silver. Yes, it's counter-intuitive (silver rallied on big volume so it's showing strength, right?) and counters the technical-analysis-basics, but it's highly effective. And please remember that we are talking about the volume alone here.
The shape of yesterday's session was very bearish on its own, and so is the fact that silver clearly outperformed gold. The combination of all three factors (volume, reversal, outperformance) is what makes yesterday's session the clearest bearish silver sign that we saw in many months.
You may think that we're crazy, you may think that were perma-bears (which is not true), or that we hate silver (actually, that's our preferred metal of choice for the long run, but there are some cases when it's better to be invested in something else), but that's not true. If there was just one trade to be made based on our analysis this year, we would suggest it being the short position in the precious metals market right now. The silver signals are one of the most effective precious metals trading tips and we just saw a three-strong combination of epic proportions that happened right after we had already seen multiple non-silver signs pointing to the decline in the precious metals market in the upcoming months.
Before summarizing, let's take a look at what happened in gold and the USD Index.
A Joint View of Gold and USD Index
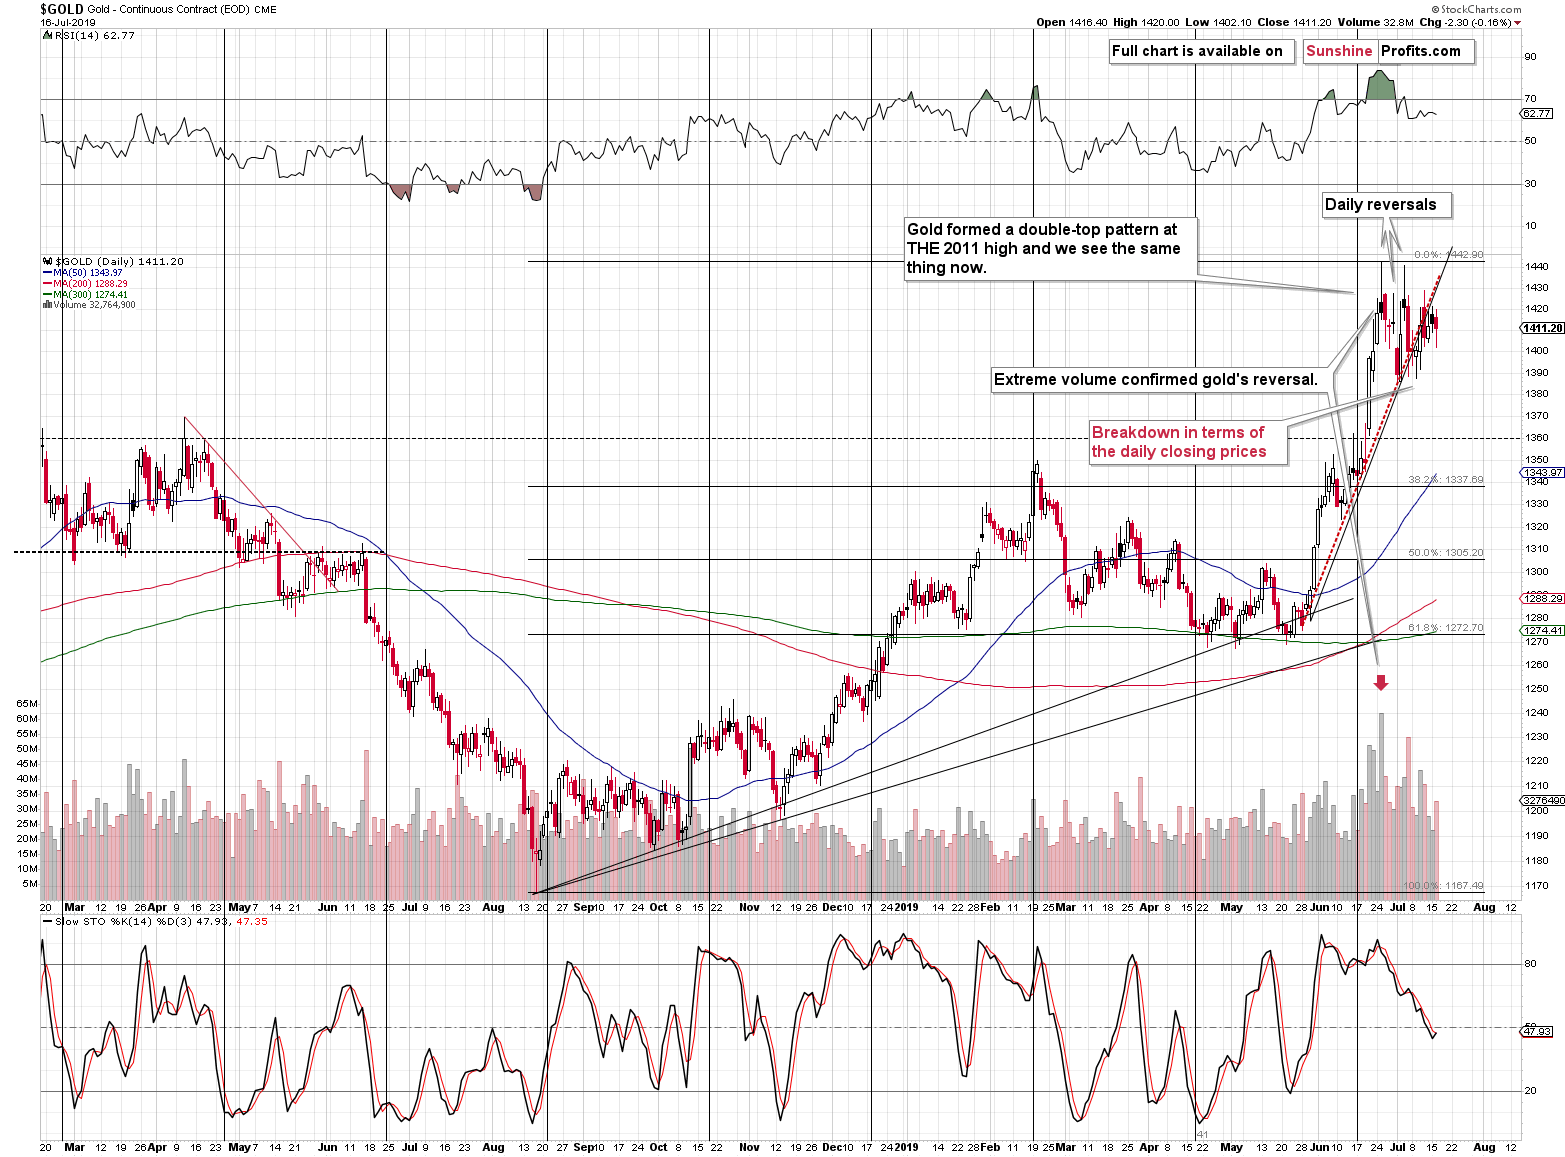
The notable detail that we see in the gold market is that gold declined on volume that was higher than the one on which it had rallied in the past few days. That's a small bearish confirmation of what we saw previously. Namely, the breakdown below the rising resistance line that was already confirmed. The additional bearish sign came from the shape of Monday's session - the black candlestick. In yesterday's Alert, we commented on the latter in the following way:
The yellow metal moved lower during the US session, but it opened visibly above the previous day's close and thus it ended the day above the previous closing price, even though it declined during the US session. These cases are marked with black on the above chart, and they are quite often seen at the tops.
Please note that this was the case in the last two local tops - the one that we saw in late June and the one from early July. Interestingly, these were the two highest closing prices of the year. This analogy suggests that lower gold prices are just around the corner.
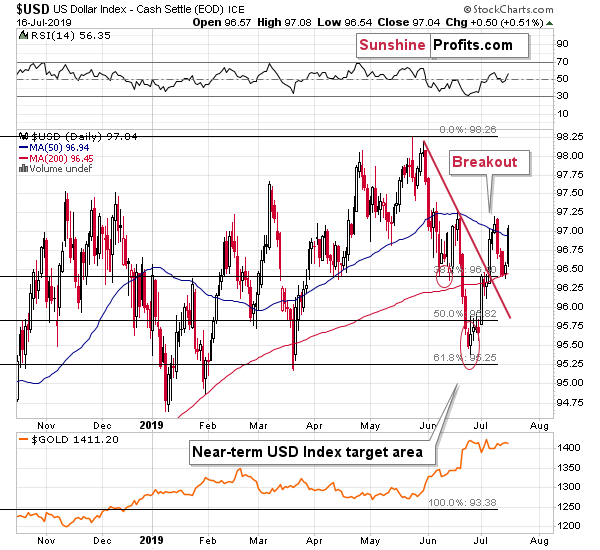
As far as the USD Index is concerned, we can see that the right shoulder of the inverse head-and-shoulders formation is almost complete. Consequently, the very bullish implications that we described several days ago are even more up-to-date now:
The USD Index formed a bullish reversal yesterday, which means that the post-breakout pullback may already be over. If we see higher USD values here - and we are likely to see them - then the USD might soon complete an inverse head and shoulders pattern. The early June bottom would be the left shoulder and the current bottom would be the right shoulder. This pattern - if it is completed - would imply a rally at least as big as the size of the "head" of the pattern starting from the "neck". The head's size is about 1.9, and the neck is at about 97.2, which implies an upside target of at least 99.1. This means a breakout to new 2019 highs.
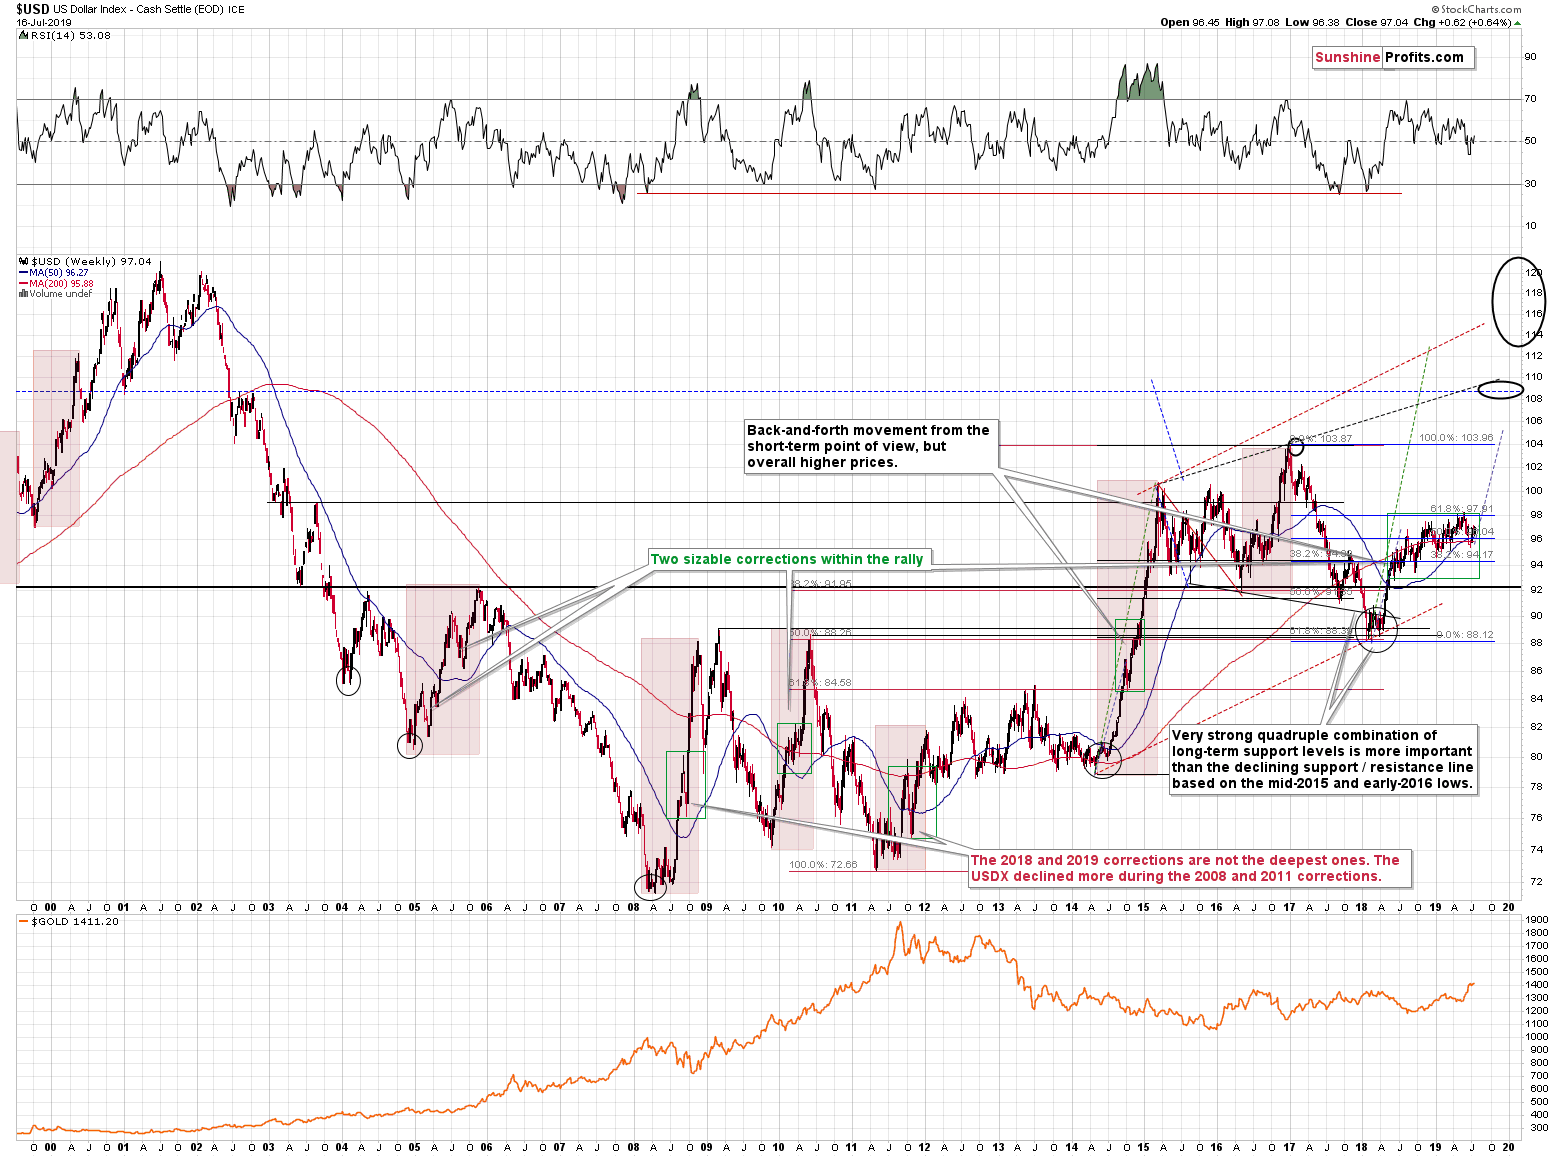
It would also mean a breakout above the running consolidation and this would imply an upside target of about 105, as the moves that follow consolidations tend to be similar to those that preceded them.
This, in turn, would imply a breakout above the 2016 / 2017 high that could - and likely would - result in an even more profund rally. The next big resistance is at about 108 level. Such a big USD rally is very likely to translate into new lows in gold.
The price of gold and the value of the USD Index don't move in perfect inverse tune at all times, but they move in the opposite directions in general, and big moves in the USDX are very unlikely to be ignored by the yellow metal. And this all might have started with yesterday's reversal.
Summary
Summing up, silver's big rally has extremely bearish implications as it wasn't accompanied by similar action in gold and mining stocks, and the shape of yesterday's reversal and the size of the volume that accompanied the SLV shooting star candlestick created an extraordinary combination of profound importance. Given that it all happened in addition to and after we saw multiple long-term signs pointing to lower prices in the following months, i.a. the clear huge-volume-confirmed bearish shooting star candlestick in gold, huge volume topping signs from both: gold and silver, the triangle-vertex-based reversals, and epic volume from silver stocks. The next big move in the precious metals sector is most likely going to be down, not up.
As always, we'll keep you - our subscribers - informed.
To summarize:
Trading capital (supplementary part of the portfolio; our opinion): Full short position (250% of the full position) in gold, silver, and mining stocks is justified from the risk/reward perspective with the following stop-loss orders and exit profit-take price levels:
- Gold: profit-take exit price: $1,241; stop-loss: $1,452; initial target price for the DGLD ETN: $51.87; stop-loss for the DGLD ETN $31.67
- Silver: profit-take exit price: $13.81; stop-loss: $16.32; initial target price for the DSLV ETN: $39.38; stop-loss for the DSLV ETN $23.87
- Mining stocks (price levels for the GDX ETF): profit-take exit price: $17.61; stop-loss: $26.47; initial target price for the DUST ETF: $34.28; stop-loss for the DUST ETF $9.87
In case one wants to bet on junior mining stocks' prices (we do not suggest doing so - we think senior mining stocks are more predictable in the case of short-term trades - if one wants to do it anyway, we provide the details), here are the stop-loss details and target prices:
- GDXJ ETF: profit-take exit price: $24.71; stop-loss: $37.17
- JDST ETF: profit-take exit price: $78.21 stop-loss: $22.47
Long-term capital (core part of the portfolio; our opinion): No positions (in other words: cash)
Insurance capital (core part of the portfolio; our opinion): Full position
Whether you already subscribed or not, we encourage you to find out how to make the most of our alerts and read our replies to the most common alert-and-gold-trading-related-questions.
Please note that the in the trading section we describe the situation for the day that the alert is posted. In other words, it we are writing about a speculative position, it means that it is up-to-date on the day it was posted. We are also featuring the initial target prices, so that you can decide whether keeping a position on a given day is something that is in tune with your approach (some moves are too small for medium-term traders and some might appear too big for day-traders).
Plus, you might want to read why our stop-loss orders are usually relatively far from the current price.
Please note that a full position doesn't mean using all of the capital for a given trade. You will find details on our thoughts on gold portfolio structuring in the Key Insights section on our website.
As a reminder - "initial target price" means exactly that - an "initial" one, it's not a price level at which we suggest closing positions. If this becomes the case (like it did in the previous trade) we will refer to these levels as levels of exit orders (exactly as we've done previously). Stop-loss levels, however, are naturally not "initial", but something that, in our opinion, might be entered as an order.
Since it is impossible to synchronize target prices and stop-loss levels for all the ETFs and ETNs with the main markets that we provide these levels for (gold, silver and mining stocks - the GDX ETF), the stop-loss levels and target prices for other ETNs and ETF (among other: UGLD, DGLD, USLV, DSLV, NUGT, DUST, JNUG, JDST) are provided as supplementary, and not as "final". This means that if a stop-loss or a target level is reached for any of the "additional instruments" (DGLD for instance), but not for the "main instrument" (gold in this case), we will view positions in both gold and DGLD as still open and the stop-loss for DGLD would have to be moved lower. On the other hand, if gold moves to a stop-loss level but DGLD doesn't, then we will view both positions (in gold and DGLD) as closed. In other words, since it's not possible to be 100% certain that each related instrument moves to a given level when the underlying instrument does, we can't provide levels that would be binding. The levels that we do provide are our best estimate of the levels that will correspond to the levels in the underlying assets, but it will be the underlying assets that one will need to focus on regarding the signs pointing to closing a given position or keeping it open. We might adjust the levels in the "additional instruments" without adjusting the levels in the "main instruments", which will simply mean that we have improved our estimation of these levels, not that we changed our outlook on the markets. We are already working on a tool that would update these levels on a daily basis for the most popular ETFs, ETNs and individual mining stocks.
Our preferred ways to invest in and to trade gold along with the reasoning can be found in the how to buy gold section. Additionally, our preferred ETFs and ETNs can be found in our Gold & Silver ETF Ranking.
As a reminder, Gold & Silver Trading Alerts are posted before or on each trading day (we usually post them before the opening bell, but we don't promise doing that each day). If there's anything urgent, we will send you an additional small alert before posting the main one.
=====
Latest Free Trading Alerts:
After yesterday's relative indecision, currencies are on the move today. This is especially true of the euro. Does it look to you like lower values are just ahead, or can the bulls stem the decline? It's not about the euro only though - we've seen pretty interesting action in the Australian dollar yesterday. The question is whether its upswing has changed the outlook, or not. Let's dive into these pressing questions and turn the resulting knowledge into something beneficial to you.
Making Money on the Euro Bulls' Conspicuous Absence Today
=====
Thank you.
Sincerely,
Przemyslaw Radomski, CFA
Editor-in-chief, Gold & Silver Fund Manager

