

Briefly: in our opinion, full (150% of the regular position size) speculative short positions in mining stocks are justified from the risk/reward point of view at the moment of publishing this Alert.
To be bullish or not to be - that is the question. Or it might have been the question, if someone named Shakespeare wrote a piece titled Investhamlet.
The choice whether to be bullish or bearish or neutral on a given asset should be made each day, each time based on the information that is currently available. Let's check the new signs that we saw yesterday.
First of all, we just saw a bearish sign from the general stocks market.
The Sign from Stocks
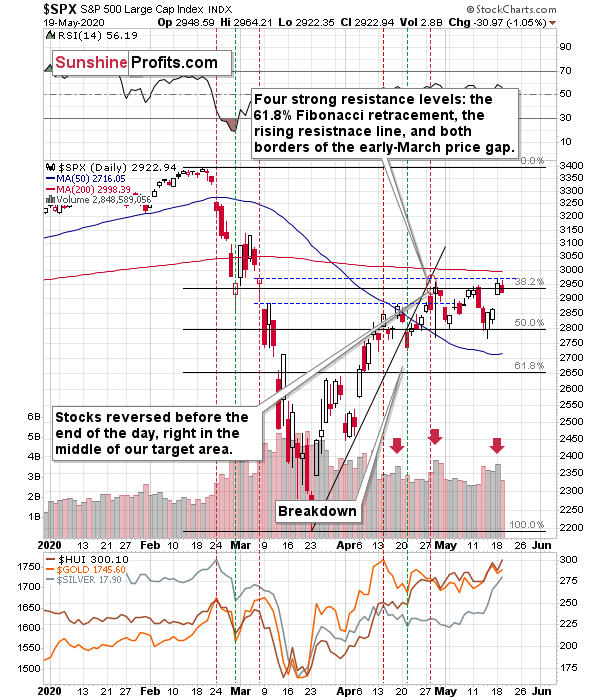
The huge price gap that we saw on Monday seems very encouraging, but please keep in mind that the S&P 500 once again failed to close the bearish price gap that it had opened in the first half of March. So, should one trust Monday's bullish price gap? It seems too early in our view. The above-mentioned resistance is strengthened by the late-April high, and the S&P 500 futures moved lower yesterday.
And by "moved lower yesterday" we actually mean, they reversed in a way that's quite profound in case of the S&P 500 futures.
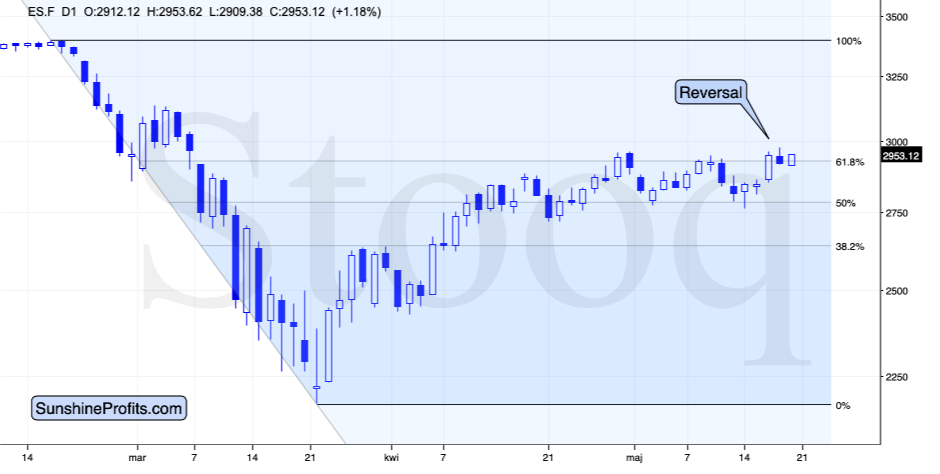
The shooting star candlestick in the stock market futures points to a change in the trend, especially since stocks invalidated the tiny breakout above the late-April high and the 61.8% Fibonacci retracement level.
Also, please note the increase in volume on the previous chart - we saw the same thing at two April highs. Perhaps we're seeing yet another high, instead of a beginning of a new upswing. We shall know soon enough - stocks are trading between the price gaps and they are likely to break out or break down sooner rather than later.
The implications for silver and mining stocks - which are more connected with the general stock market than gold is - are bearish.
While stocks reversed, the USD Index moved lower once again.
The USDX Bidding Its Time
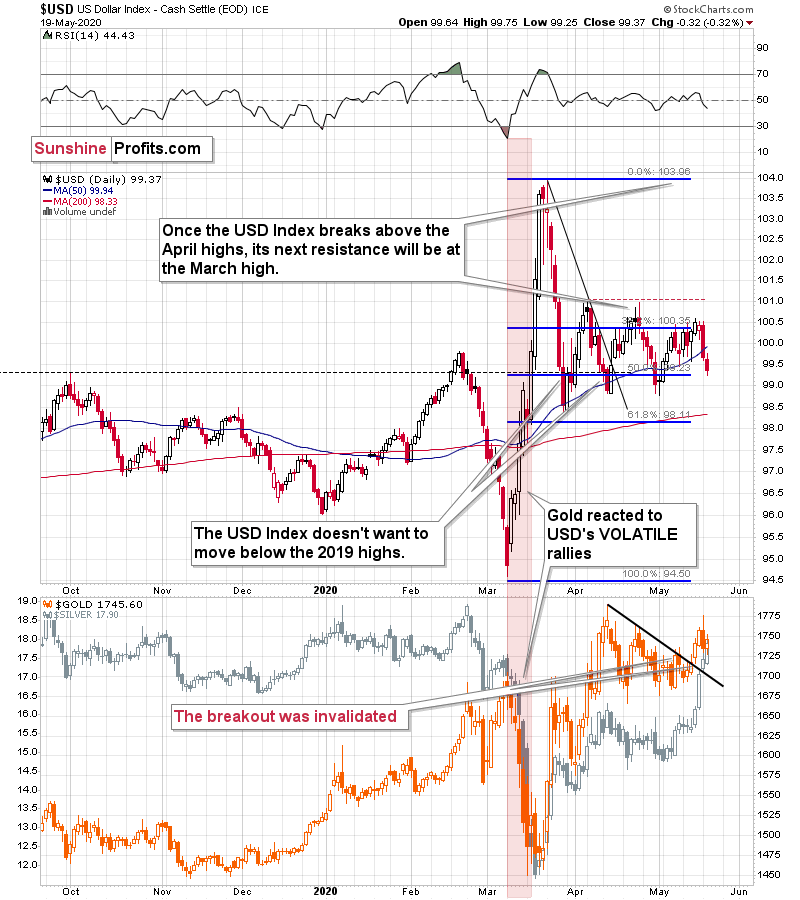
The USDX moved below its 50-day moving average (marked with blue) and it closed there for the second day. That's important, because that's USD's fourth attempt to break below this moving average and confirm the breakdown. The first two attempts took place in late March and in early April, and the breakdowns were invalidated on the next trading day in both cases. The third attempt took place about 3 weeks ago, and this time the breakdown was invalidated on the third day.
Will this time be different and the breakdown below the 50-day MA gets confirmed? We doubt it. The history repeats itself, after all, and a given pattern remains in place until it is clearly broken. This time, it seems that the USD Index will reverse once again, especially given its long-term breakout. The latter is likely to make the USD Index move much higher in the following months (possibly years), not only weeks. This doesn't mean that we expect gold to decline in the long run, though. We think that a quicker 1-3-week-long decline is in the cards, but nothing more. It's likely to be significant, though.
The implications of the most recent developments in the USD Index are bearish for the precious metals market.
As you can see in the lower part of the above chart, gold moved higher yesterday, but it moved up rather insignificantly. Gold futures were up by precisely $11.20, which means that they didn't erase Monday's decline.
Meanwhile in Precious Metals
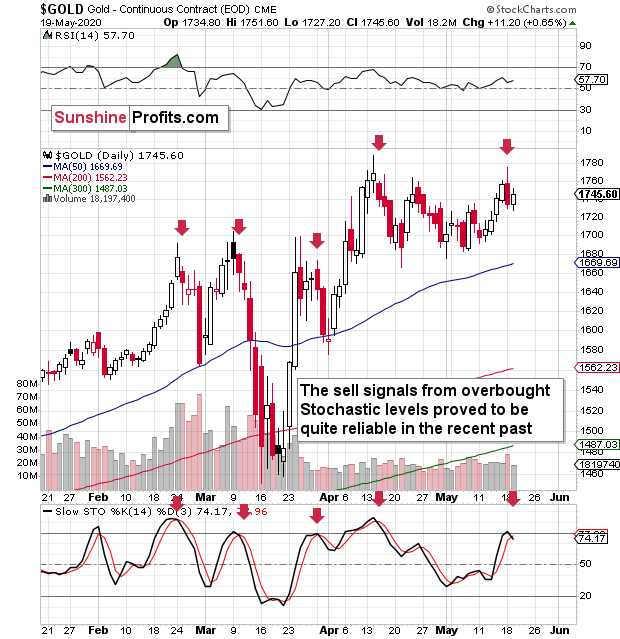
Gold's unwillingness to react to USD's bullish lead can be viewed as bearish. The same goes for the sell signal from the Stochastic indicator. These signals that took place after Stochastic was close to the 80 level, were followed by quite visible declines in gold.
Consequently, the implications of yesterday's session - and this week's developments in gold - are bearish.
Then there's silver that's soaring like there's no tomorrow and miners that just confirmed their breakout above the previous May highs.
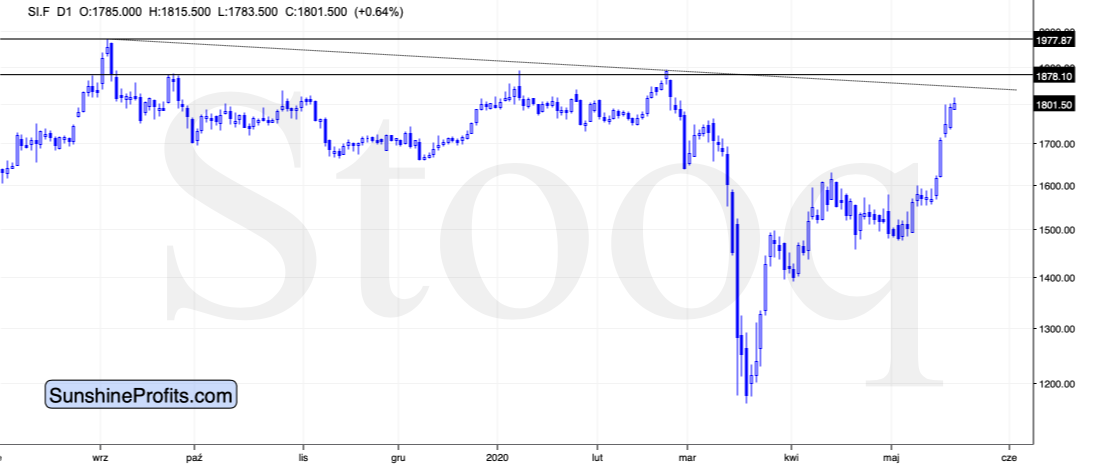
Silver moved higher right after forming the daily reversal and it even moved above the intraday high earlier today. Silver is clearly outperforming gold. In case of the gold to silver ratio that's based on futures, we saw a move slightly below 100, and in case of the ratio based on the spot prices, the ratio just touched the 100 level a few hours ago, and then it moved back up.
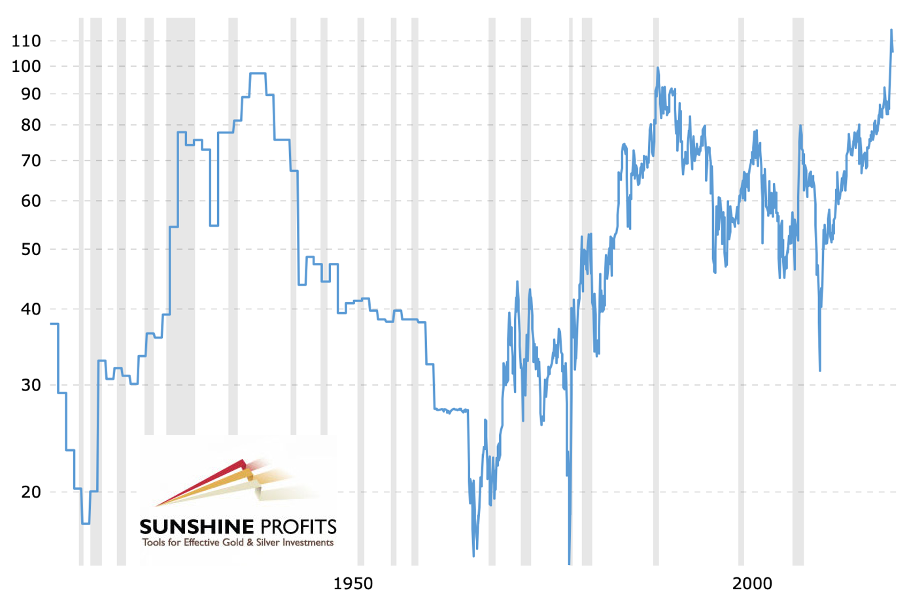
On one hand, the breakout above the 100 level in the gold to silver ratio seems to have been just verified, and it's bullish.
On the other hand, silver reversed slightly above $18, which doesn't correspond to a major resistance level. This means that the white metal could still move higher before topping. There are several resistance levels visible on the previous silver chart - between about $18,50 and about $20. Will silver really move as high shortly?
If the USD Index is bottoming and the general stock market is topping, then the above is very doubtful. In fact, silver's relative strength on its own makes the short-term picture for the precious metals market rather bearish, because silver usually plays major catch-ups with gold in the final part of the rally. It definitely happened already and the extent to which silver outperformed gold, was clear and loud. Consequently, the top might already be in after all, as the 100 level in the gold to silver ratio is more important than any of the above-market individual silver resistance levels.
This leaves us with the bullish implications of yesterday's move in the mining stocks.
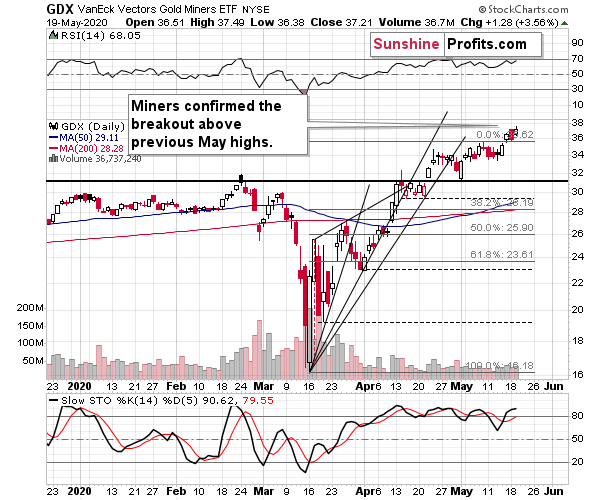
There are two possibilities at this moment. Either the GDX ETF is breaking substantially higher here... Or it's providing us with fake strength at the very end of the move.
Yes, the link between gold and gold miners is not as straightforward as it seems at first sight. On average, miners do tend to be weak sooner than gold during its rallies. However, there's also this very final part of the upswing, in which miners fake their strength. Let's take a closer look at this phenomenon. The chart below features gold and the HUI Index - proxy for gold stocks.
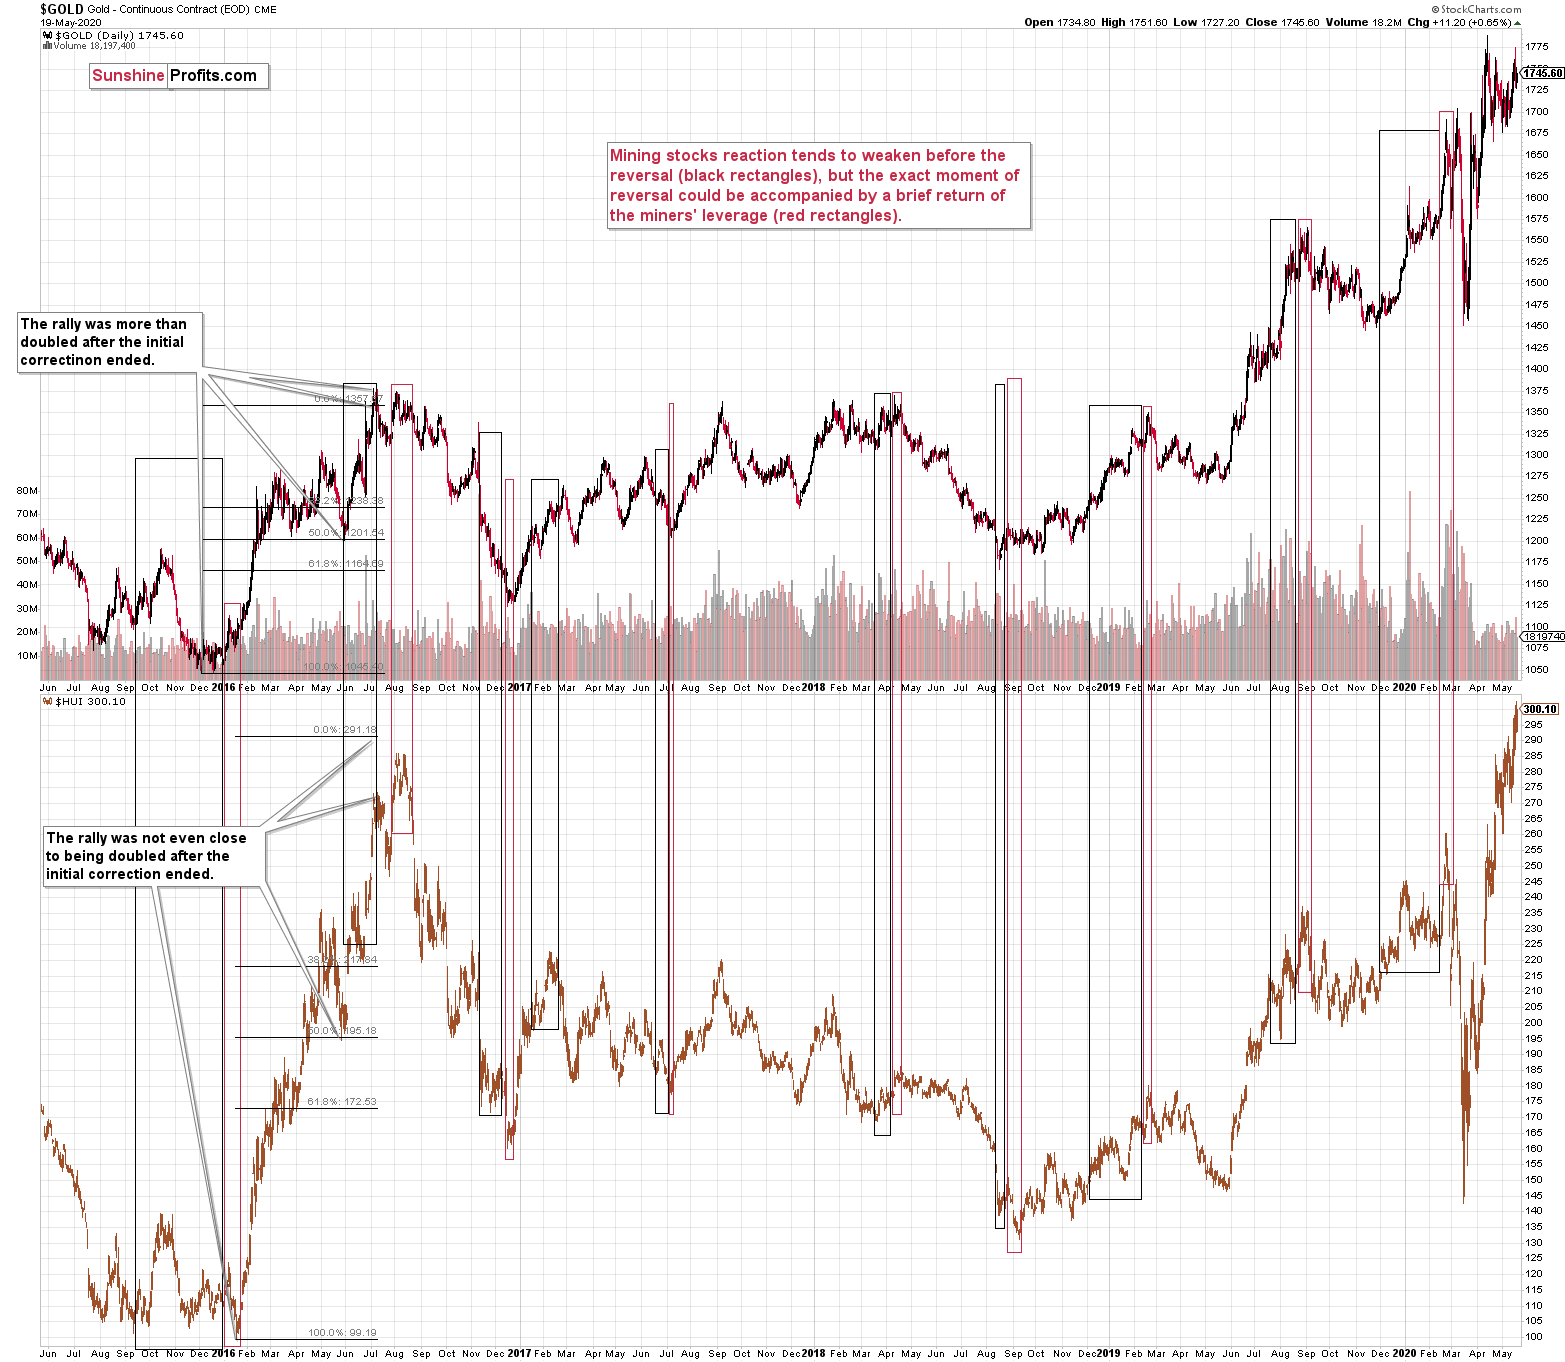
The above-mentioned link works both ways. That's how the 2015/2016 decline ended. Miners underperformed in the first days of January and this was a fake move. That's also how the February-March decline started - with gold miners' outperformance. And that's how many other moves in gold and gold miners have ended.
The black rectangles show periods when gold miners refused to fully follow gold's lead, and the red rectangles show when gold miners temporarily multiplied gold's signals.
So, is miners' "strength" really "strength" to the full extent of this word's definition? Given all the other points made today, this still seems doubtful.
Summary
Summing up, despite the very recent moves higher, especially in silver, the outlook for the precious metals market is bearish for the next few weeks, and it's very bullish for the following months. Even if gold, silver, and mining stocks are not going to move to new 2020 lows, they are still likely to decline visibly when the USD Index soars. Based on Monday's reversals in gold and silver, silver's outperformance and the verification of the breakout in the gold to silver ratio by the move back to the 100 level, it seems that the end of the current short-term upswing is at hand.
After the sell-off (that takes gold below $1,400), we expect the precious metals to rally significantly. The final decline might take as little as 1-3 weeks, so it's important to stay alert to any changes.
Most importantly - stay healthy and safe. We made a lot of money on the March decline and the subsequent rebound (its initial part) price moves (and we'll likely make much more in the following weeks and months), but you have to be healthy to really enjoy the results.
As always, we'll keep you - our subscribers - informed.
To summarize:
Trading capital (supplementary part of the portfolio; our opinion): Full speculative short positions (150% of the full position) in mining stocks is justified from the risk to reward point of view with the following binding exit profit-take price levels:
Senior mining stocks (price levels for the GDX ETF): binding profit-take exit price: $10.32; stop-loss: none (the volatility is too big to justify a SL order in case of this particular trade); binding profit-take level for the DUST ETF: $231.75; stop-loss for the DUST ETF: none (the volatility is too big to justify a SL order in case of this particular trade)
Junior mining stocks (price levels for the GDXJ ETF): binding profit-take exit price: $9.57; stop-loss: none (the volatility is too big to justify a SL order in case of this particular trade); binding profit-take level for the JDST ETF: $284.25; stop-loss for the JDST ETF: none (the volatility is too big to justify a SL order in case of this particular trade)
For-your-information targets (our opinion; we continue to think that mining stocks are the preferred way of taking advantage of the upcoming price move, but if for whatever reason one wants / has to use silver or gold for this trade, we are providing the details anyway. In our view, silver has greater potential than gold does):
Silver futures downside profit-take exit price: $8.58 (the downside potential for silver is significant, but likely not as big as the one in the mining stocks)
Gold futures downside profit-take exit price: $1,382 (the target for gold is least clear; it might drop to even $1,170 or so; the downside potential for gold is significant, but likely not as big as the one in the mining stocks or silver)
Long-term capital (core part of the portfolio; our opinion): No positions (in other words: cash)
Insurance capital (core part of the portfolio; our opinion): Full position
Whether you already subscribed or not, we encourage you to find out how to make the most of our alerts and read our replies to the most common alert-and-gold-trading-related-questions.
Please note that the in the trading section we describe the situation for the day that the alert is posted. In other words, it we are writing about a speculative position, it means that it is up-to-date on the day it was posted. We are also featuring the initial target prices, so that you can decide whether keeping a position on a given day is something that is in tune with your approach (some moves are too small for medium-term traders and some might appear too big for day-traders).
Plus, you might want to read why our stop-loss orders are usually relatively far from the current price.
Please note that a full position doesn't mean using all of the capital for a given trade. You will find details on our thoughts on gold portfolio structuring in the Key Insights section on our website.
As a reminder - "initial target price" means exactly that - an "initial" one, it's not a price level at which we suggest closing positions. If this becomes the case (like it did in the previous trade) we will refer to these levels as levels of exit orders (exactly as we've done previously). Stop-loss levels, however, are naturally not "initial", but something that, in our opinion, might be entered as an order.
Since it is impossible to synchronize target prices and stop-loss levels for all the ETFs and ETNs with the main markets that we provide these levels for (gold, silver and mining stocks - the GDX ETF), the stop-loss levels and target prices for other ETNs and ETF (among other: UGLD, DGLD, USLV, DSLV, NUGT, DUST, JNUG, JDST) are provided as supplementary, and not as "final". This means that if a stop-loss or a target level is reached for any of the "additional instruments" (DGLD for instance), but not for the "main instrument" (gold in this case), we will view positions in both gold and DGLD as still open and the stop-loss for DGLD would have to be moved lower. On the other hand, if gold moves to a stop-loss level but DGLD doesn't, then we will view both positions (in gold and DGLD) as closed. In other words, since it's not possible to be 100% certain that each related instrument moves to a given level when the underlying instrument does, we can't provide levels that would be binding. The levels that we do provide are our best estimate of the levels that will correspond to the levels in the underlying assets, but it will be the underlying assets that one will need to focus on regarding the signs pointing to closing a given position or keeping it open. We might adjust the levels in the "additional instruments" without adjusting the levels in the "main instruments", which will simply mean that we have improved our estimation of these levels, not that we changed our outlook on the markets. We are already working on a tool that would update these levels on a daily basis for the most popular ETFs, ETNs and individual mining stocks.
Our preferred ways to invest in and to trade gold along with the reasoning can be found in the how to buy gold section. Additionally, our preferred ETFs and ETNs can be found in our Gold & Silver ETF Ranking.
As a reminder, Gold & Silver Trading Alerts are posted before or on each trading day (we usually post them before the opening bell, but we don't promise doing that each day). If there's anything urgent, we will send you an additional small alert before posting the main one.
Thank you.
Sincerely,
Przemyslaw Radomski, CFA
Editor-in-chief, Gold & Silver Fund Manager

