

Briefly: in our opinion, full (300% of the regular position size) speculative short positions in junior mining stocks are justified from the risk/reward point of view at the moment of publishing this Alert.
PLEASE NOTE:
Dear Subscribers,
due to your Editor’s travel schedule, tomorrow’s regular Gold & Silver Trading Alert will cover the fundamental part of the analysis. However, if anything major happens and it impacts his views on the positions that are currently justified from the risk to reward point of view, he’ll send you a quick intraday message.
Stay tuned!
The GDXJ, a proxy for junior miners, just closed at the second-lowest level since April 2020 – and that is huge. What does it mean?
Well, it means that profits on our short positions in juniors increased once again. However, there’s more to yesterday’s session than just that.
Namely, due to yesterday’s 2%+ decline in the GDXJ ETF, it’s now clear that junior miners practically can’t wait to move to lower levels, as they are declining even without much help from gold.
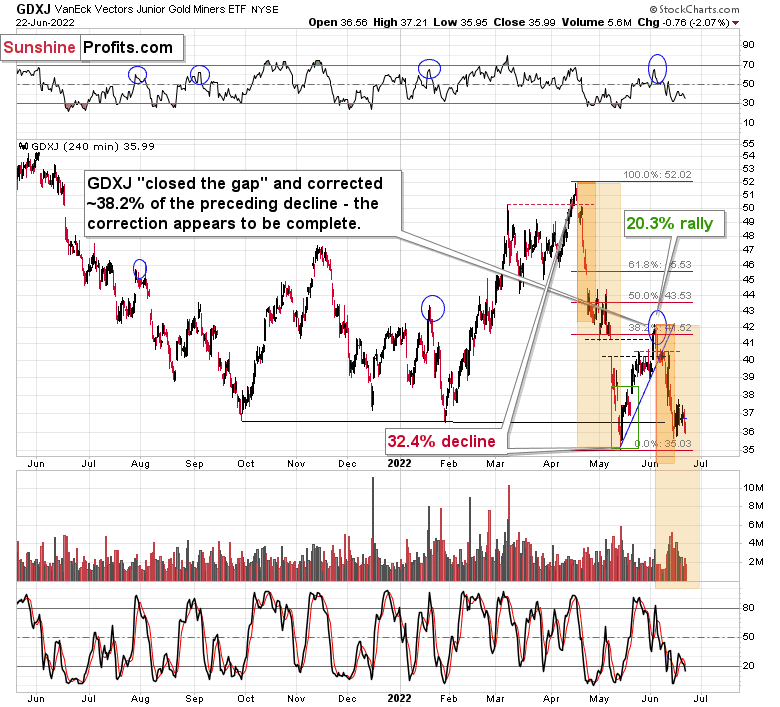
Without even getting into specific calculations, it’s clear that junior miners are now trading very close to their May lows.
What is even more interesting, the GDXJ closed below the September 2021 low, and it didn’t immediately rally back up. The fact that junior miners declined below this low yesterday without a significant bearish push from gold and from the general stock market tells us that this time, the breakdown below the September 2021 low is likely to be confirmed.
This, in turn, means that juniors appear to be finally ready to head to much lower levels.
When the GDXJ moved below those lows (on May 12), I wrote that they declined too far too fast, and I switched our short positions into long ones. However, this time, it’s not the case that they declined too far too fast. Conversely, junior miners are now at/after a brief pause. This means that they are ready to fall lower.
Additionally, please note how perfectly the current situation resembles what we saw at the end of April and in the first days of May. The decline that preceded that previous consolidation was bigger than the recent one, so it’s quite normal that the consolidation that followed this time was also smaller and not as volatile. Other than that, the two moves are alike. Since a big move lower followed the previous consolidation, another move lower appears likely this time as well.
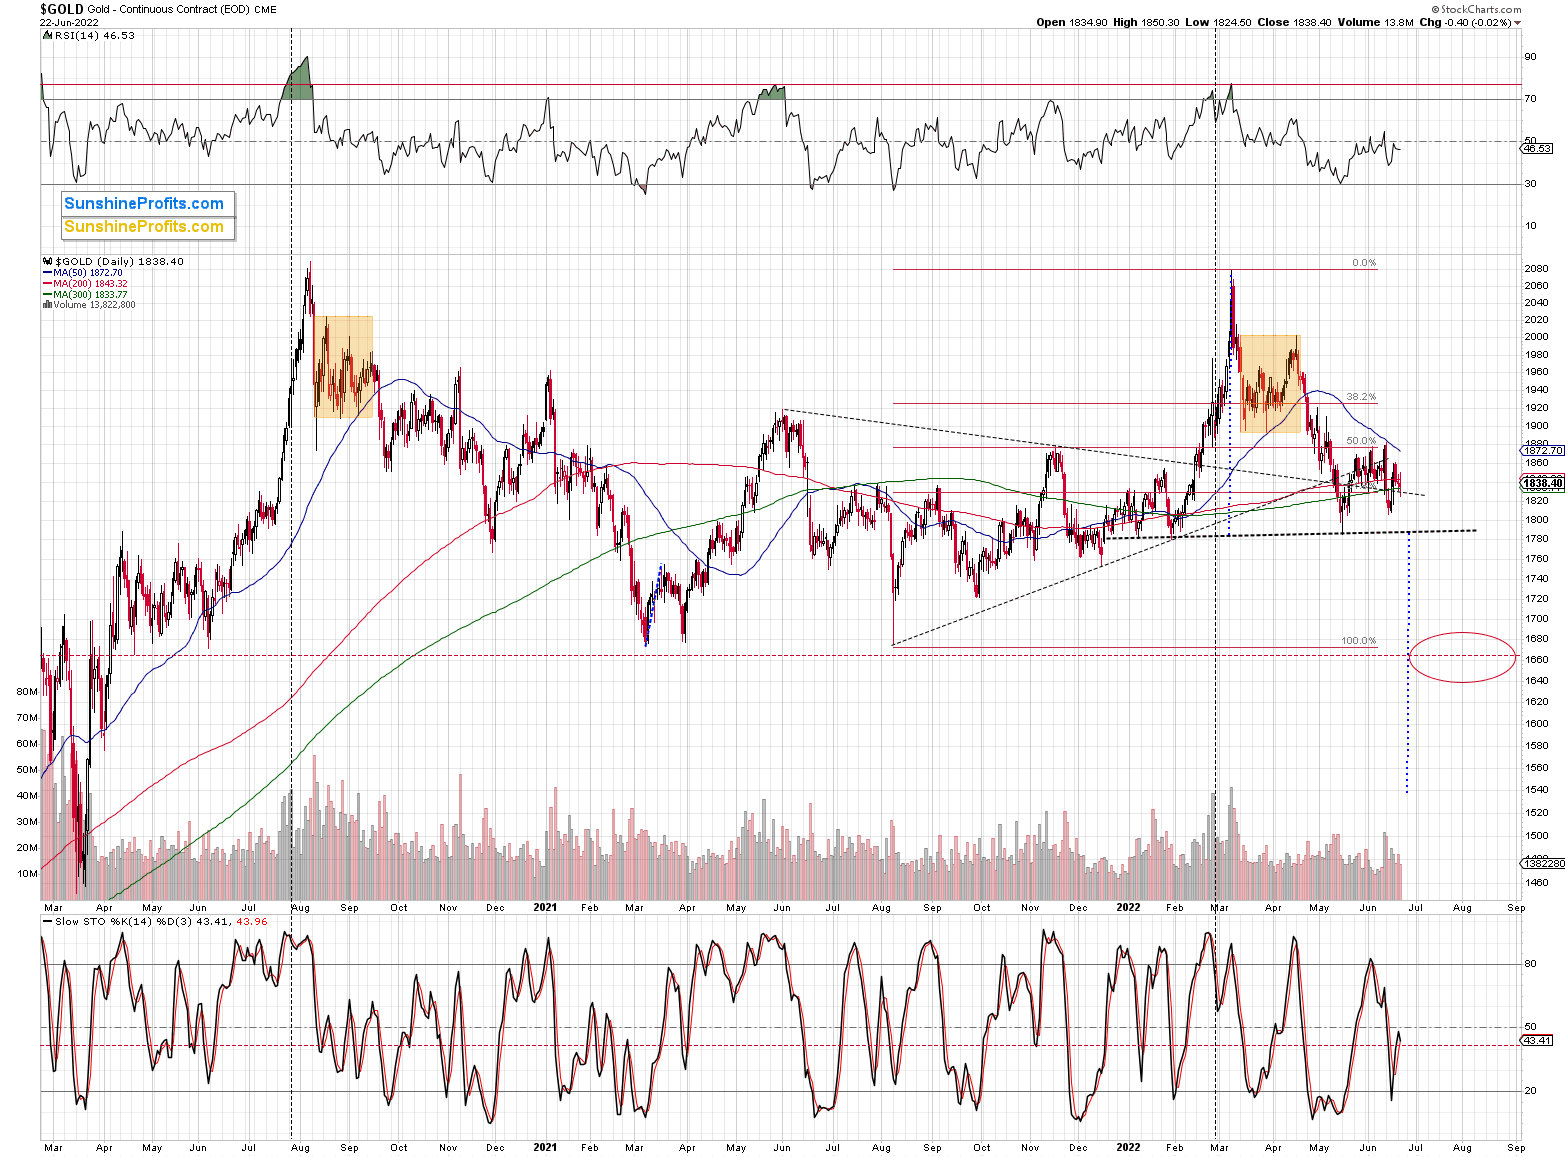
Also, as I wrote earlier, please keep in mind that juniors just declined without almost any help from gold. Unlike junior miners, gold is not at its September 2021 lows, and it’s not at its mid-May 2022 lows, either.
Miners tend to lead gold, and this time it’s quite clear that they are leading it lower.
Once the current consolidation in gold ends, it appears likely that gold will replicate (to a considerable extent) the decline that preceded the consolidation. This would imply a move back to gold’s previous 2021 lows.
This, in turn, would be likely to have a devastating impact on junior mining stock prices.
You have been warned.
Having said that, let’s take a look at the markets from a more fundamental angle.
I Warned
With investors waking up to the reality that the Fed is “all in” on combatting inflation, financial assets have lost their luster. Moreover, with liquidity beneficiaries the hardest hit, the air has come out of the speculative balloon.
Furthermore, with commodities being the latest asset class to suffer a crisis of confidence, I warned on Nov. 18 that market participants were ignoring the Fed at their own peril. I wrote:
The hyper-inflationists are missing the forest through the trees. In their argument, they assume that high U.S. debt levels make raising interest rates impossible. As a result, the U.S. government will allow inflation to run rampant and the U.S. dollar will crash in the process. However, while it’s an interesting story, it’s unrealistic. And why is that?
Well, for one, not raising interest rates will likely do more harm to the U.S. economy than tightening monetary policy. The reasons are outlined above: if prices keep rising and consumer confidence keeps falling, eventually demand destruction unfolds. As a result, if policymakers don’t solve their inflationary conundrum, failure to do so will likely push the U.S. economy into recession.
Second, the political component shouldn’t be ignored. Biden’s approval ratings keep hitting new lows along with consumer confidence. Thus, is it in his best interest to maintain the status quo? Of course not. That’s why he’s been so forceful on inflation over the last few weeks. Essentially, if he (and/or the Fed) does nothing, he’ll likely lose the next presidential election and the Democrats will likely lose control of Congress. However, if he tames inflation, then he’s a hero. And left with those two options, which one do you think he’ll choose?
To that point, with the thesis playing out as expected, Fed Chairman Jerome Powell made the point for me during his Congressional hearing on Jun. 22. He said:
"It is essential that we bring inflation down if we are to have a sustained period of strong labor market conditions that benefit all (…) .We understand the hardship high inflation is causing. We are strongly committed to bringing inflation back down, and we are moving expeditiously to do so.”
As a result, with the U.S. economy walking a tightrope, the man at the top said that letting inflation rage is not an option.
Please see below:
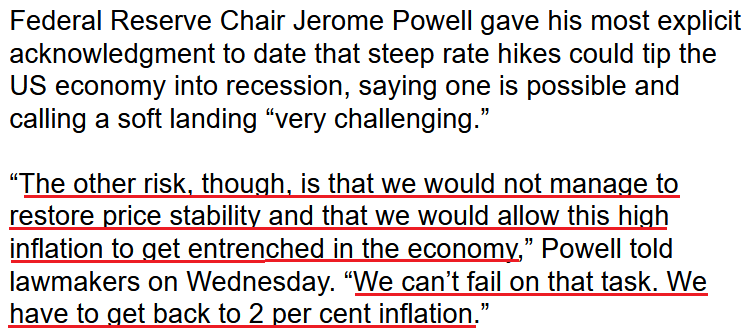 Source: Bloomberg
Therefore, while I warned on numerous occasions that the hyper-inflation narrative lacked fundamental logic, Powell realizes that the outcome is worse than a recession induced by higher interest rates.
Think about it: what was the hyper-inflationists’ end game? If Powell had turned dovish and let inflation soar, the policy would have only widened the growth-inflation gap and culminated in an even larger collapse down the road. Thus, it’s prudent for him to choose short-term suffering over long-term destruction.
To that point, Chicago Fed President Charles Evans said on Jun. 22: “Seventy-five [basis points] is a very reasonable place to have a discussion. I think 75 would be in line with continued strong concerns that the inflation data isn't coming down as quickly as we thought."
He added:
"The challenge for monetary policy that's always trying to engineer a soft landing during a rising rate environment is something else happens and then that's the additional shock that takes the economy down."
Thus, while Fed officials are slowly distancing themselves from the “soft landing” narrative, they understand that doing something is better than doing nothing.
Please see below:
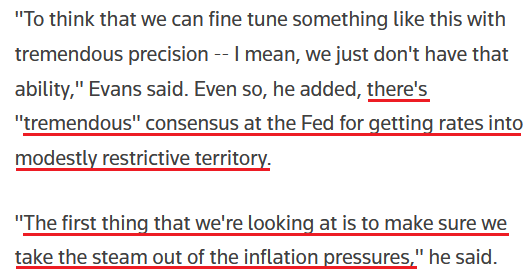 Source: Reuters
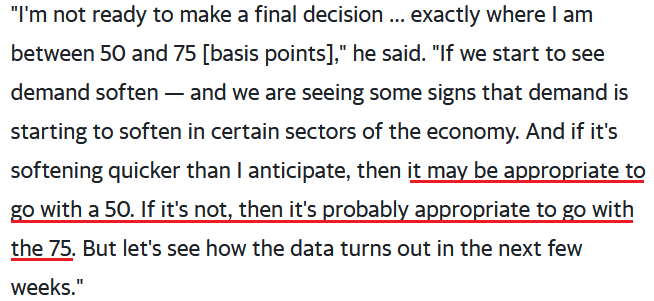
Making three of a kind, Philadelphia Fed President Patrick Harker said on Jun. 22: officials are “starting to see some signs of demand softening, which is exactly what we want. We don't want it to crash. We want to bring the economy into a safe position and in balance with supply and demand (...) .
"I think we've been very clear that we need to move to a restrictive stance. How we get there is dependent on the data. So we can't be that precise, [with] what we're going to be doing in September or December right now. I mean, the data will dictate that."
As a result, while he noted that lower inflation could reduce the need for aggressive rate hikes, he still supports at least 50 basis points in July.
Please see below:
 Source: Yahoo Finance
Thus, with long periods of unanchored inflation much worse than rate hikes and a mild-to-moderate recession, investors don’t realize that Fed officials’ hawkishness is in the best interest of the U.S. economy. However, with more rate hikes likely to cause more pain for financial assets, the drawdowns that may materialize over the next few months should provide us with long-term buying opportunities.
The Canary: Part 2
I’ve warned on numerous occasions that the Bank of Canada (BoC) is the hawkish canary in the coal mine. In a nutshell: due to the geographical proximity and the fact that 75% or more of Canadian exports are sent to the U.S., the two regions often have similar economic and monetary policy outcomes. To explain, I wrote on Apr. 14:
The BoC announced a 50 basis point rate hike on Apr. 13. With the Fed likely to follow suit in May, the domestic fundamental environment confronting the PMs couldn’t be more bearish.
Moreover, BoC Governor Tiff Macklem (Canada's Jerome Powell) said that "We are committed to using our policy interest rate to return inflation to target and will do so forcefully if needed."
Furthermore, while he added that the BoC could "pause our tightening" if inflation subsides, he cautioned that "we may need to take rates modestly above neutral for a period to bring demand and supply back into balance and inflation back to target."
However, with the latter much more likely than the former, the BoC's decision is likely a preview of what the Fed should deliver in the months ahead.
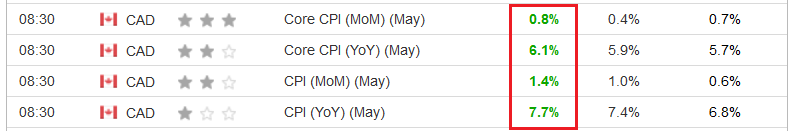
To that point, with Canadian inflation hitting another 2022 high on Jun. 22, the North American thesis continues to unfold as expected. For context, the figures in the middle column were economists’ consensus estimates.
Please see below:
 Source: Investing.com
Also, while investors continue to underestimate the demand side of the inflation equation, the supply-side excuses lack fundamental merit. For example, with the Canadian core Consumer Price Index (CPI) – which excludes the inflationary impacts of food and energy – outperforming month-over-month (MoM) and year-over-year (YoY), the pricing pressures are more broad-based than the consensus realizes.
The official Statistics Canada report stated:
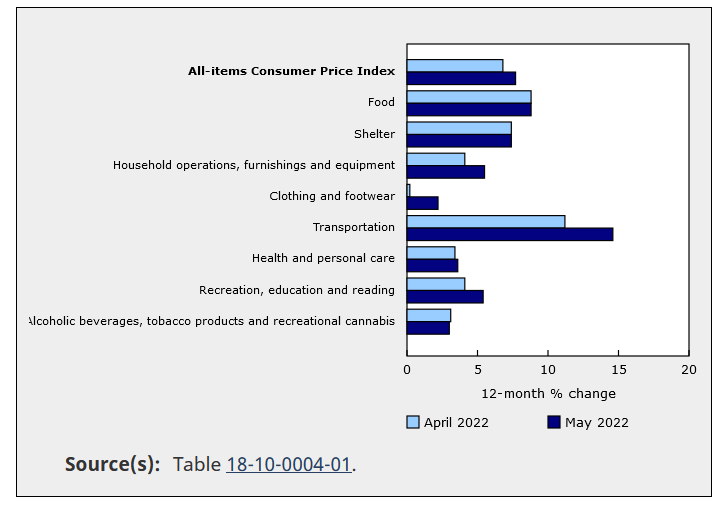
“YoY growth in prices for services increased to 5.2% in May, following a 4.6% gain in April. As public health measures have eased, Canadians have sought out leisure activities, stayed in hotels and have eaten out more often.”
As a result, the Canadian CPI for furniture, clothing, transportation, personal care and recreation increased in May.
Please see below:
 Source: Statistics Canada
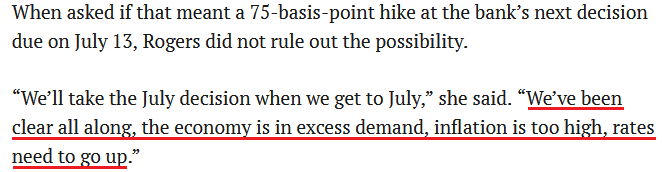
More importantly, BoC Senior Deputy Governor Carolyn Rogers said on Jun. 22 that 7.7% annualized inflation was an “unwelcome number.” She added:
“Inflation is too high; it’s hurting Canadians. It’s keeping us up at night and we will not rest easy until we get it back down to target (…). That’s why we’re raising interest rates and as we say, we’re raising them quite aggressively.”
Please see below:
 Source: Financial Post
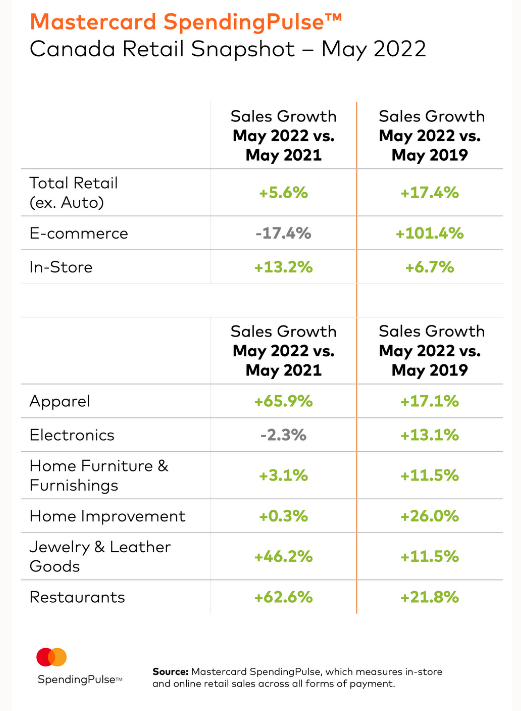
Speaking of “excess demand,” I noted on Jun. 22 that Mastercard released its SpendingPulse retail sales report on Jun. 14. An excerpt read:
“Total U.S. retail sales excluding automotives increased 10.5% year-over-year in May, and 21.4% compared to pre-pandemic May 2019. This is outpacing the YoY monthly growth experienced thus far in 2022. In-store sales were a key driver, up 13.7% compared to pre-pandemic levels.”
Likewise, Mastercard’s Canadian retail sales report showcased similar results:
“With graduations, weddings, and vacations lined up for the foreseeable future, the demand for Apparel continued with double-digit growth again this month (+65.9% YOY/+17.1% pre-pandemic). May showed the highest rate of year-over-year growth for Apparel so far in 2022.”
In addition:
“Jewelry and Leather Goods continued to see strong demand (+46.2% YoY/+11.5% pre-pandemic) alongside the Apparel category as consumers shop for accessories to complement their new looks.”
Moreover:
“Restaurant sales remained elevated in May (+62.6% YoY/+21.8% pre-pandemic) with sustained double-digit growth, reflecting consumers’ growing appetite for dining experiences heading into the summer.”
As a result, inflation dynamics are shifting throughout categories, as Canadian consumers swapped online shopping and electronics for in-person experiences. Therefore, while investors continue to wonder why the pricing pressures won’t abate, they don’t realize that unprecedented stimulus has fueled abnormal demand.
Please see below:
The Bottom Line
The “transitory” camp suffered a painful death, and now the hyper-inflationists look destined to succumb to the same fate. With the Fed hawked up and more rate hikes on the horizon, there is only one plausible economic outcome. Officials must curb inflation to avoid a larger crisis. If not, the 1970s/1980s malaise will repeat itself where the U.S. entered recession four times in ~12 years. Thus, dealing with the problem is the lesser of two evils, even if that means hammering the financial markets along the way.
In conclusion, the PMs declined on Jun. 22, as Fed officials continued to amplify their hawkish threats. Moreover, with the Fed’s war on inflation poised to push the USD Index and U.S. real yields higher, more downside should confront the PMs over the next few months. As a result, gold, silver, and mining stocks’ medium-term outlooks remain extremely treacherous.
Overview of the Upcoming Part of the Decline
- It seems to me that the very-short-term rally in the precious metals market is either over or very close to being over. It’s so close to being over that I think it’s already a good idea to be shorting junior mining stocks.
- We’re likely to (if not immediately, then soon) see another big slide, perhaps close to the 2021 lows ($1,650 - $1,700).
- If we see a situation where miners slide in a meaningful and volatile way while silver doesn’t (it just declines moderately), I plan to – once again – switch from short positions in miners to short positions in silver. At this time, it’s too early to say at what price levels this could take place and if we get this kind of opportunity at all – perhaps with gold prices close to $1,600.
- I plan to exit all remaining short positions once gold shows substantial strength relative to the USD Index while the latter is still rallying. This may be the case with gold close to $1,400. I expect silver to fall the hardest in the final part of the move. This moment (when gold performs very strongly against the rallying USD and miners are strong relative to gold after its substantial decline) is likely to be the best entry point for long-term investments, in my view. This can also happen with gold close to $1,400, but at the moment it’s too early to say with certainty.
- The above is based on the information available today, and it might change in the following days/weeks.
You will find my general overview of the outlook for gold on the chart below:
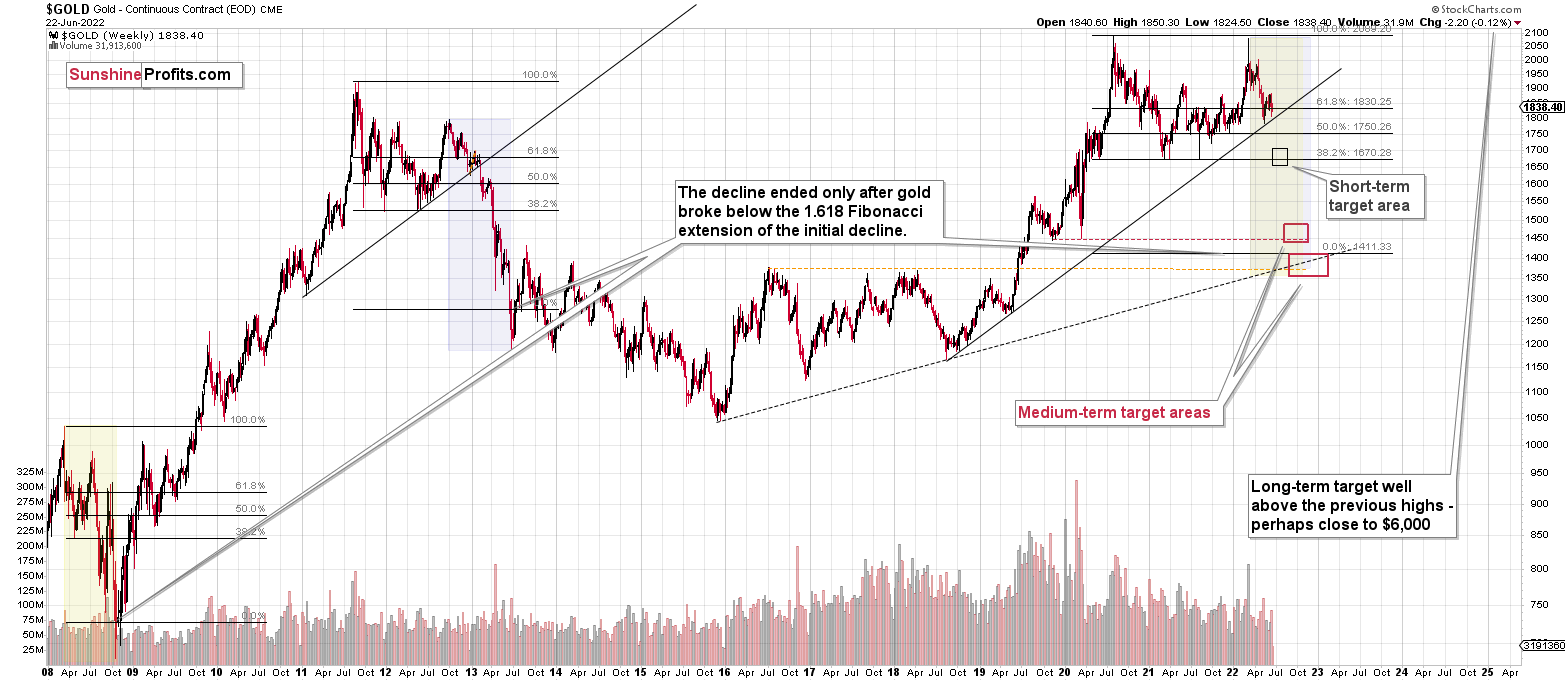
Please note that the above timing details are relatively broad and “for general overview only” – so that you know more or less what I think and how volatile I think the moves are likely to be – on an approximate basis. These time targets are not binding or clear enough for me to think that they should be used for purchasing options, warrants, or similar instruments.
Letters to the Editor
Q: I would appreciate your explanation of this rebound in gold if it is due to any cause that you should consider.
Warm regards as always.
A: I don’t have clear a explanation for yesterday’s intraday rally in gold. It might have been due to markets’ expectations regarding Powell’s yesterday’s testimony. Generally, there are rarely clear explanations behind each small move in the markets. The only good answer is that buying power temporarily outweighed selling power. As clear as that and as uninformative as that.
In particular, it’s the small price moves (below ~$20 in gold) that are particularly difficult to explain. Moves like that (or even much bigger ones) might simply be due to technical factors.
The best thing about the markets is that you can estimate the outlook without the need to explain each small price swing. When you pinpoint the right analogies, discover technical patterns and cycles, and measure the way gold/gold stocks/silver react to each other’s movement and to their key price drivers (technically, these would be the USD Index and the general stock market), then it is possible to estimate the outlook without the need to reply to the “why” question regarding specific price moves.
The exception is when a given market clearly reacts to a big event, and it’s practically undisputable that it was this event that caused it. Then, one could measure the strength of the reaction against what would be “normally expected” in those circumstances. This relative performance could then be used to assess the strength of the said market. However, it is usually the way the market reacts that is informative, not the reason behind the price move itself.
Q: I have a question about the DXY. I was curious as to why the US Dollar (DXY) continued to fall after the Fed raised interest rates by 75 basis points last week and is expected to raise rates further throughout the rest of the year. I understand that nothing moves in a straight line, but with such hawkish intentions toward interest rates, why has the dollar fallen so much vs going up?
A: “The market buys the rumor and sells the fact”.
The above happened in the case of the USD Index.
The USDX rallied in the days preceding the rate hike, so it already reacted to the news – it simply reacted to it before it was announced.
Besides, has it fallen that much?
The USD Index gained about 15 index points in the past year and now it has declined by a bit more than 1 index point. That’s just a little, in my view, not a lot.
In order to determine whether a given move is big, small, or rather normal, it’s good to have some context.
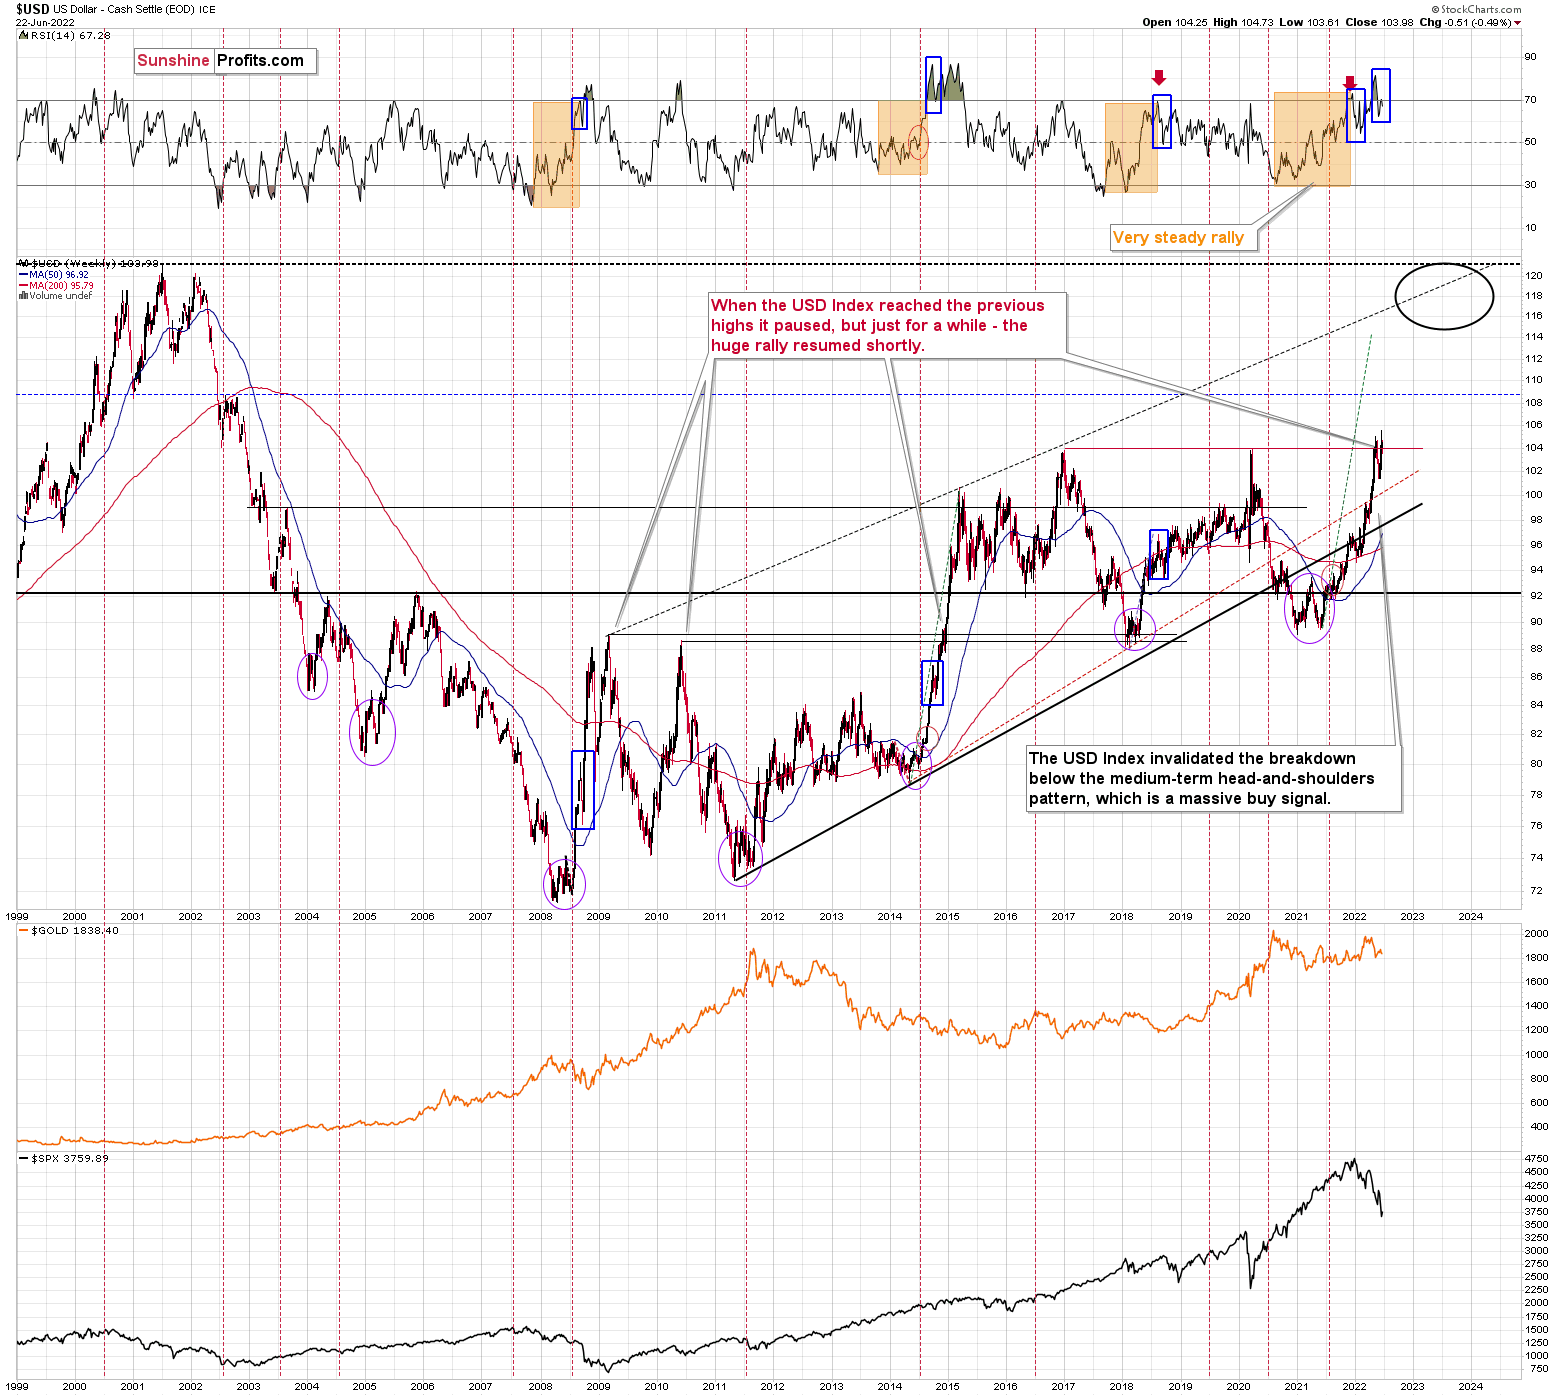
From the long-term point of view, the USD Index is in one of the biggest rallies of the past decades. It’s not the sharpest one, but this could also mean that it’s less vulnerable to being suddenly reversed, as the “too far too fast” factor doesn’t come into play that much.
Moreover, the above chart provides us with another explanation behind the “necessity” for the USD Index to correct here. It was likely not just the “buy the rumor, sell the fact” behavior that drove the USDX’s prices recently. It was also the presence of very strong, long-term resistance in the form of the previous two long-term highs (marked with a horizontal, red line).
This might have made people doubt whether the USDX has enough strength to break it and rally further. In my view, it does have this strength – the real rates are going up in the U.S. much faster than in the Eurozone (the EUR/USD is the most important component in the USD Index).
We saw something similar in 2014. The USDX hesitated as it approached the previous long-term highs, but when it broke higher (after only a short-term pause), it soared substantially without looking back. We might be just ahead of something similar right now. Of course, the implications for the precious metals sector are very bearish in the coming weeks/months.
Summary
Summing up, it seems to me that the short-term rally in the precious metals market is over, and the decline will now continue. And the tiny correction’s days are likely numbered, too.
I previously wrote that the profits from the previous long position (congratulations once again) were likely to further enhance the profits on this huge decline, and that’s exactly what happened. The profit potential with regard to the upcoming gargantuan decline remains huge.
As investors are starting to wake up to reality, the precious metals sector (particularly junior mining stocks) is declining sharply. Here are the key aspects of the reality that market participants have ignored:
- rising real interest rates,
- rising USD Index values.
Both of the aforementioned are the two most important fundamental drivers of the gold price. Since neither the USD Index nor real interest rates are likely to stop rising anytime soon (especially now that inflation has become highly political), the gold price is likely to fall sooner or later. Given the analogy to 2012 in gold, silver, and mining stocks, “sooner” is the more likely outcome.
After the final sell-off (that takes gold to about $1,350-$1,500), I expect the precious metals to rally significantly. The final part of the decline might take as little as 1-5 weeks, so it's important to stay alert to any changes.
Also, on an administrative note, due to your Editor’s travel schedule, tomorrow’s regular Gold & Silver Trading Alert will cover the fundamental part of the analysis. However, if anything major happens and it impacts my views on the positions that are currently justified from the risk to reward point of view, I’ll send you a quick intraday message.
As always, we'll keep you – our subscribers – informed.
To summarize:
Trading capital (supplementary part of the portfolio; our opinion): Full speculative short positions (300% of the full position) in junior mining stocks are justified from the risk to reward point of view with the following binding exit profit-take price levels:
Mining stocks (price levels for the GDXJ ETF): binding profit-take exit price: $27.32; stop-loss: none (the volatility is too big to justify a stop-loss order in case of this particular trade)
Alternatively, if one seeks leverage, we’re providing the binding profit-take levels for the JDST (2x leveraged). The binding profit-take level for the JDST: $18.35; stop-loss for the JDST: none (the volatility is too big to justify a SL order in case of this particular trade).
For-your-information targets (our opinion; we continue to think that mining stocks are the preferred way of taking advantage of the upcoming price move, but if for whatever reason one wants / has to use silver or gold for this trade, we are providing the details anyway.):
Silver futures downside profit-take exit price: $17.22
SLV profit-take exit price: $16.22
ZSL profit-take exit price: $41.47
Gold futures downside profit-take exit price: $1,706
HGD.TO – alternative (Canadian) 2x inverse leveraged gold stocks ETF – the upside profit-take exit price: $11.87
HZD.TO – alternative (Canadian) 2x inverse leveraged silver ETF – the upside profit-take exit price: $31.87
Long-term capital (core part of the portfolio; our opinion): No positions (in other words: cash)
Insurance capital (core part of the portfolio; our opinion): Full position
Whether you’ve already subscribed or not, we encourage you to find out how to make the most of our alerts and read our replies to the most common alert-and-gold-trading-related-questions.
Please note that we describe the situation for the day that the alert is posted in the trading section. In other words, if we are writing about a speculative position, it means that it is up-to-date on the day it was posted. We are also featuring the initial target prices to decide whether keeping a position on a given day is in tune with your approach (some moves are too small for medium-term traders, and some might appear too big for day-traders).
Additionally, you might want to read why our stop-loss orders are usually relatively far from the current price.
Please note that a full position doesn't mean using all of the capital for a given trade. You will find details on our thoughts on gold portfolio structuring in the Key Insights section on our website.
As a reminder - "initial target price" means exactly that - an "initial" one. It's not a price level at which we suggest closing positions. If this becomes the case (as it did in the previous trade), we will refer to these levels as levels of exit orders (exactly as we've done previously). Stop-loss levels, however, are naturally not "initial", but something that, in our opinion, might be entered as an order.
Since it is impossible to synchronize target prices and stop-loss levels for all the ETFs and ETNs with the main markets that we provide these levels for (gold, silver and mining stocks - the GDX ETF), the stop-loss levels and target prices for other ETNs and ETF (among other: UGL, GLL, AGQ, ZSL, NUGT, DUST, JNUG, JDST) are provided as supplementary, and not as "final". This means that if a stop-loss or a target level is reached for any of the "additional instruments" (GLL for instance), but not for the "main instrument" (gold in this case), we will view positions in both gold and GLL as still open and the stop-loss for GLL would have to be moved lower. On the other hand, if gold moves to a stop-loss level but GLL doesn't, then we will view both positions (in gold and GLL) as closed. In other words, since it's not possible to be 100% certain that each related instrument moves to a given level when the underlying instrument does, we can't provide levels that would be binding. The levels that we do provide are our best estimate of the levels that will correspond to the levels in the underlying assets, but it will be the underlying assets that one will need to focus on regarding the signs pointing to closing a given position or keeping it open. We might adjust the levels in the "additional instruments" without adjusting the levels in the "main instruments", which will simply mean that we have improved our estimation of these levels, not that we changed our outlook on the markets. We are already working on a tool that would update these levels daily for the most popular ETFs, ETNs and individual mining stocks.
Our preferred ways to invest in and to trade gold along with the reasoning can be found in the how to buy gold section. Furthermore, our preferred ETFs and ETNs can be found in our Gold & Silver ETF Ranking.
As a reminder, Gold & Silver Trading Alerts are posted before or on each trading day (we usually post them before the opening bell, but we don't promise doing that each day). If there's anything urgent, we will send you an additional small alert before posting the main one.
Thank you.
Przemyslaw Radomski, CFA
Founder, Editor-in-chief

