
- Euro & USD Indices
- General Stock Market
- Crude Oil
- Correlation Matrix
- Gold
- Silver
- Mining Stocks
- Letters from Subscribers
- RSI and/or MACD divergence based on prices for GLD, SLV, GDX, GDXJ
- UUP ETF - the equivalent of the $USD?
- Summary
The nice part about being a pessimist is that you are constantly being either proven right or pleasantly surprised. Right now the gold bears, those B negative types, are feeling that they have been proved right. One can hear their gloating and their drum beat for the death of gold. But as we see it, they are building a Wall of Worry for gold to climb when the time is right.
The Wall Street Journal ran a piece delineating the two sides of the gold debate giving five reasons why the gold bulls are right and five reasons why the gold bears are right.
Here is the 5-point gold “Bull” case:
- Fears that Cyprus may sell its gold have receded.
- The exuberance in the equities market will fade as soon as there is a major correction and investors will turn to gold.
- The monsoon season in India will end, the marriage season will begin and with it the traditional gold buying frenzy which will contribute to long-term demand.
- Banks in India count gold as part of the bank’s liquid ratio. As the asset base of banks will grow, so will demand for gold.
- Physical demand for gold is high.
We added a few more reasons that they didn’t think of.
- Central banks in various countries are buying the dollar to lower the value of their own currencies. That’s a currency war.
- Central banks are still net buyers of gold and we don’t see any signs of abatement.
- Central banks are flooding more and more fiat money into the system. The more they do, the more it loses its value. Gold cannot be printed and there is a limited amount that can be mined each year. Gold is money.
- Owning gold isn’t necessarily about buying low and selling high. Sometimes, it is about owning a long-term insurance policy.
- We don’t see a balanced budget in sight. We are not buying the economic recovery and the “recession is over” story.
Here are the five-point “Bear” case.
- The U.S. Fed could cut the stimulus sooner than later.
- Investor sentiment for gold is poor, to say the least.
- The U.S. dollar is strong which dampens gold’s appeal for other currency holders.
- Indian gold demand faces risks in the near term before the wedding season begins.
- There could be further liquidations of gold ETFs.
Regarding the first point, comments from Ben Bernanke to Congress this week suggested the central bank may begin tapering its bond-buying program in coming months. On Wednesday morning, stocks had rallied after the release of Bernanke’s prepared remarks, in which he said that premature tightening in policy could strangle the economic recovery. However, in the question-and-answer session, Bernanke said the Fed could slow the pace of asset purchases in the “next few meetings.” That comment sent the markets gyrating downwards making for a volatile and interesting day for precious metals. The sector moved slightly higher, then soared, stayed high for several minutes and then crashed with stocks following more or less the same path. The USD Index did the opposite. The Fed’s bond-buying program is one of the major factors underpinning the stock rally. There is no denying that there was a time when it directly helped gold. In Thursday early trading gold bounced back as the dollar fell sharply and European shares dropped after weak Chinese factory activity added to concerns about a delayed recovery. According to the Market Watch report, Thursday saw safe haven gold buying, something the yellow metal has not experienced in a while.
China manufacturing data issued Thursday came in weaker than expected, which is bearish for commodities. The fact that gold rallied in the face of this news suggests there was “solid safe-haven demand for gold Thursday,” according to MarketWatch.
As far as we can see, the U.S. Debt-to-GDP ratio continues to grow. Real interest rates are negative. The level of U.S. debt has remained near $1 trillion annually for the past four years. The fact that gold sentiment is so poor means that the speculators have been thrown out of the market and that there are not many more sellers around. They have constructed a lovely Wall of Worry for gold to climb. Once almost everyone who used to be a bull has become a bear, gold has nowhere left to go but up.
Last month’s savaging of the gold price no doubt has left new gold investors shaken. But the reasons that led to the bull market in gold have not changed. If anything they are stronger than ever. Unless governments suddenly start balancing budgets, or unless central bankers suddenly stop printing money, there is definitely a good case for those who side with the gold bulls. But as of now, Japan and the US have embarked on a record quantitative easing policy. The speculators have been shaken out and gold has moved into stronger hands who have been buying up the physical kind to keep and to hold.
We think that the gold bull market will resume its upward trajectory shortly. It is, however, vulnerable to further weakness in the short run.
Let's begin this week's technical part with the analysis of the US Dollar Index. We will start with the very long-term chart (charts courtesy by http://stockcharts.com.)
USD and Euro Indices
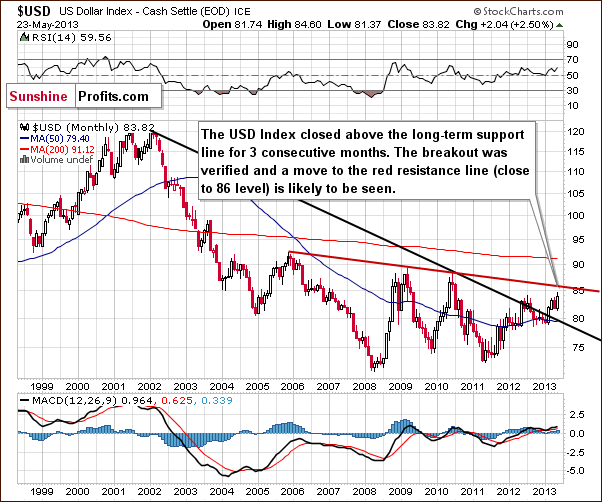
We begin this week with the very long-term USD Index chart. The index rallied strongly this week as expected since the declining long-term resistance line was broken a few months ago and the breakout was verified a few weeks ago. The breakout is clearly visible from the long-term perspective as is the rally which has followed it. Additional rally will likely be seen before any significant pause or decline here with resistance about two points (2.5%) above Thursday’s closing index level.
Comments made this week by Ben Bernanke in reference to limitations of the quantitative easing program have been bullish for the USD Index.
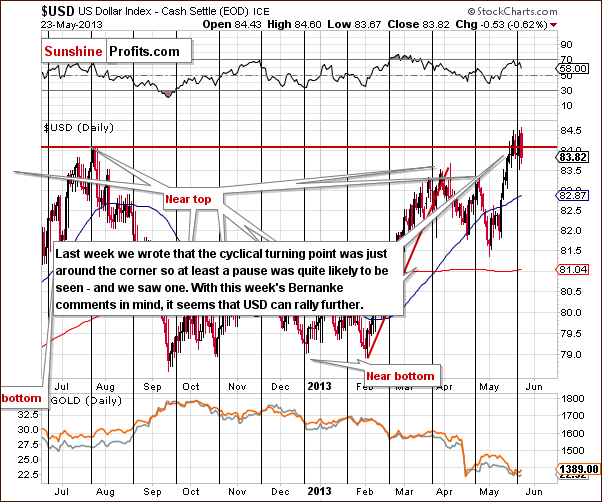
In this week’s short-term USD Index chart, we see some consolidation close to the cyclical turning point. In last week’s premium Update, we wrote about the cyclical turning point:
A reversal is likely once the cyclical turning point is reached, but the situation is a bit unclear since a resistance line has been reached already. Normally, a pause would be likely, but it could be the case that the pause has already been seen.
At this time, the expected consolidation has already been seen and the effects of cyclical turning point could be already behind us. The turning point is not a bullish signal on its own, but it’s no longer a bearish one.
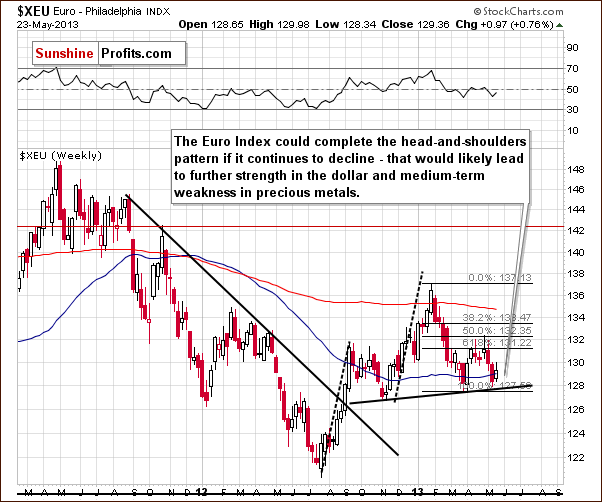
In the long-term Euro Index chart, some consolidation has been seen following the declines of this month. The head-and-shoulders pattern was not completed yet but it has not been invalidated. There is a good possibility that the pattern could still be completed in the coming weeks (keeping Bernanke’s comments in mind), so a downside target as low as the 122 level is still a possibility. This would likely coincide with strength in the USD Index and has bearish implications for the precious metals sector.
Summing up, the situation remains bullish for the USD Index. This has been the situation for some time now and the Fed news this week further strengthens this bullish outlook. The Euro Index may still have its partial, bearish head-and-shoulders pattern complete in the coming weeks.
General Stock Market
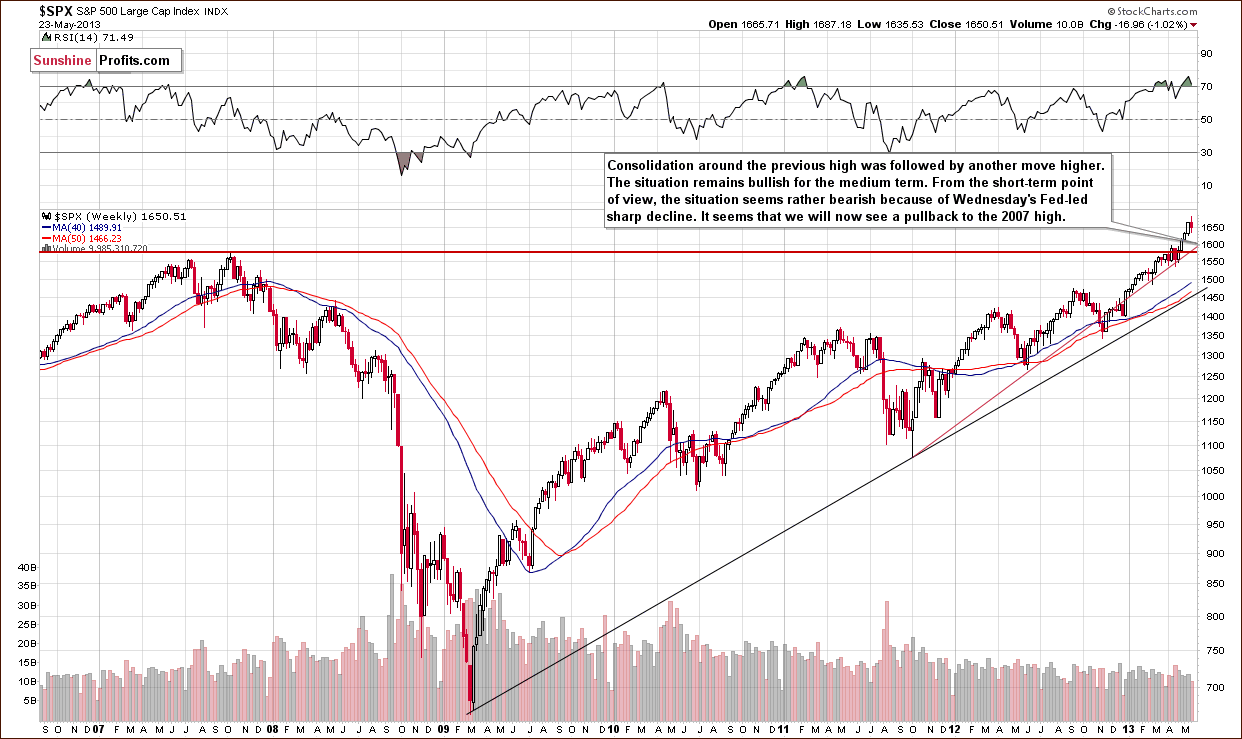
Turning now to the long-term S&P 500 Index chart, this week we saw some declines after several weeks of rally. Stocks appear to be taking a breather and this week’s decline appears to be nothing more than a correction to the level of the previously broken high. The outlook remains bullish for stocks in general although a pullback to the 2007 high could be in the cards which would bring prices down about 5% from Thursday’s closing level.
Crude Oil
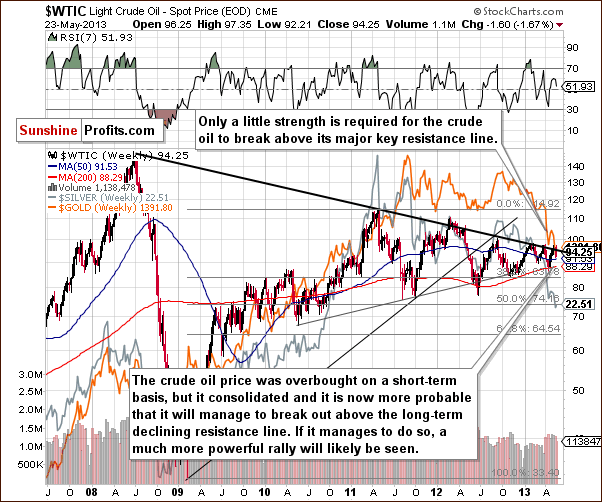
In this week’s Crude Oil price chart, we see that oil prices once again failed to break out this week and will have to attempt this once again. Just like we’ve been writing for weeks now, in order to say that a rally in crude oil prices appears to be in the cards, we would have to see a confirmation of the breakout. There have been simply too many false signals not to wait for a confirmation.
Gold and Silver Correlations
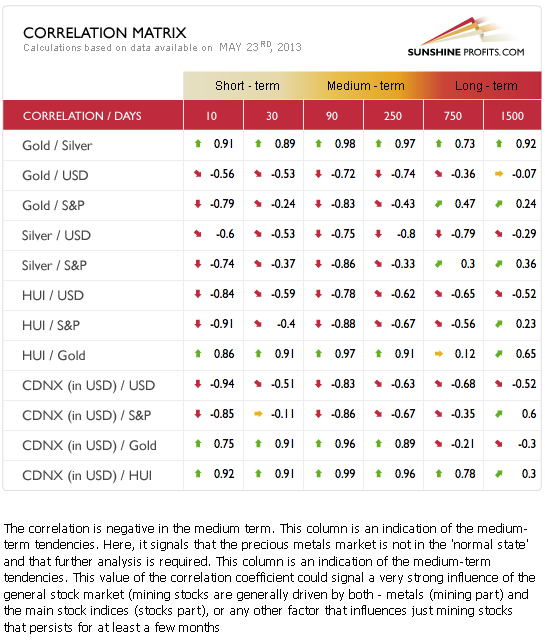
The Correlation Matrix is a tool which we have developed to analyze the impact of the currency markets and the general stock market upon the precious metals sector, (namely: gold correlations and silver correlations). The more important short-term and medium-term coefficients are slightly or strongly negative this week. The precious metals remain truly “anti-asset” at this time.
More significant coefficients are seen between the precious metals and the USD Index rather than with the general stock market. If the general stock market corrects and the USD Index rallies, it still seems best to lean towards a bearish interpretation for the gold, silver, and precious metals mining stocks.
Gold
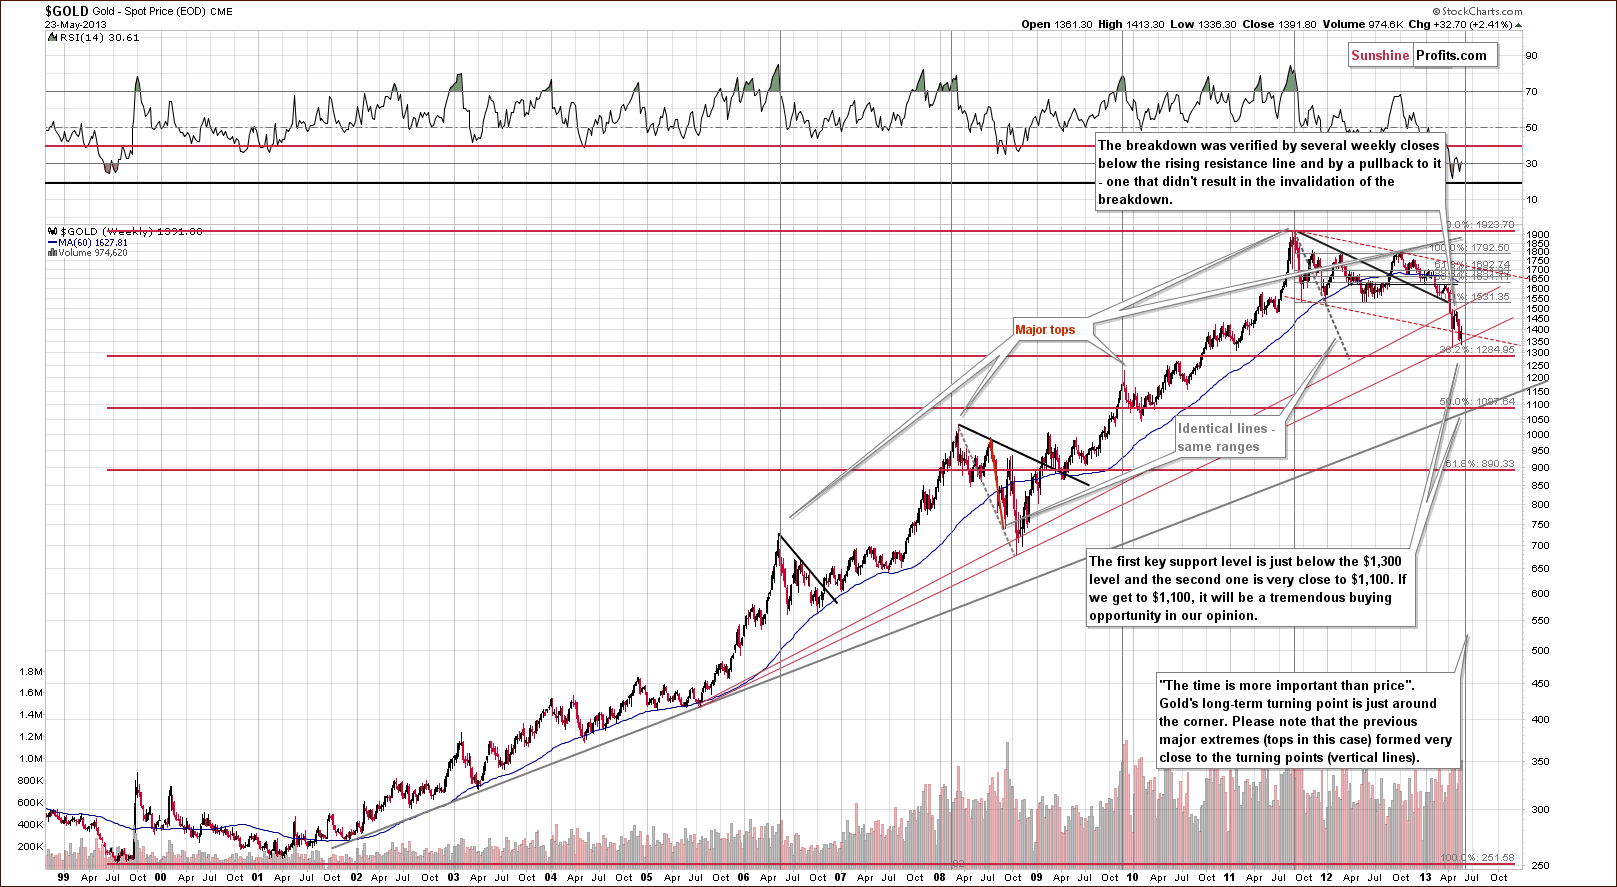
In this week’s very long-term gold chart, we see that gold prices moved higher this week but from the long-term perspective the rally is really not significant. It is barely visible here as it seems to simply be the expected period of consolidation which we have written about in the May 20 Market Alert:
[in 1976] there was a pullback in gold before it moved below the initial low. We could see this type of action shortly. If silver and mining stocks consolidate below their previous lows it will simply serve as a confirmation of the breakdown and an indication of further declines.
The very long-term cyclical turning point is now quite close and it still seems that a bottom will be formed relatively soon but it is not necessarily in just yet. The reverse parabola trading pattern remains, so the possibility of a sharp drop in price is still in place for the yellow metal. The next support level, the 38.2% Fibonacci retracement level is around $1,285 and could be close to the level where the bottom finally forms, but a sharp intra-day or intra-week drop below it, would not surprise us either.
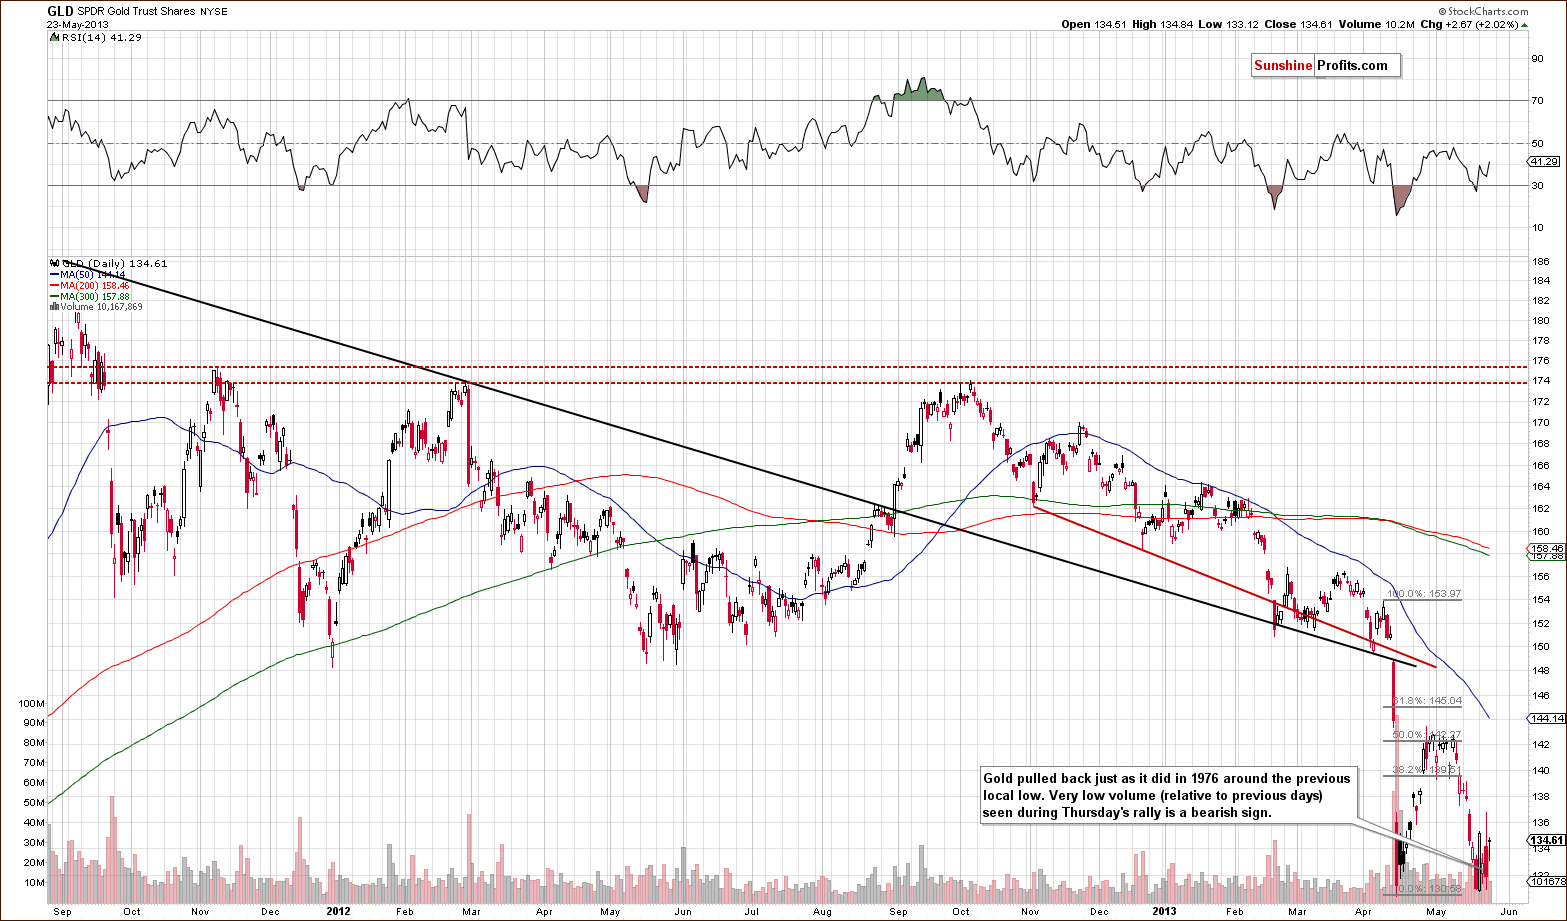
In this week’s medium-term GLD ETF chart, a huge rally was seen early in the week but this was followed by a huge decline on Wednesday. Although another rally was seen on Thursday, it’s important to note that the volume level was quite low compared to previous days, so the short-term outlook is bearish even though the last move was to the upside.
Low volume levels mean that the move was likely not a true one. It means that either the bulls are running out of strength or the rally is running out of steam.
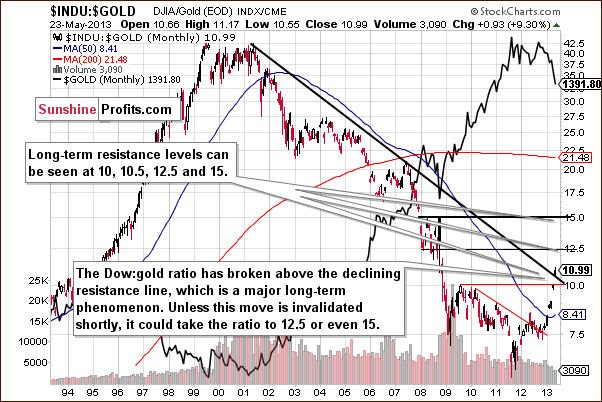
Looking at this week’s Dow to gold ratio chart, little has changed and it seems that the comments we made in last week’s Premium Update remain up-to-date:
In [this week’s] Dow to gold ratio chart, we saw an important breakout above the declining long-term resistance line. This has bearish implications for gold. The next resistance level for this ratio is at 12.5 and with it currently at 11, declines in gold will surely be needed in addition to higher stock prices in order for the ratio to move this much higher (it seems that a move higher in the general stock market will not be enough for the ratio to move that high soon). The implications are, of course, bearish.
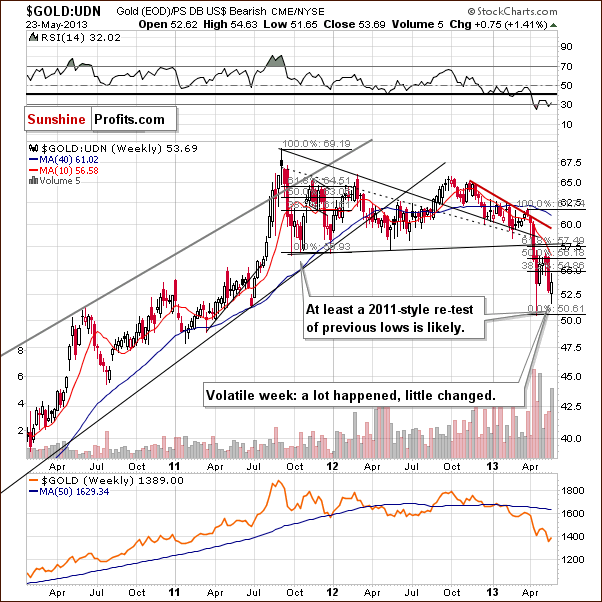
In this week’s chart of gold from the non-USD perspective, although much intra-week volatility was seen, there was really no decisive action here. Another pullback to the first Fibonacci retracement level was seen during the past week and then prices moved lower once again. The short-term trend remains down.
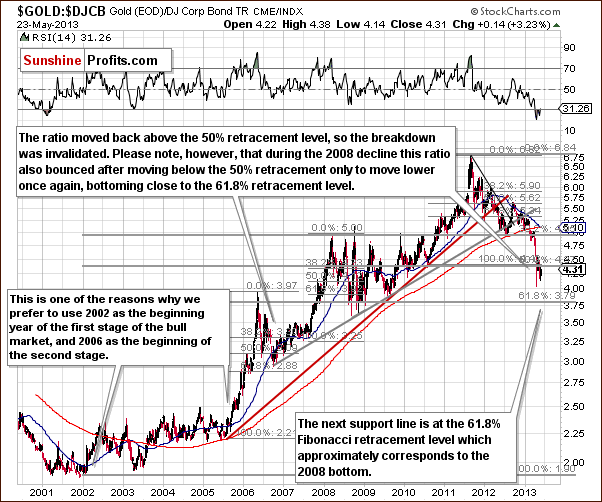
In this week’s gold to bonds ratio chart, another important ratio for gold, some strength was seen this week. Overall, however, this is not enough to change the outlook at this time and the short-term trend remains down. The next support line is the 61.8% Fibonacci retracement level, at 3.79, more than one-half a point lower than Thursday’s closing ratio level of 4.31. This is also equal to the level of the 2008 bottoms in terms of the closing prices.
Summing up, this week a pause was seen in the decline around the level of gold’s previous bottom. This is what we expected as it is very similar to what was seen way back in 1976. History does seem to rhyme here and since back then a bigger decline followed this type of move, we expect to see the same once again.
Silver
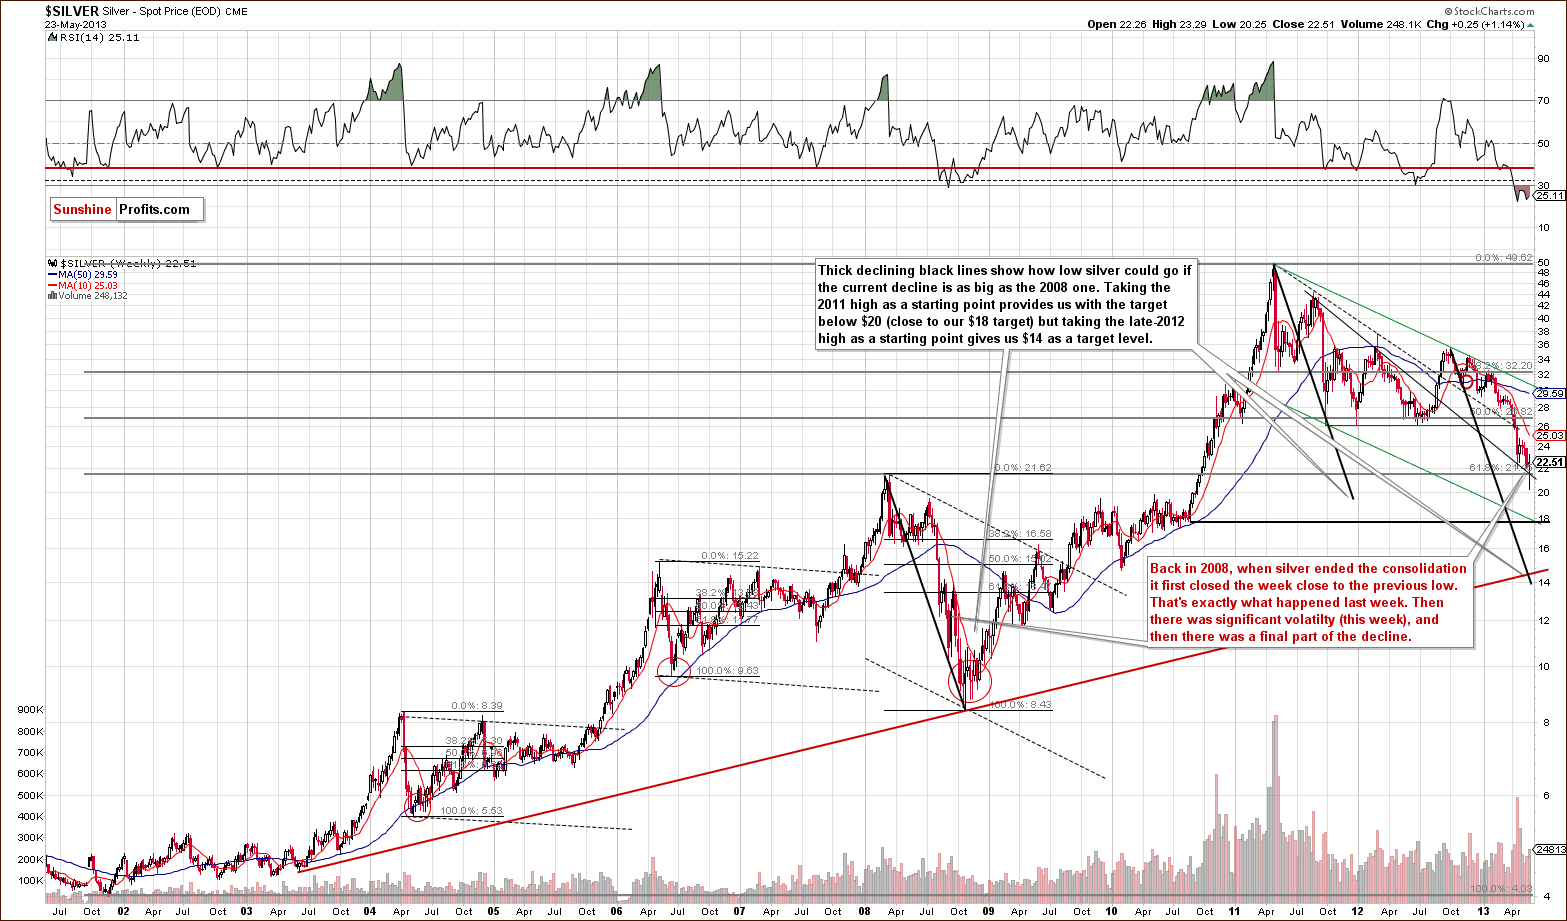
In this week’s very long-term silver chart, we saw particular intra-week volatility but prices overall are not much higher, increasing by just $0.25. The week was pretty much flat and very little changed with respect to price or outlook. Quoting from last week’s Premium Update:
In this week’s very long-term silver chart, we have further similarities with the declines of 2008. We have seen a 3 week consolidation period after the initial plunge before prices moved lower once again. Note how silver moved lower back then after initially correcting and closed the week close to the previous local low that ended the previous sharp decline. This is about where we are right now. If silver closes the week close to the April low, at it’s there at the moment of writing these words, we will have another confirmation of the similarity between now and 2008.
Based on weekly closing prices, we already have a breakdown below the early April low. The self-similarity now suggests increased volatility and a big decline ahead.
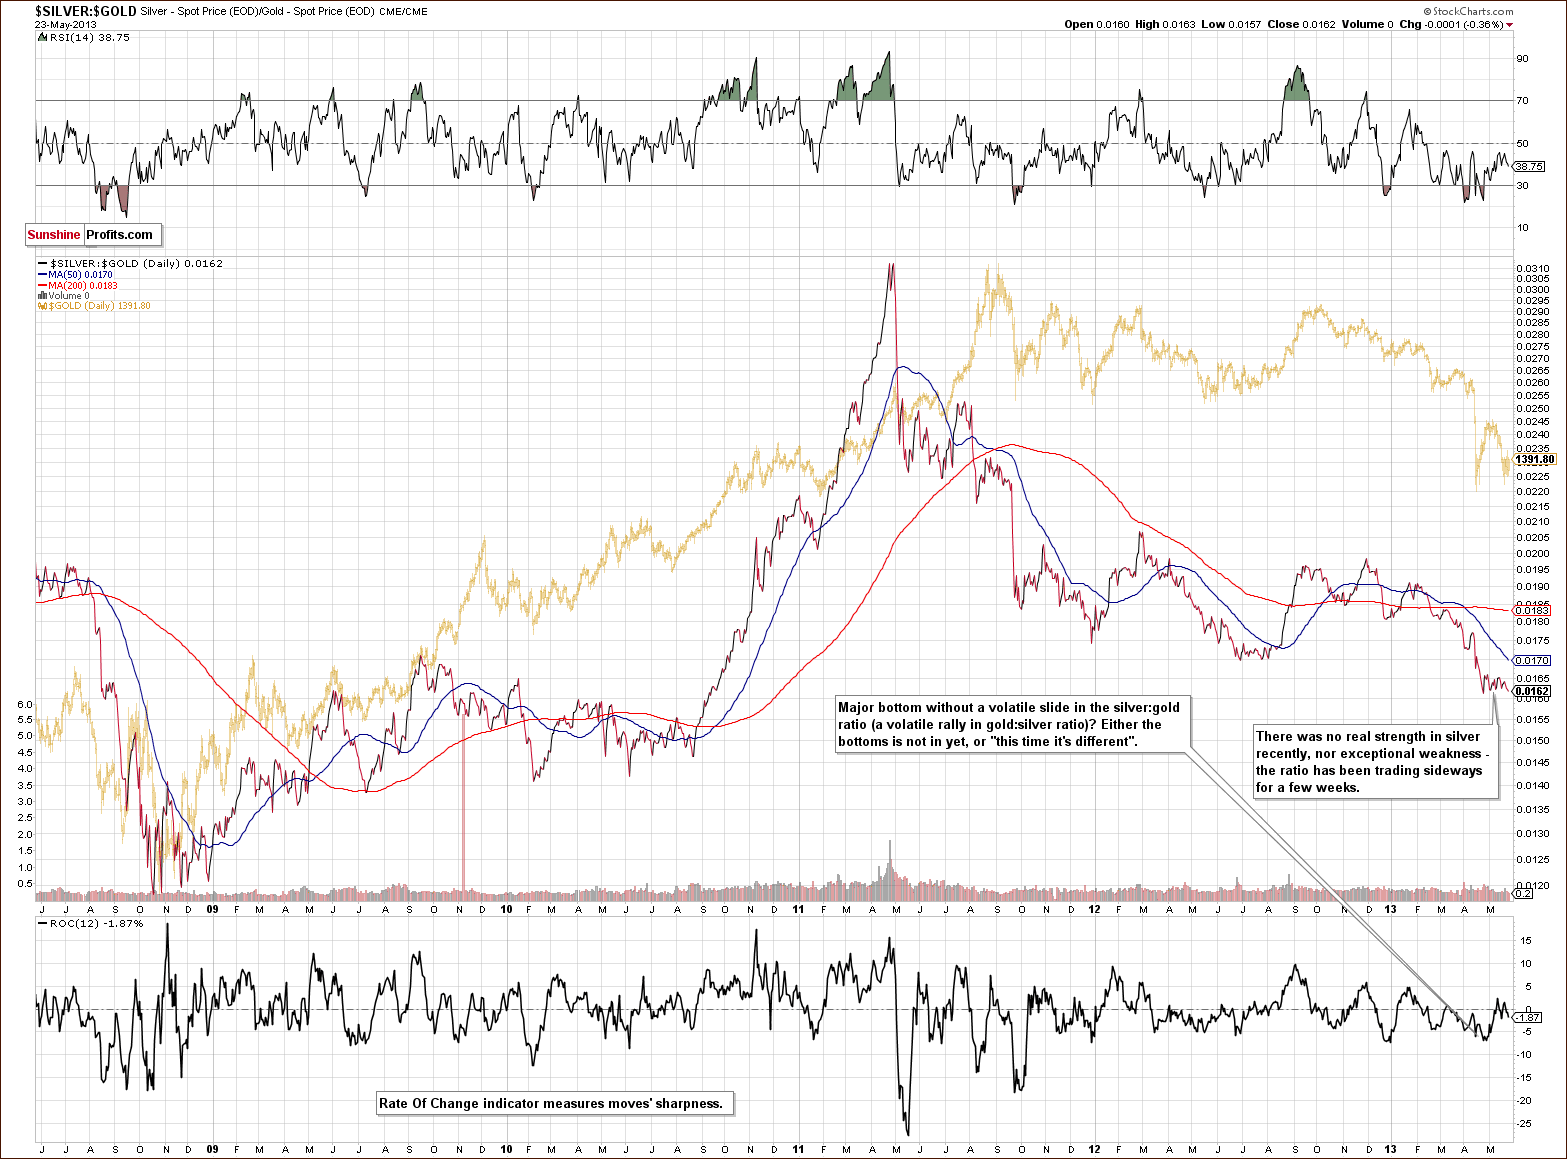
Turning now to our silver to gold ratio chart, we saw no significant underperformance of silver this week. The ratio has pretty much traded sideways for several weeks now. Although there was a bit of inter-week under- performance, it is much less visible than what we would expect based on the declines seen in 2008. The implication is that the final bottom is probably not yet in.
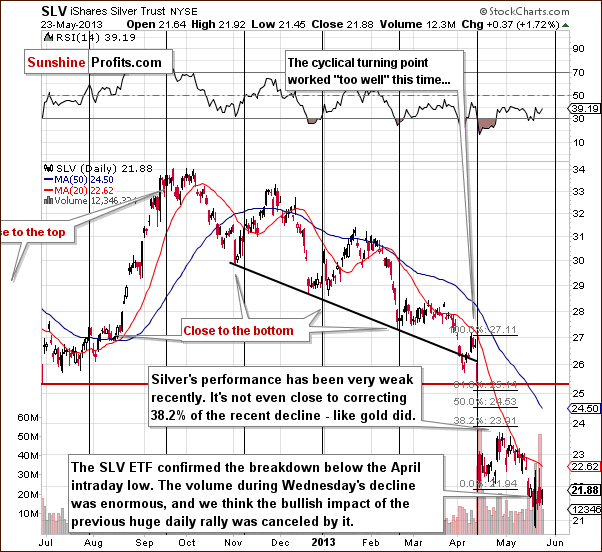
In the short-term SLV ETF chart, once again we see that prices moved higher early in the week and this move was strongly invalidated on Wednesday with volume levels nearly as high as Monday and Tuesday combined. Prices did move higher on Thursday but volume levels were pretty much average, actually a bit weak if compared to volume levels of the past week, and less than one-fourth of what they were the previous day, so the move to the upside did little to change the overall outlook here.
Summing up, the situation does not look all that bullish here. The cyclical turning point suggests a bottom in a week or so but we feel a need to see this confirmed by other markets. Placing our trust in this tool alone does not seem sufficient at this time.
Gold and Silver Mining Stocks
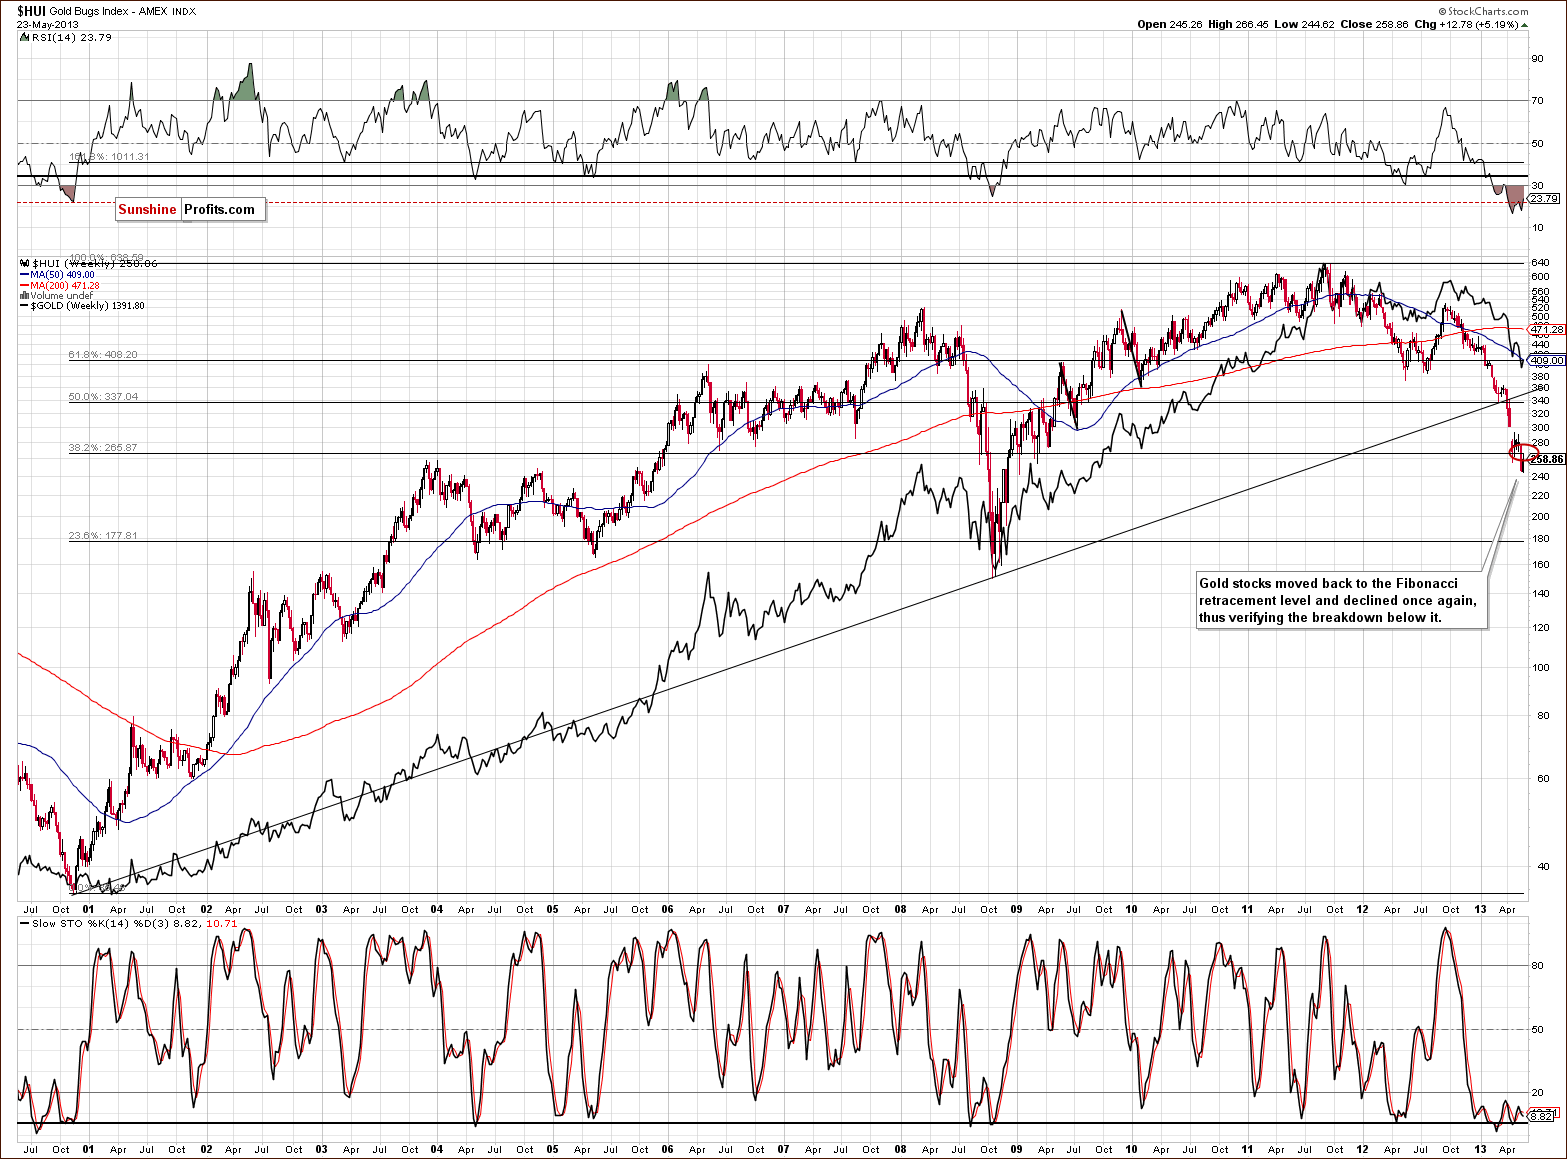
In this week’s very long-term HUI index chart, higher prices were seen this week, but from the long term perspective the increase in value of the index was very small and the downtrend continues. The reverse parabola has not been invalidated, and prices are currently slightly above the level of the early April low. The index is now clearly below the final Fibonacci retracement level after having moved to it, which is a verification of the breakdown and a bearish sign for the gold mining stocks.
Let’s examine how the breakdown below this level took place previously. In 2008, an attempt to move below this level was quickly followed by a pullback, and after the second time it was broken, there was only an intra-week pullback that was directly followed by a sharp plunge – after which the final bottom was formed. This also provides us with a bearish implication for the current situation.
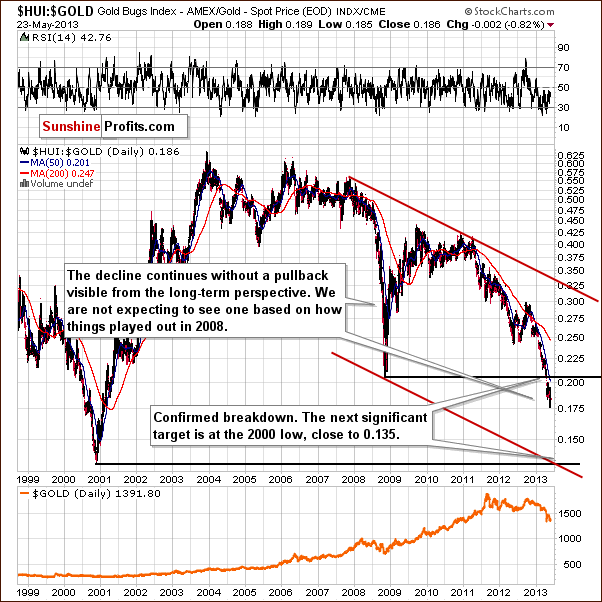
Once again we include our gold stocks to gold ratio chart. We still see a continuation of the decline here this week. The strength, which was seen early in the week, seems to really be of no importance.
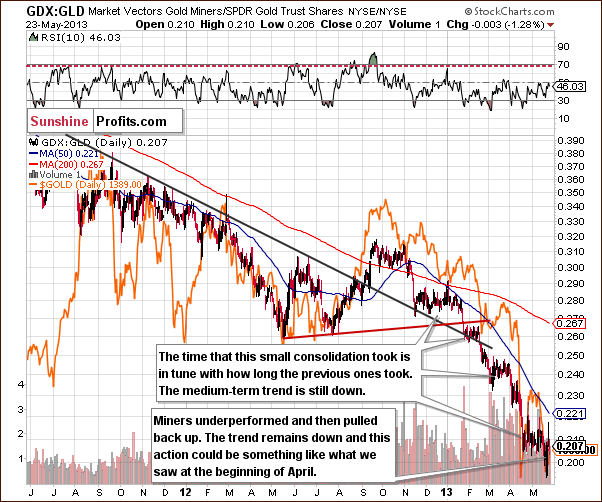
In this week’s GDX to GLD ratio chart (simply a different proxy for the relative performance of miners to gold), we see a pattern perfectly similar to the beginning of April before the plunge happened. At this time, we can’t really feel happy about this week’s developments since it is not viewed as a bullish sign right now. Although miners pulled back up after underperforming for some time, we saw very much the same thing back in early April.
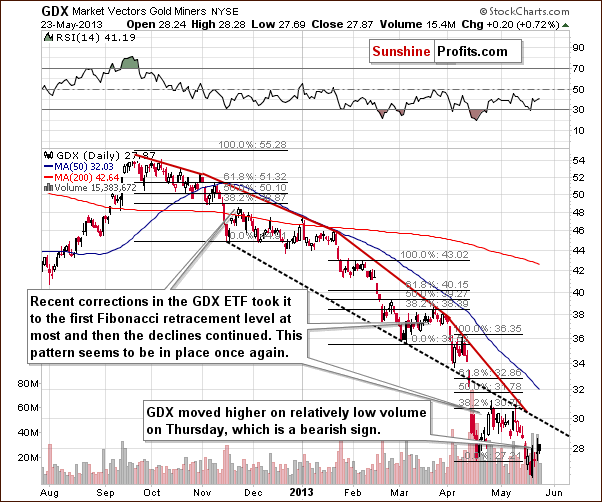
In this week’s short-term GDX ETF chart, a rally was seen on Thursday accompanied by relatively weak volume. Again, a rally that takes place on low volume is suspicious to say the least, and it is generally a bearish sign.
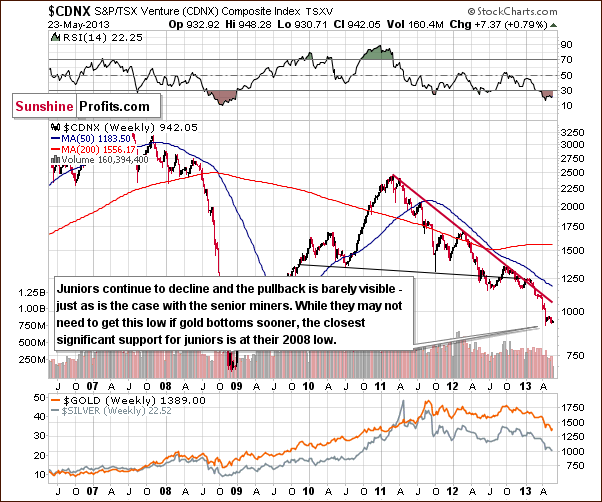
We now turn to the Toronto Stock Exchange Venture Index chart (which is a proxy for the junior miners as so many of them are included in it). No real change was seen this week – the index moved higher by less than 1% and the trend remains down.
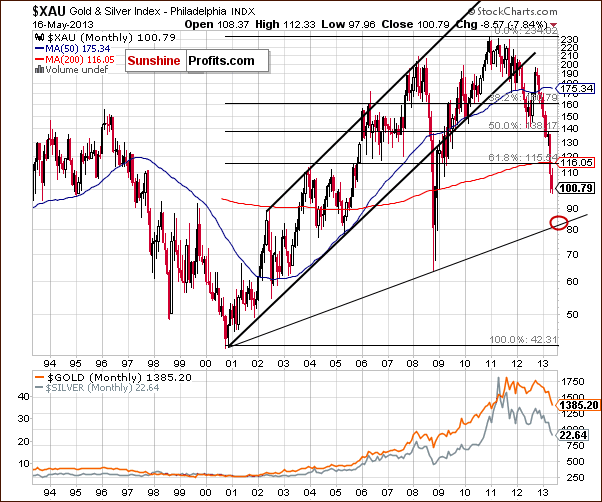
Our final chart this week is the long-term XAU index chart. This remains the best chart to use in order to determine the price target of the coming bottom. The downside target level, which we are monitoring here appears to be somewhere around the 82 level and should roughly coincide with the formation of the bottom.
Summing up, the situation in the mining stocks remains bearish for the short and medium term. None of this week’s developments had any real impact upon the outlook for the miners. When a strong trend is in place, one can expect it to remain in place until a strong support is reached – that was not the case this week.
Letters from Subscribers
Q: (…) One thing that I do is to look for price divergence with RSI and MACD and that is evident in the charts. Price has hit a lower low and RSI and MACD have hit a higher high/low. To me that indicates a possible good time to buy GDX, GDXJ and mining stocks. This is a volatile time so it would be difficult to hold through this period.
Also the $GOX:$XAU ratio shows a similar divergence. This is price capitulation and indicates a possible good time to buy mining stocks. Also $BPGDM is at zero and can't go any lower!! $GOLD has put in a double bottom. In the past you have observed that the price moves up from this type of pattern. I really cannot see any reason why price should go down further.
A: Did you mean indicators (RSI, MACD) based on the GOX:XAU ratio? If not, what kind of divergence did you have in mind?
Q: No I meant RSI and/or MACD divergence based on prices for GLD, SLV, GDX, GDXJ etc. The divergence I see is that the price has hit a low showing capitulation, but the RSI and/or MACD have hit a higher low. (…)
A: The engulfing candle was indeed bullish on an immediate-term basis, but we were expecting a pullback anyway (the one that we didn't intend to trade), so we didn't comment on it specifically. The immediate-term bullish outlook, however, was invalidated by Wednesday's turnaround.
There are divergences in numerous indicators now - such as RSI and MACD - on numerous precious metals-related indices and for individual mining companies. This, however, has been the case for some time. For instance on the GDX ETF chart you can see that the early April low was accompanied by a higher low in the RSI indicator, and preceded by a move higher in MACD. The early March bottom was also accompanied by a higher low in the RSI indicator.
The point is that divergences are good in showing that a given move may be running out of steam, but are not that good when it comes to determining whether the bottom is in or not. With a reverse parabola in gold and a long-term cyclical turning point, we are quite certain that the end of the decline is near, and that's all that the divergences confirm. They don't suggest whether or not the bottom is already in.
The Gold Miners Bullish Percent Index was indeed at the 0 level and it couldn’t go any lower (it’s a bit higher today). That's true. But miners can. This index was at 0 in 2008 when the final bottom was formed - that's true. However, that's just a one-time event. It has some predictive power, but it's not all that strong as it's not a tendency. Statistically, we would have to see about 30 cases or more to speak of an existing relationship. But putting statistics aside, we would have to see at least a few cases with the same or similar outcome to say that this could be a tendency. Consequently, while the Gold Miners Bullish Percent Index being at 0 is a contrarian bullish factor, we think that other methods of analysis are more important right now.
Why short the market? Because the trend is down and the key support levels were not reached just yet – the best example of this is the situation on the HUI Index. There are no fundamental reasons for shorting precious metals, in our view, only technical ones.
Q: Can you tell me if the ETF UUP is the equivalent of the $USD that you talk about in the weekly updates?
A: Yes, UUP is based on the USD Index that we cover on a regular basis. You can read more about this ETF on PowerShares’ website.
Summary
This week’s comments by Ben Bernanke will likely cause stocks to consolidate a bit and will have a positive impact upon the USD Index. Overall his comments are likely to have bearish implications for gold both directly and indirectly (the USD Index impact).
Technically, in our view, the current situation resembles 1976, and the analogy with 2008 is still quite visible as well. For the short term, some strength may be seen as was the case early this week but this was quickly followed by weakness on Wednesday with a pullback on weak volume Thursday. The implications of the latter are bearish.
Markets will be closed on Monday and there will be no Premium Update next week but you will remain up-to-date through our daily Market Alerts – perhaps supplemented with chart, like it was the case recently - if the situation requires them.
Trading – PR: Short silver and mining stocks.
Trading – SP Indicators: No positions: SP Indicators suggest long positions but the new self-similarity-based tool suggests short ones for the precious metals sector and we think that overall they cancel each other out.
Long-term investments: No positions.
| Portfolio's Part | Position | Stop-loss / Expiry Date |
|---|---|---|
| Trading: Mining stocks | Short (half) | 305 (HUI) / - |
| Trading: Gold | Short (half) | $1,505 / - |
| Trading: Silver | Short (half) | $25.30 / - |
| Long-term investments: Gold | No position | Buy half at $1,305 |
| Long-term investments: Silver | No position | Buy half at $18.20 |
| Long-term investments: Mining Stocks | No position | Buy half at XAU 84 |
This completes this week’s Premium Update. Our next Premium Update is scheduled for June 7, 2013.
Thank you for using the Premium Service. Have a great weekend and a profitable week!
Sincerely,
Przemyslaw Radomski, CFA

