

Briefly: in our opinion, full (300% of the regular position size) speculative short positions in mining stocks are justified from the risk/reward point of view at the moment of publishing this Alert.
Gold continues to move just like it did at the beginning of this year, and – combined with the bottoming USDX – it heralds declines in the PMs.
I previously emphasized that despite jumping above the upper (red) border of the roughly one-and-a-half-month trading channel, the bearish implications of the yellow metal’s inability to close above its November 2020 low are more important - and this has remained the case.
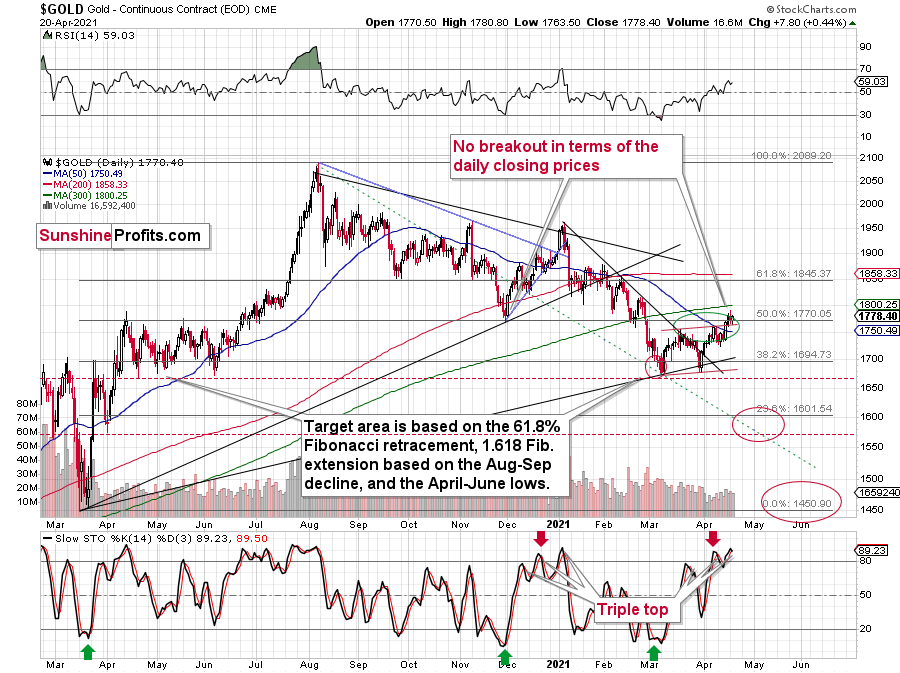
Despite a daily rally in gold, we haven’t seen a daily close above the lowest one of late November 2020. Consequently, the breakdown below this level was not invalidated and its bearish implications remain intact.
In addition, gold’s stochastic indicator is mirroring the behavior that we witnessed in early 2021. If you analyze the bottom area of the chart above, you can see that the indicator recorded three material moves higher (triple top) before gold eventually rolled over.
In particular, the first sell signal occurred slightly below the 80 level, the second was above it, and the same was the case with the third one.
The stochastic indicator has just moved to new highs, just like it did in early 2021, and it also flashed (so far tiny but still) a sell signal. Back in January, this action meant that the final top was in or about to be in (not more than a few sessions away). The implications here are definitely bearish. Especially given Monday’s session, when gold showed that it’s ready to slide even without the USD’s help.
Speaking of the USD Index, please note that it seems to have bottomed almost right at its 61.8% Fibonacci retracement level based on the previous 2021 rally.
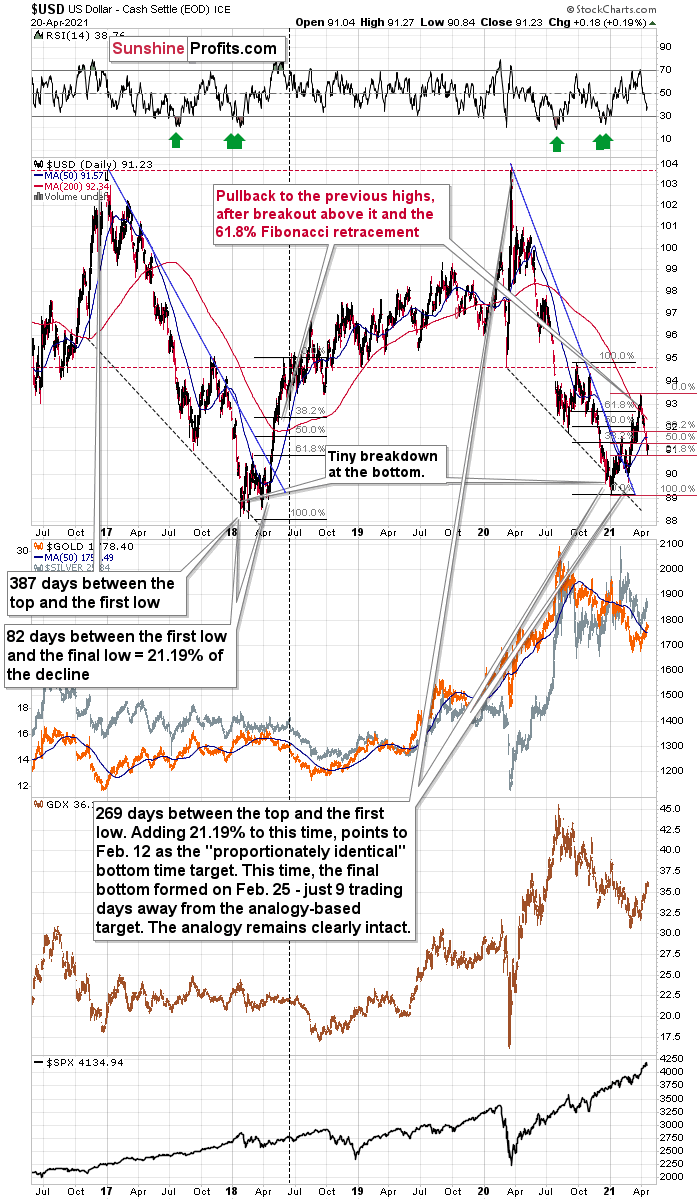
In addition, let’s keep in mind that the very bullish analogy to the 2018 rally remains intact. If you analyze the chart below, you can see that back in 2018, the USD Index rallied sharply and then corrected back to its previous highs. And in similar fashion, the current weakness is nearly identical.
The current correction is much bigger than what we saw in mid-April 2018, so it seems that what we see right now is more of an analogy to what we saw in June 2018. That was the first big correction after the breakout – above the 50-day moving average and the declining blue resistance line – that definitively ended the yearly decline.
I marked the situation from 2018 that seems similar to what we see right now with a dashed, horizontal line. Back in 2018, the pullback ended when the USD Index moved to its first Fibonacci classic retracement level (the 38.2% one). In case of the current rally, it seems that another classic retracement worked – the 61.8% one.
The very important detail about the June 2018 decline (and bottom) is that while this was the moment after which the USD Index’s started to move higher at a slower pace, it was also the moment after which the precious metals market started to decline faster.
At the beginning of the year, I wrote that the precious metals market was likely to decline and that the preceding rally was likely fake. That’s exactly what happened.
Right now, I’m writing that the recent rally was also fake (a correction within a medium-term decline) and – even more importantly – it seems likely that the next downswing could take place at a higher pace than what we saw so far this year. And – just as was the case in 2018 – this upcoming (fast) decline is likely to lead to the final bottom in the precious metals sector.
And what about mining stocks? In short, my previous comments on them remain up-to-date:
With the GDX ETF attempting to regain its former glory, the senior miners breathed a sigh of relief after breaking above their declining resistance line (the blue line below). However, mirroring the zigzag pattern that we witnessed in late 2020/early 2021, on Apr. 16, the GDX ETF hit the upper trend line of its roughly one-and-a-half-month channel. More importantly though, the development ended the GDX ETF’s rally in early 2021 and ended up being a prelude to the senior miners’ material fall from grace.
Please see below:
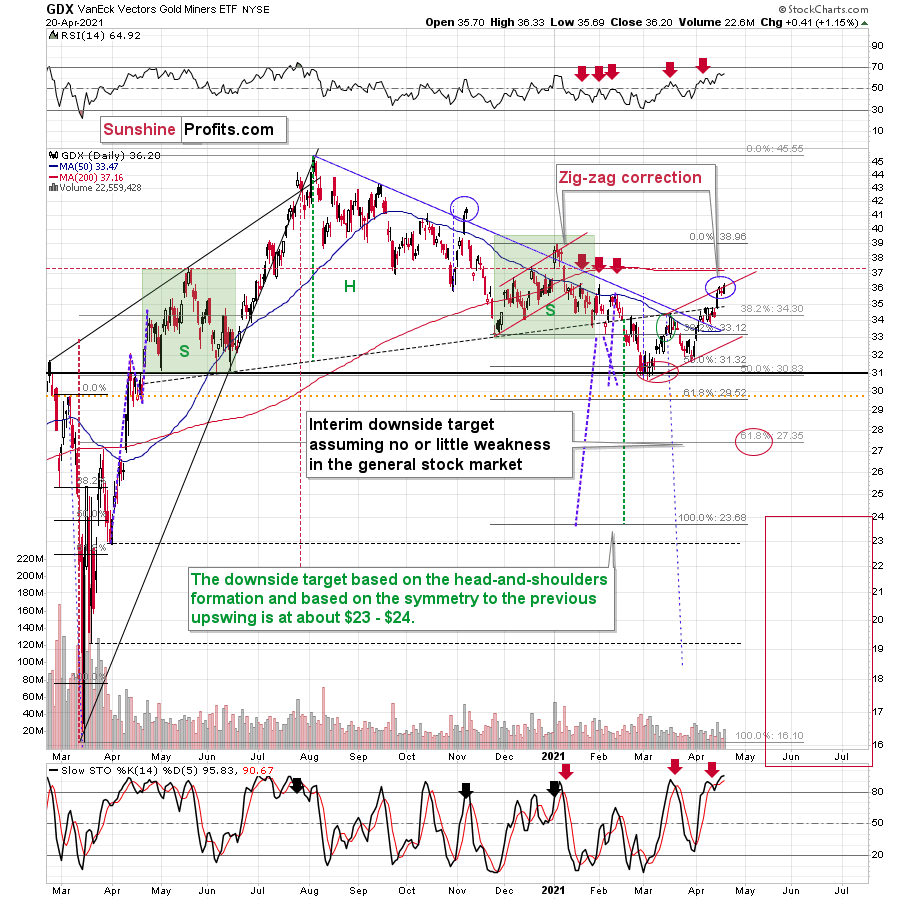
Moreover, the GDX ETF’s rally above its declining resistance line is a classic example of ‘been there, done that.’ Case in point: back in November 2020 and January 2021, the GDX ETF managed to peak its head above the aforementioned blue line. However, shortly after declaring victory, the senior miners suffered severe drawdowns. As a result, the current move is nothing to write home about.
In addition, if you analyze the vertical blue dashed line above – connecting the peak-to-trough price action in October/November 2020 – you can see that the magnitude of the correction also mirrors the current swoon. What’s more, the final two days of the November rally culminated with the GDX ETF moving sharply higher on Thursday and slightly higher on Friday. And following the same script, the GDX ETF’s sharp rally on Thursday (Apr. 15) was followed by a tepid bounce on Friday (Apr. 16). Thus, the technicalities of other markets, technicalities of mining stocks, the futures’ traders’ positions, and historical precedent are all signaling a material reversion.
Still, I would like to point out that it’s still possible that the head-and-shoulders formation that I marked previously was not THE formation that is going to take mining stocks to much lower prices. It could be the case that the left shoulder is as I described previously, but that the head of the pattern is bigger and the right shoulder is being formed right now. If this is the case, then we might still see the GDX ETF at about $37 level or so before it really slides. This would be in tune with how the situation developed in 2008 and 2012 – you’ll find details of this comparison in the following part of the analysis, where I discuss the HUI Index’s very long-term chart. For now, let’s keep in mind that even a rally slightly above $37 in the GDX ETF would not invalidate the bearish outlook for mining stocks (even though it would feel very unpleasant in the short term).
Still, it could be the case the initial head and shoulders pattern is going to hold anyway. As further evidence on this (more bearish in the short term but just as bearish in the medium term) scenario, let’s take a look at other proxies for the mining stocks. When analyzed through the lens of the GDXJ ETF, the pattern is far from invalidated. Case in point: the GDXJ ETF has yet to break above the neckline of its bearish H&S pattern.
Please see below:
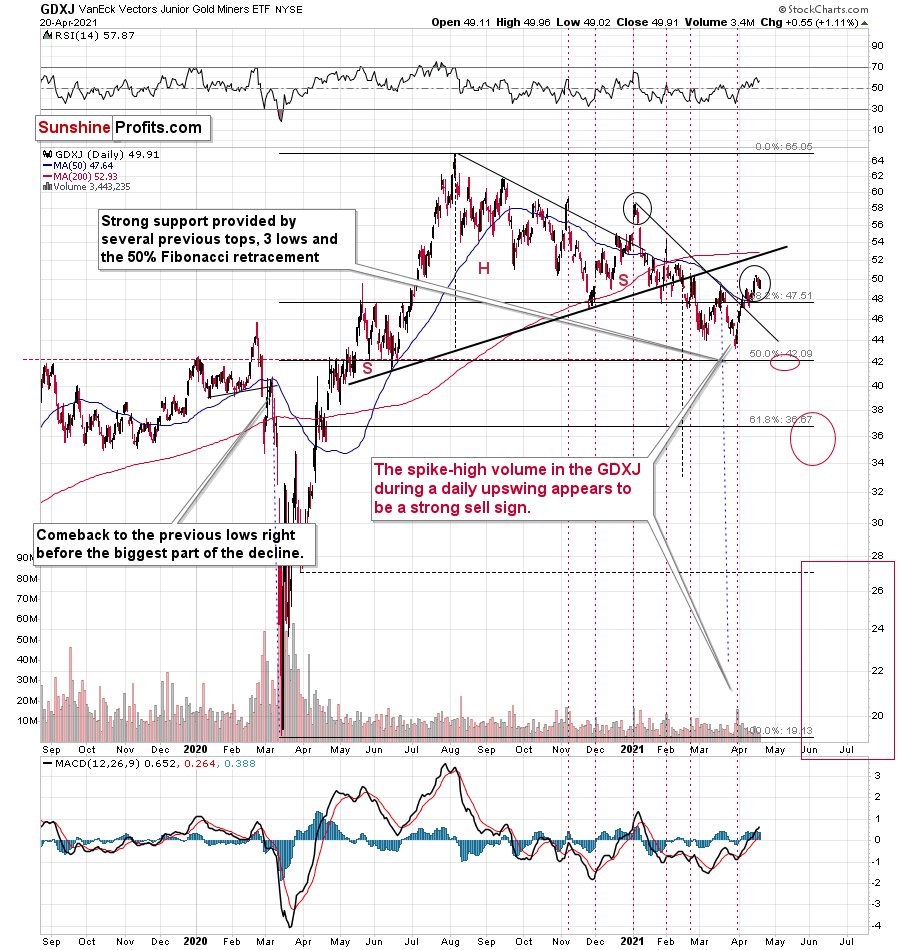
To explain, the GDXJ ETF is relatively far from the neck level (which I marked with a thick, black line). On a side note, the breakout that we saw recently (above the short-term declining resistance line) seems similar to the breakout that we saw in January – above the line that was important back then. Just as the January strength turned into declines, I expect to see the same thing this time.
The thing I would like to do today is to put emphasis on the relative weakness of the GDXJ compared to the GDX. During yesterday’s session the GDXJ moved below its March highs while the GDX didn’t, and the overall daily decline in the GDXJ was about 3x bigger. This tells me that the decision to focus on the GDXJ instead of the GDX in the current short trade was likely a correct one. Just like it was the case last year, junior miners are declining more than senior miners are, and this is likely to get even worse when the general stock market declines in a substantial way.
Yesterday, the GDXJ underperformed the GDX once again – while the GDX moved to a new monthly high, the GDXJ didn’t.
Having said that, let’s take a look at the markets from a more fundamental angle:
Holding the Line
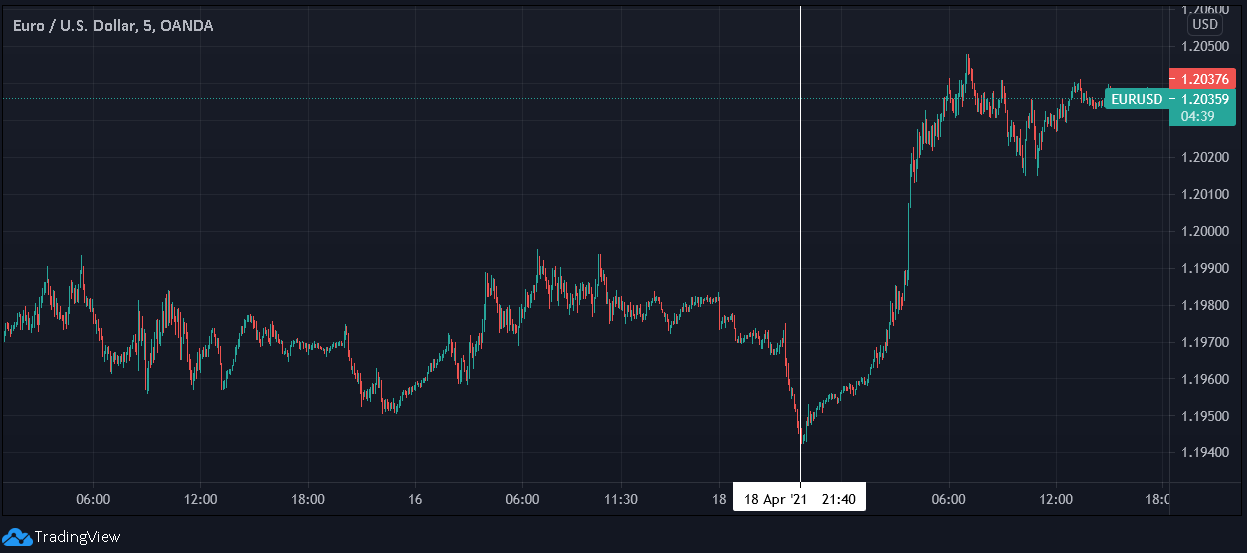
With the USD Index bouncing off of the 61.8% Fibonacci retracement level on Apr. 20, the greenback remains on the right side of history. With its medium-term breakout already confirmed and short-term corrections par for the course, the USD Index’s recent swoon is much more semblance than substance.
Case in point: the EUR/USD accounts for nearly 58% of the movement of the USD Index. And while an upgrade from Goldman Sachs hit the newswire on Apr. 19, the currency pair’s behavior on Apr. 18 signals that the whispers were heard well in advance.
Please see below:
What were the market-moving revelations that had such a profound effect, though?
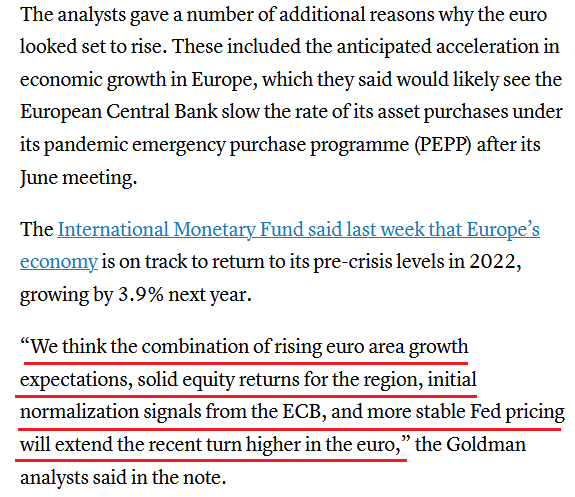
Well, if you analyze the visual below, you can see that hope has once again drowned out the reality.
 Source: CNBC
Challenging the first point, are these the “rising euro area growth expectations” that Goldman Sachs’ analysts were referencing?
 Source: Bloomberg/Daniel Lacalle
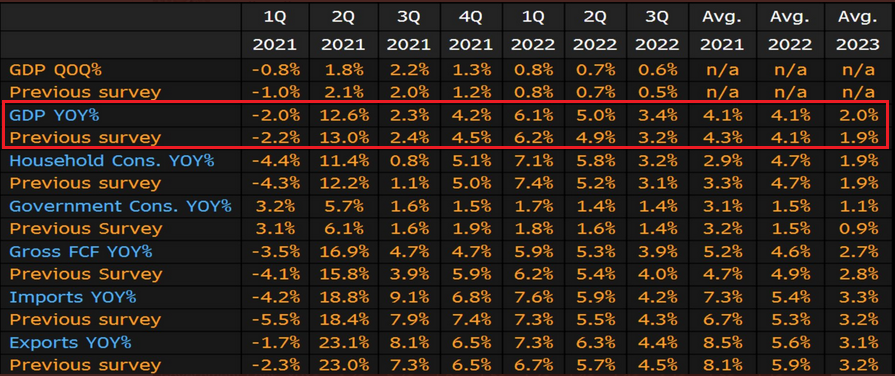
To explain, if you analyze the red box above, you can see that Eurozone consensus year-over-year (YoY) GDP growth estimates – relative to the previous Bloomberg survey – were met with four downgrades, three upgrades and the Eurozone’s full-year 2021 GDP growth forecast slashed from 4.3% to 4.1% (the column titled “Average 2021”). Moreover, the nine survey respondents also said that there is a 30% chance of a recession occurring in the Eurozone within the next 12 months.
Moving on to “solid equity returns for the region,” is that what Goldman Sachs’ analysts were referencing?
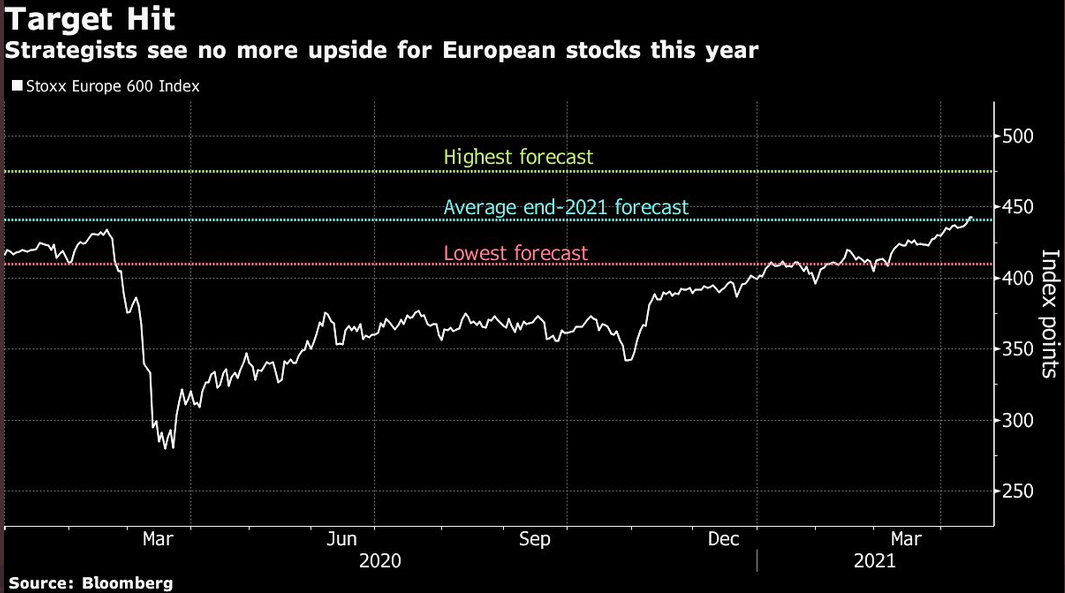
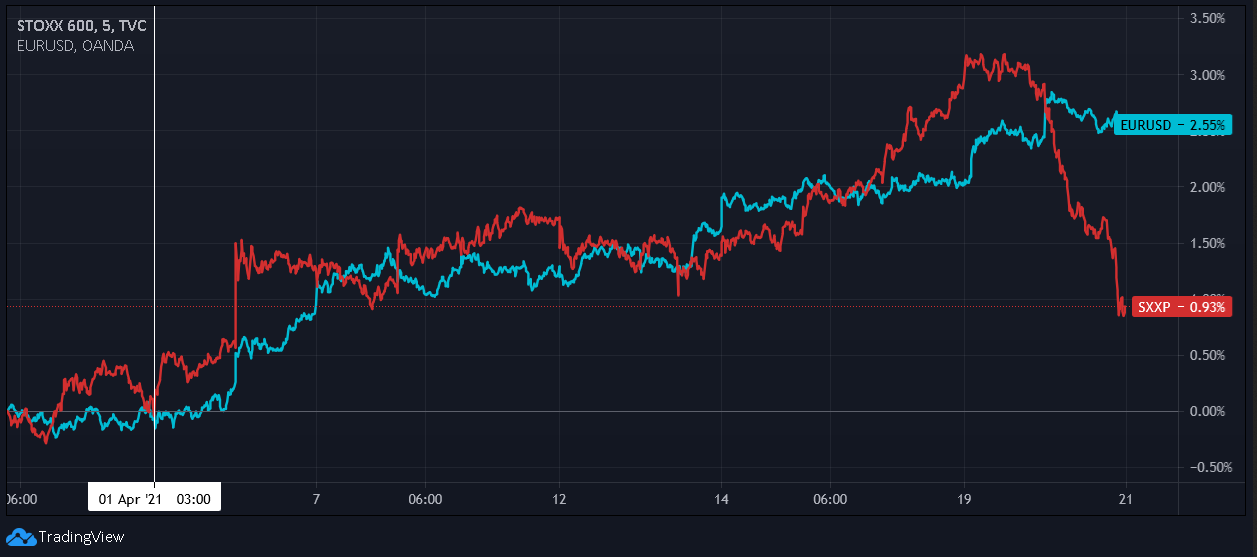
To explain, the white line above tracks the STOXX Europe 600 Index – a market-cap weighted index of the 600 largest stocks in Europe – while the horizontal pink, blue and green lines represent the consensus year-end 2021 price targets of equity strategists polled by Bloomberg. As you can see, the STOXX Europe 600 Index has already surpassed strategists’ average year-end 2021 price target (though it fell below it on Apr. 20) and only the most optimistic assessment of European equities implies further upside.
In addition, with the EUR/USD moving in lockstep with the STOXX Europe 600 Index since Apr. 1, a continuation of Tuesday’s (Apr. 20) weakness could actually tilt the scale in the opposite direction.
Please see below:
Third, with “initial normalization signals from the ECB” likely a mirage, the FED/ECB ratio – which falls when the European Central Bank (ECB) outprints the U.S. Federal Reserve (FED) – has declined by 4.25% over the last three weeks and is down by nearly 19% since May 2020.
Also, supporting our thesis, Vanda Research expects the liquidity gap to expand even further.
Please see below:
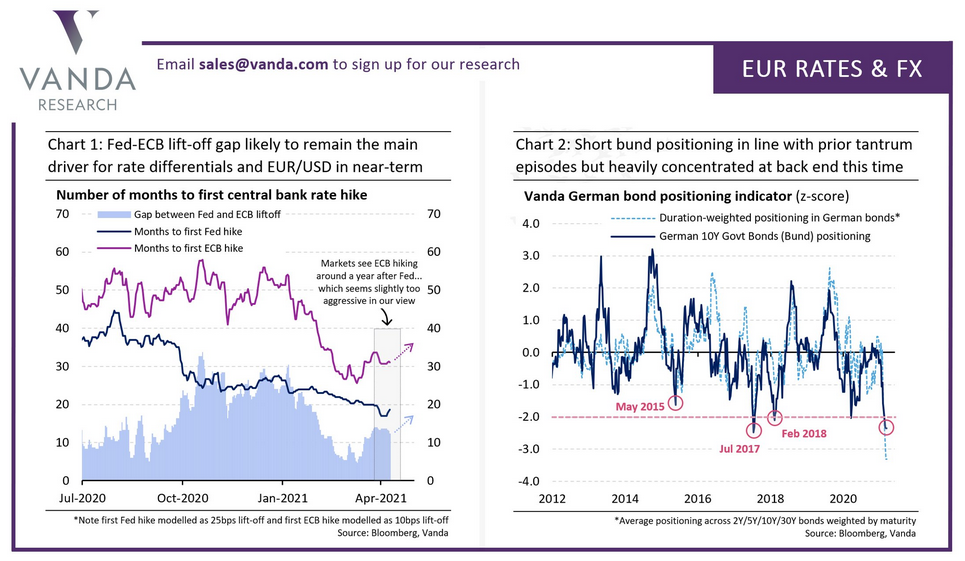
If you focus your attention on the chart on the left, the blue bars at the bottom represent the FED-ECB liftoff gap. For context, the liftoff gap represents the difference between the number of expected months until the FED raises interest rates versus the number of expected months until the ECB raises interest rates. And while market participants already expect the FED to hike interest rates 12 months before the ECB – taking into account the Eurozone economy drastically underperforming the U.S.’ – Vanda Research expects the FED-ECB liftoff gap to widen even further in the coming months. As a result, with U.S.-Eurozone interest rate differentials already drastically decoupled – when comparing the U.S. 10-Year Treasury yield to the German 10-Year Bond yield – a broadening of the gap should even put more pressure on the EUR/USD over the medium term.
Finally, with a belief that “more stable Fed pricing will extend the recent turn higher in the euro,” does the following chart look anything like “stable” pricing to you?
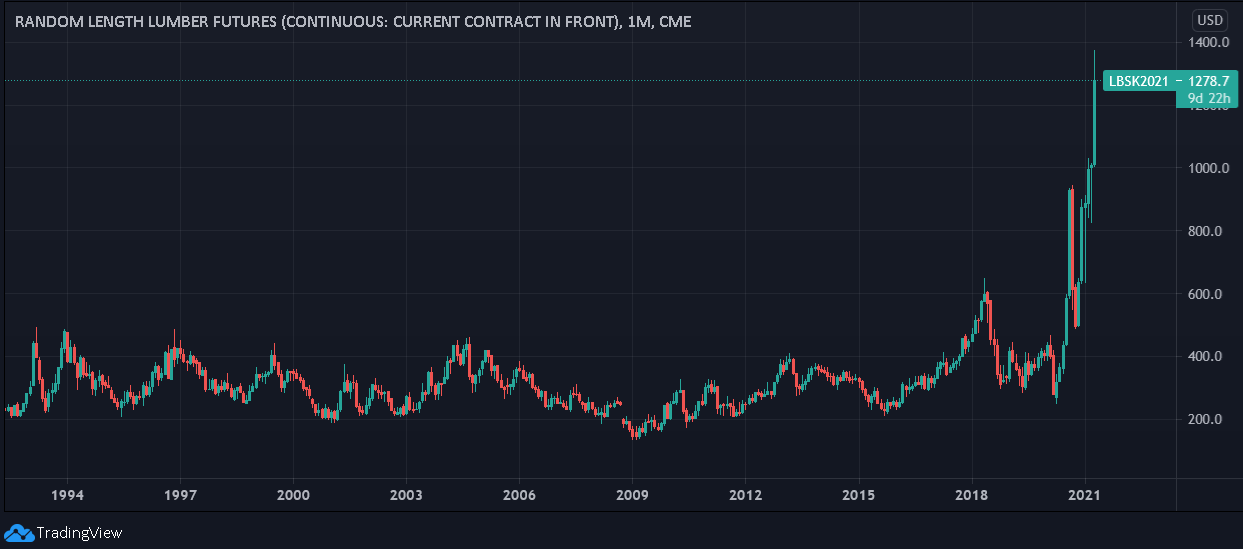
For context, the line above represents lumber futures. And while I’ve recently highlighted the surge in commodity inflation, this one absolutely takes the cake. Case in point: after rising by more than 50% in less than four months, lumber futures hit ‘limit up’ on Apr. 19 – meaning that the contract rose so rapidly that regulators were forced to suspend trading for the day.
Even more revealing, when lumber futures were more than $250 lower on Feb. 22, the National Association of Home Builders (NAHB) revealed that lumber’s surge had increased the average price of a single-family home in the U.S. by more than $24,000.
Please see below:
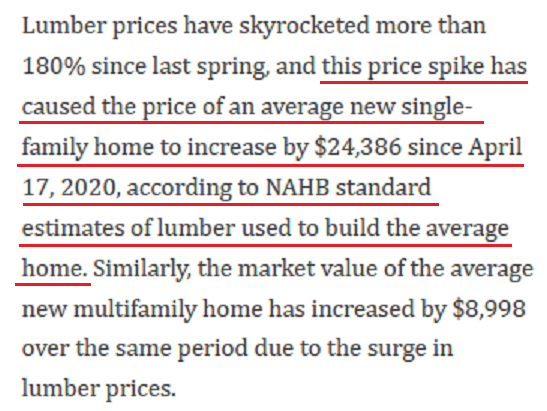 Source: NAHB
The bottom line? “Stable” pricing went out the window a long time ago.
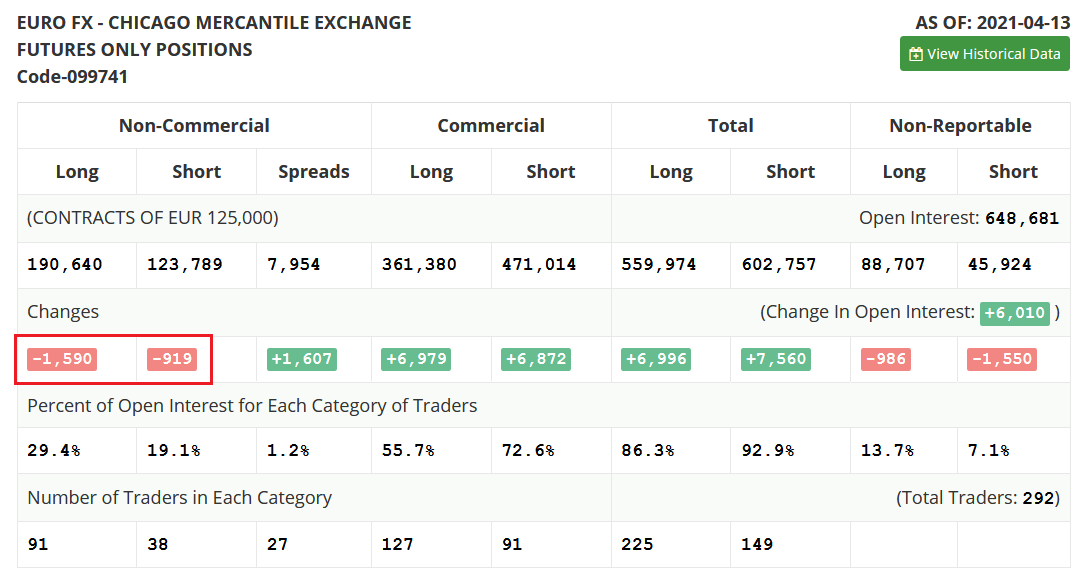
If that wasn’t enough, non-commercial (speculative) futures traders also reduced their net-long EUR/USD positions last week. Thus, for the second time in as many weeks, while the EUR/USD moved higher, speculators were net-sellers of the currency pair.
 Source: COT
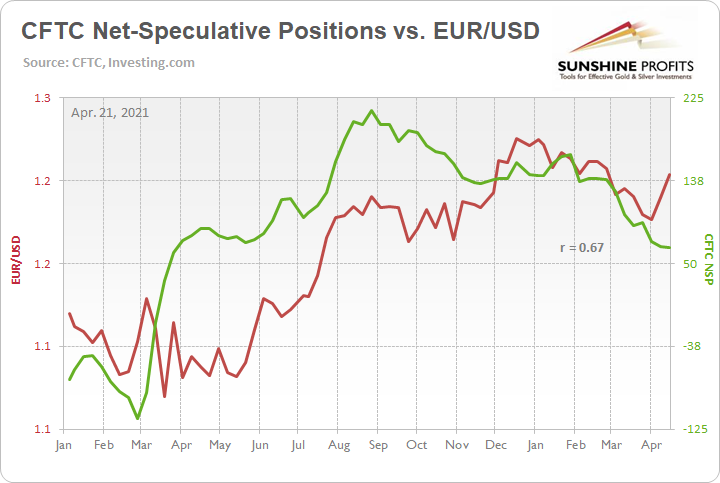
More importantly, though, the EUR/USD has a 15(+)-month correlation of 0.67 with speculative net-futures positioning. As a result, the two-week divergence is likely an aberration and not a trend.
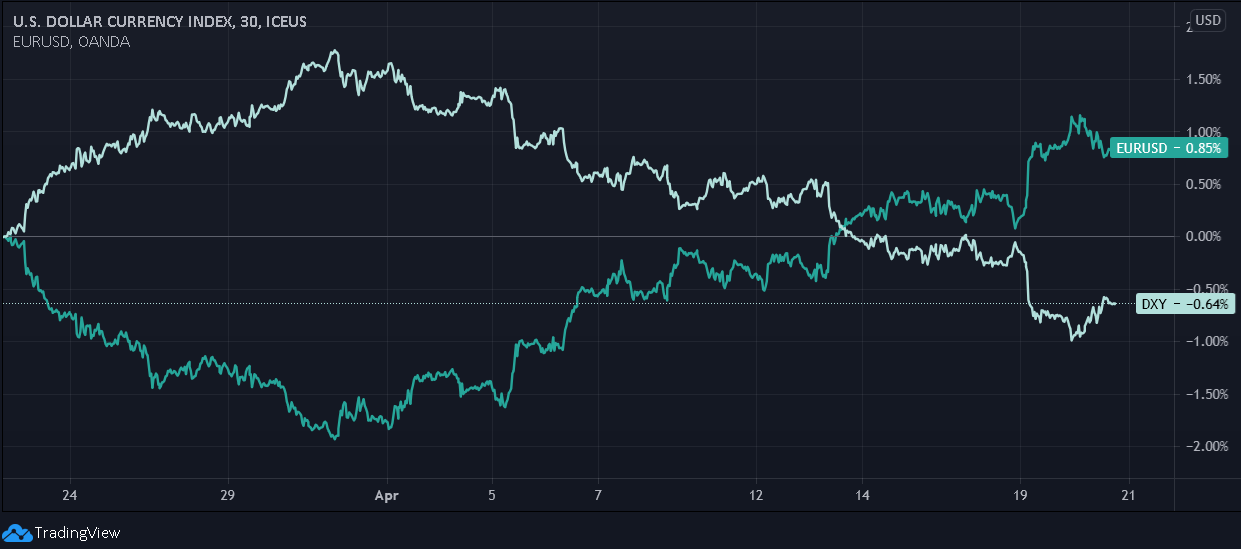
In addition, I spend so much time discussing the EUR/USD because dethroning the currency pair is necessary for the USD Index to reclaim its rightful spot atop the currency monarchy. And while I explained above that the EUR/USD accounts for nearly 58% of the movement of the USD Index, if you analyze the chart below, it visualizes the recent impact that the former has had on the latter.
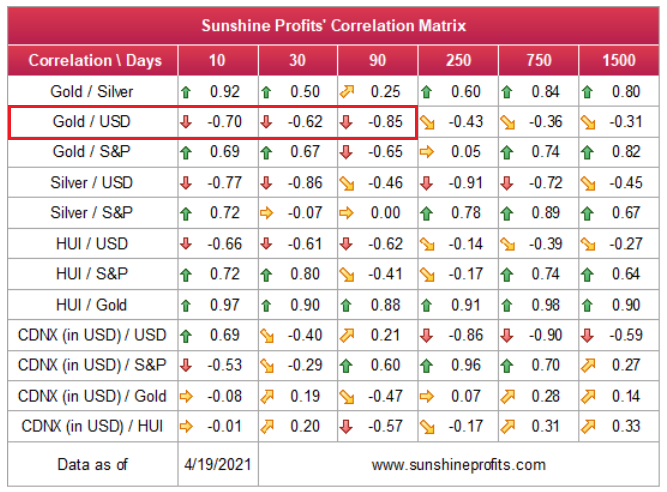
Also noteworthy, while gold has been all over the place in recent days – rising and falling with the USD Index – it’s important to remember that the two have a strong negative correlation. Thus, with the yellow metal largely overbought and the USD Index materially oversold, a reversal of fortunes should occur in the near future.
In conclusion, while the PMs ignored the USD Index’s bounce on Apr. 20, it was simply a demonstration of superficial strength. With the PMs’ smelling blood in the water, their dismissal of the latter’s reversal was a sign of overconfidence. However, with the greenback akin to a bear in hibernation, a springtime mauling could leave the PMs severely wounded. As a result, despite the short-term about-face, the metals’ medium-term outlook remains profoundly bearish.
Overview of the Upcoming Part of the Decline
- It seems likely to me that the corrective upswing was already completed or that it will be completed this week. Consequently, it seems that the next big move lower is already underway or about to start.
- After miners slide once again in a meaningful and volatile way, but silver doesn’t (and it just declines moderately), I plan to switch from short positions in miners to short positions in silver (this could take another 1-2 weeks to materialize). I plan to exit those short positions when gold shows substantial strength relative to the USD Index, while the latter is still rallying. This might take place with gold close to $1,450 - $1,500 and the entire decline (from above $1,700 to about $1,475) would be likely to take place within 1-12 weeks, and I would expect silver to fall hardest in the final part of the move. This moment (when gold performs very strongly against the rallying USD and miners are strong relative to gold – after gold has already declined substantially) is likely to be the best entry point for long-term investments, in my view. This might happen with gold close to $1,475, but it’s too early to say with certainty at this time. In other words, the entire decline could take between 1 and 12 weeks, with silver declines occurring particularly fast in the final 1-2 weeks.
- If gold declines even below $1,500 (say, to ~$1350 or so), then it could take another 10 weeks or so for it to bottom, but this is not what I view as a very likely outcome.
- As a confirmation for the above, I will use the (upcoming or perhaps we have already seen it?) top in the general stock market as the starting point for the three-month countdown. The reason is that after the 1929 top, gold miners declined for about three months after the general stock market started to slide. We also saw some confirmations of this theory based on the analogy to 2008. All in all, the precious metals sector would be likely to bottom about three months after the general stock market tops. If the mid-February 2020 top was the final medium-term top (based on NASDAQ’s top, then it seems that we might expect the precious metals sector to bottom in mid-May or close to May’s end. If, however, the upcoming (unless we just saw one) top in the S&P 500 is the key one, then it seems that we’re at least ~3 months from the final bottom.
- The above is based on the information available today, and it might change in the following days/weeks.
Please note that the above timing details are relatively broad and “for general overview only” – so that you know more or less what I think and how volatile I think the moves are likely to be – on an approximate basis. These time targets are not binding or clear enough for me to think that they should be used for purchasing options, warrants or similar instruments.
Summary
To summarize, the PMs’ medium-term decline is well underway, and based on the recent performance of the USD Index, gold and mining stocks, it seems that the corrective upswing is close to being over. Based on gold’s triangle-vertex-based reversal, it seems that we saw the initial top on Thursday (Apr. 8), and it seems that – based on gold’s extremely weak performance compared to the USD Index yesterday – the final top is also in. If not, it’s likely to be in shortly anyway.
In addition, because we’re likely entering the “winter” part of the Kondratiev cycle (just like in 1929 and then the 1930s), the outlook for the precious metals’ sector remains particularly bearish during the very first part of the cycle, when cash is king.
The confirmed breakout in the USD Index is yet another confirmation of the bearish outlook for the precious metals market.
After the sell-off (that takes gold to about $1,450 - $1,500), we expect the precious metals to rally significantly. The final part of the decline might take as little as 1-5 weeks, so it's important to stay alert to any changes.
Most importantly, please stay healthy and safe. We made a lot of money last March and it seems that we’re about to make much more on this March decline, but you have to be healthy to enjoy the results.
As always, we'll keep you - our subscribers - informed.
By the way, we’re currently providing you with a possibility to extend your subscription by a year, two years or even three years with a special 20% discount. This discount can be applied right away, without the need to wait for your next renewal – if you choose to secure your premium access and complete the payment upfront. The boring time in the PMs is definitely over and the time to pay close attention to the market is here. Naturally, it’s your capital, and the choice is up to you, but it seems that it might be a good idea to secure more premium access now, while saving 20% at the same time. Our support team will be happy to assist you in the above-described upgrade at preferential terms – if you’d like to proceed, please contact us.
To summarize:
Trading capital (supplementary part of the portfolio; our opinion): Full speculative short positions (300% of the full position) in mining stocks are justified from the risk to reward point of view with the following binding exit profit-take price levels:
Mining stocks (price levels for the GDXJ ETF): binding profit-take exit price: $24.12; stop-loss: none (the volatility is too big to justify a stop-loss order in case of this particular trade)
Alternatively, if one seeks leverage, we’re providing the binding profit-take levels for the JDST (2x leveraged) and GDXD (3x leveraged – which is not suggested for most traders/investors due to the significant leverage). The binding profit-take level for the JDST: $39.87; stop-loss for the JDST: none (the volatility is too big to justify a SL order in case of this particular trade); binding profit-take level for the GDXD: $94.87; stop-loss for the GDXD: none (the volatility is too big to justify a SL order in case of this particular trade).
For-your-information targets (our opinion; we continue to think that mining stocks are the preferred way of taking advantage of the upcoming price move, but if for whatever reason one wants / has to use silver or gold for this trade, we are providing the details anyway.):
Silver futures upside profit-take exit price: unclear at this time - initially, it might be a good idea to exit when gold moves to $1,512.
Gold futures upside profit-take exit price: $1,512.
Long-term capital (core part of the portfolio; our opinion): No positions (in other words: cash
Insurance capital (core part of the portfolio; our opinion): Full position
Whether you already subscribed or not, we encourage you to find out how to make the most of our alerts and read our replies to the most common alert-and-gold-trading-related-questions.
Please note that we describe the situation for the day that the alert is posted in the trading section. In other words, if we are writing about a speculative position, it means that it is up-to-date on the day it was posted. We are also featuring the initial target prices to decide whether keeping a position on a given day is in tune with your approach (some moves are too small for medium-term traders, and some might appear too big for day-traders).
Additionally, you might want to read why our stop-loss orders are usually relatively far from the current price.
Please note that a full position doesn't mean using all of the capital for a given trade. You will find details on our thoughts on gold portfolio structuring in the Key Insights section on our website.
As a reminder - "initial target price" means exactly that - an "initial" one. It's not a price level at which we suggest closing positions. If this becomes the case (like it did in the previous trade), we will refer to these levels as levels of exit orders (exactly as we've done previously). Stop-loss levels, however, are naturally not "initial", but something that, in our opinion, might be entered as an order.
Since it is impossible to synchronize target prices and stop-loss levels for all the ETFs and ETNs with the main markets that we provide these levels for (gold, silver and mining stocks - the GDX ETF), the stop-loss levels and target prices for other ETNs and ETF (among other: UGL, GLL, AGQ, ZSL, NUGT, DUST, JNUG, JDST) are provided as supplementary, and not as "final". This means that if a stop-loss or a target level is reached for any of the "additional instruments" (GLL for instance), but not for the "main instrument" (gold in this case), we will view positions in both gold and GLL as still open and the stop-loss for GLL would have to be moved lower. On the other hand, if gold moves to a stop-loss level but GLL doesn't, then we will view both positions (in gold and GLL) as closed. In other words, since it's not possible to be 100% certain that each related instrument moves to a given level when the underlying instrument does, we can't provide levels that would be binding. The levels that we do provide are our best estimate of the levels that will correspond to the levels in the underlying assets, but it will be the underlying assets that one will need to focus on regarding the signs pointing to closing a given position or keeping it open. We might adjust the levels in the "additional instruments" without adjusting the levels in the "main instruments", which will simply mean that we have improved our estimation of these levels, not that we changed our outlook on the markets. We are already working on a tool that would update these levels daily for the most popular ETFs, ETNs and individual mining stocks.
Our preferred ways to invest in and to trade gold along with the reasoning can be found in the how to buy gold section. Furthermore, our preferred ETFs and ETNs can be found in our Gold & Silver ETF Ranking.
As a reminder, Gold & Silver Trading Alerts are posted before or on each trading day (we usually post them before the opening bell, but we don't promise doing that each day). If there's anything urgent, we will send you an additional small alert before posting the main one.
Thank you.
Przemyslaw Radomski, CFA
Founder, Editor-in-chief

