

Briefly: in our opinion, full (300% of the regular position size) speculative short positions in junior mining stocks are justified from the risk/reward point of view at the moment of publishing this Alert.
As the midterm-related uncertainty peaked, so did the precious metals prices – or at least that’s what appears based on charts and… common sense.
Let’s start today’s analysis with an overview of the fundamentals.
Warning Signs
While gold, silver, mining stocks and the S&P 500 continued to advance on misguided midterm optimism, cryptocurrencies crashed on Nov. 8, as a “liquidity crunch” at the FTX exchange sparked a tsunami of selling.
Moreover, this is what happens when the Fed tightens monetary policy: cash becomes scarce, risk appetite sputters, and suddenly, one of the largest crypto exchanges in the world can’t meet its clients’ withdrawal requests. As a result, while bullish seasonality has investors assuming that all is well on Wall Street, the fundamentals are still profoundly bearish.
Please see below:
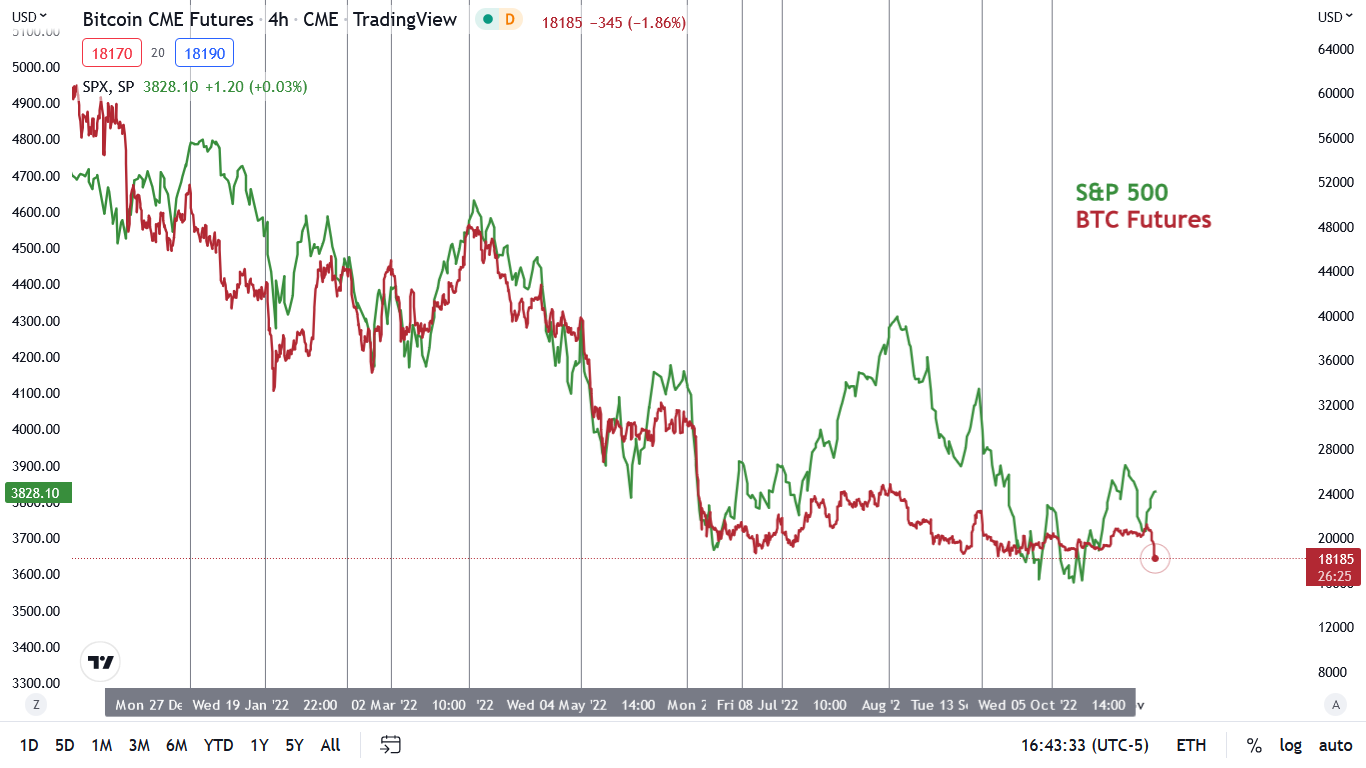
To explain, the red line above tracks the four-hour movement of Bitcoin futures since late 2021, while the green line above tracks the four-hour movement of the S&P 500. If you analyze the vertical gray lines, you can see that when Bitcoin rolls over, the S&P 500 has either fallen in lockstep or declined soon after.
Conversely, if you analyze the right side of the chart, you can see that the green line has moved higher even as the red line falters; and while the stock bulls assume that the liquidity issues are isolated to crypto, the latter’s problems are a symptom of the fundamental medicine that’s required to cure inflation. As such, it’s likely only a matter of time before the fear cascades toward traditional assets.
To that point, the GDXJ ETF has largely followed Bitcoin’s path since late 2021.
Please see below:
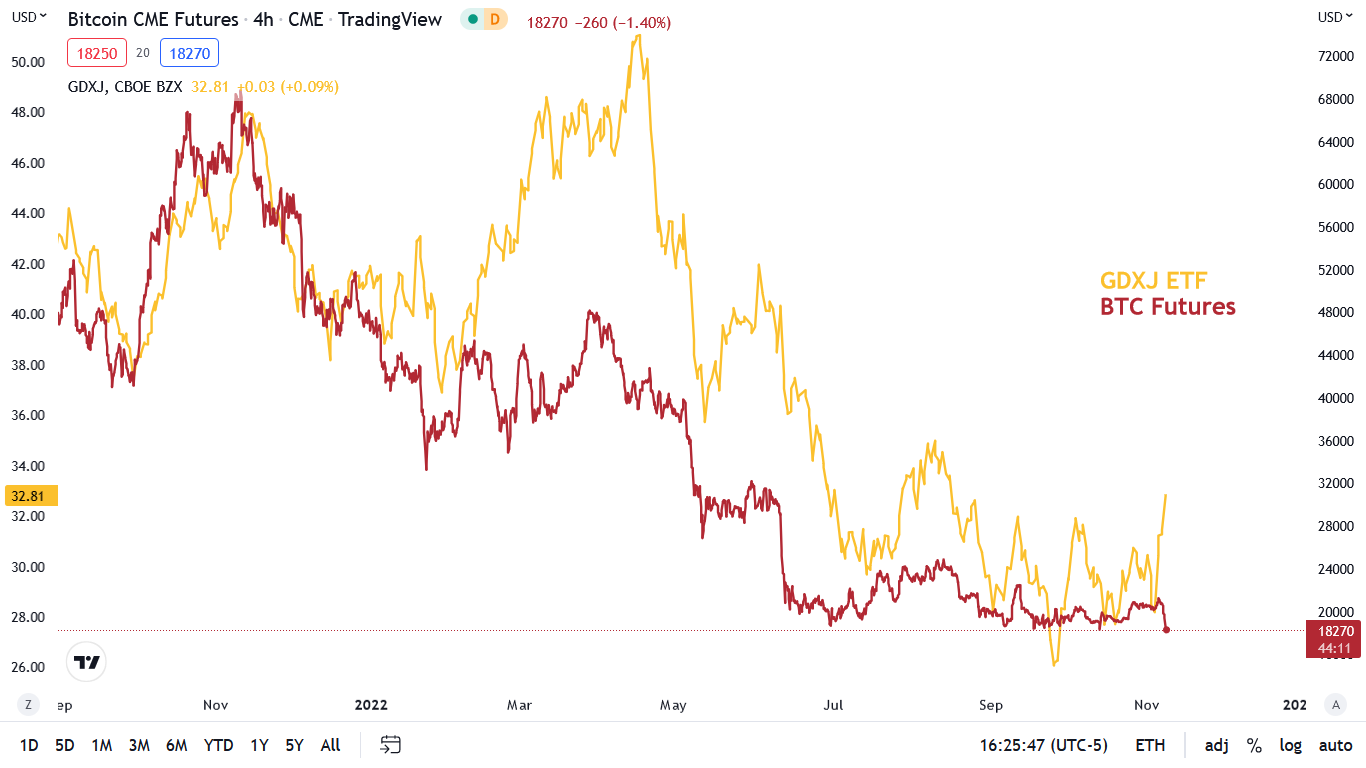
To explain, the red line above tracks the four-hour movement of Bitcoin futures, while the gold line above tracks the four-hour movement of the GDXJ ETF. Outside of the material outperformance in early-to-mid-2022 – which occurred during the Russian invasion of Ukraine – Bitcoin's weakness has mostly coincided with drawdowns of the junior miners' index.
Please note that the times when Bitcoin declined, but the GDXJ rallied were also the times when the latter topped shortly thereafter, and then started its powerful declines. In particular, that’s how the 2022 top was formed.
Therefore, while the GDXJ ETF and the S&P 500 turn a blind eye, Bitcoin’s collapse to new intraday 2022 lows on Nov. 8 is an ominous warning sign of what likely lies ahead.
CPI Time
While Fed Chairman Jerome Powell warned investors on Nov. 2 that the U.S. federal funds rate (FFR) will need to rise more than previously expected, the crowd has largely ignored the hawkish alert. Thus, while the Consumer Price Index (CPI) usually garners a lot of attention, investors may prioritize the midterms over the fundamentals.
However, with their bullish dispositions making the Fed’s job even more difficult, investors don’t realize that their midterm enthusiasm will only spur more inflation.
Please see below:
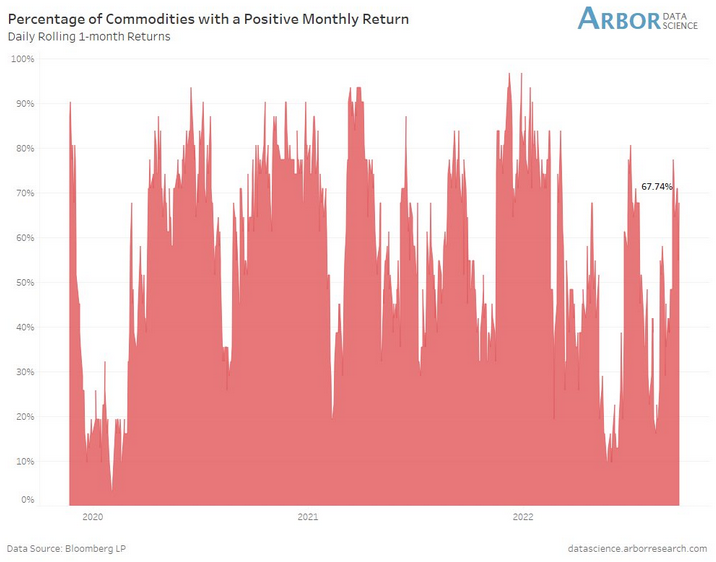
To explain, the red bars above track the percentage of commodities with a positive one-month return. If you analyze the right side of the chart, you can see that nearly 68% of commodities are up month-over-month (MoM). As a result, this leads MoM input inflation, which then leads MoM output inflation. So, when investors position for a dovish pivot, they materially reduce the odds of one occurring.
To that point, the Institute for Supply Management (ISM) released its U.S. Services PMI on Nov. 3. The headline index declined from 56.7 in September to 54.4 in October. However, the report stated:
“Prices paid by services organizations for materials and services increased in October for the 65th consecutive month, with the index registering 70.7 percent, 2 percentage points higher than the 68.7 percent recorded in September.”
Furthermore, the ISM’s Prices Index rose in October following “five straight months of decreases.” Therefore, investors significantly underestimate how difficult it will be for the Fed to reach its 2% inflation goal.
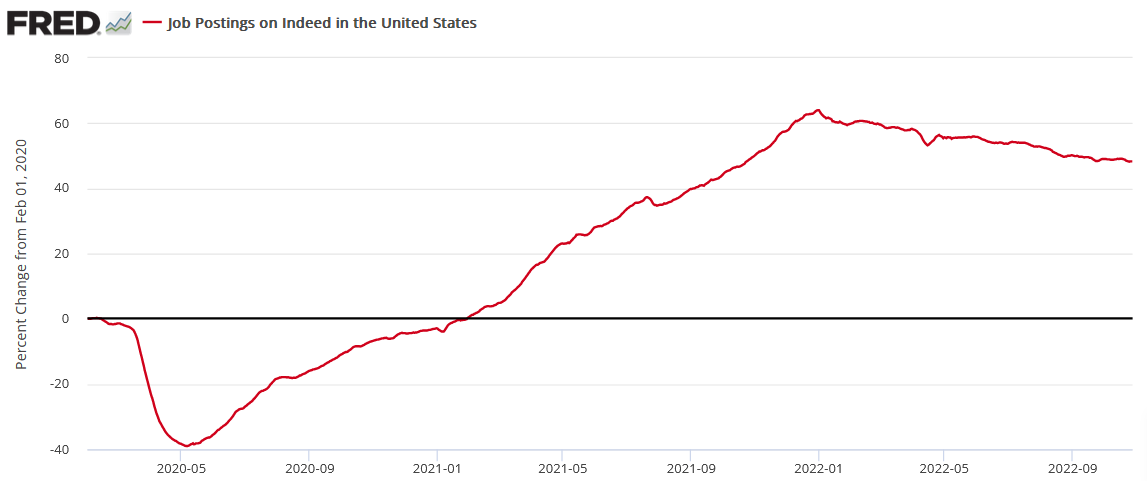
In addition, with employment one-half of the Fed’s dual mandate, the U.S. labor market signals more hawkish policy, not less. For example, Indeed updated its U.S. job postings on Nov. 8; and with employment opportunities still 48.3% above their pre-pandemic baseline (as of the week ending Oct. 28), the modest deceleration highlights why wage inflation should remain problematic for the foreseeable future.
Please see below:
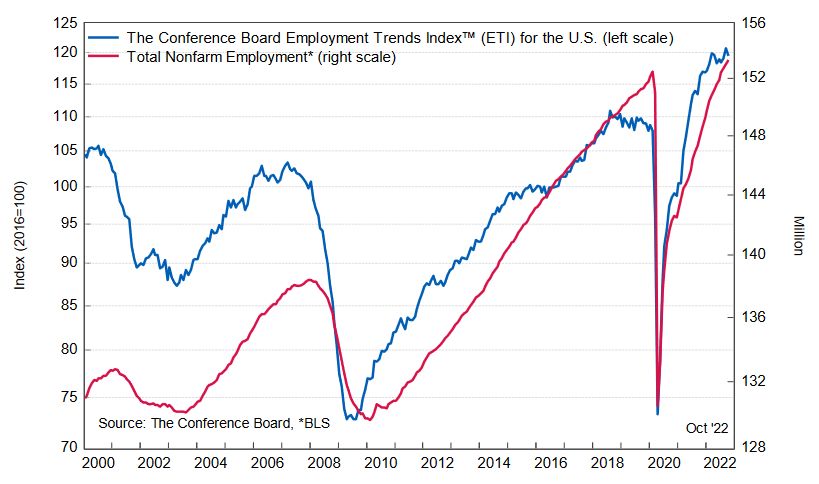
As further evidence, The Conference Board released its Employment Trends Index (ETI) on Nov. 7. It fell to 119.57 in October from an upwardly-revised reading of 120.73 in September. Frank Steemers, Senior Economist at The Conference Board, said:
“The ETI decreased in October 2022 and has been flat since early 2022, but it remains at a high level and a clear turning point in the Index is not yet visible. Job growth will likely continue over the next months, albeit at a slowing pace. The labor market remains resilient with job gains still strong, but the Fed’s rapid monetary policy tightening is expected to have a more visibly negative impact on the pace of hiring by early 2023.”
However:
“Until that happens, employers will have to deal with continued labor shortages. While there are signs these shortages have begun easing somewhat, hiring and retention difficulties are not over. A tight U.S. labor market, understaffing, limited recovery in labor force participation, and an aging workforce all suggest U.S. labor supply will remain a challenge for companies. As a result, employers may be more careful in laying off workers.”
So, while the crowd assumes (like they did in 2021) that inflation will recede gracefully, the reality is that it won’t die without a substantial slowdown in the U.S. labor market. Thus, the incoming data is bullish for the FFR, real yields and the USD Index.
Please see below:
Furthermore, investors’ willingness to overlook the bearish fundamentals mirrors their behavior from the springtime. To explain, I wrote on May 9:
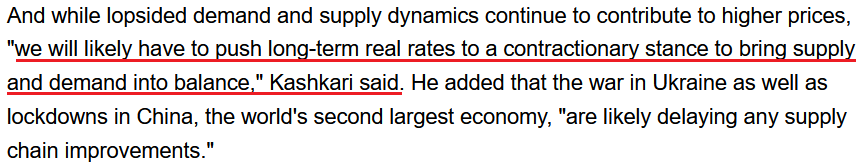
Minneapolis Fed President Neel Kashkari (a major dove) took the words right out of my mouth on May 6. He said:
 Source: Seeking Alpha
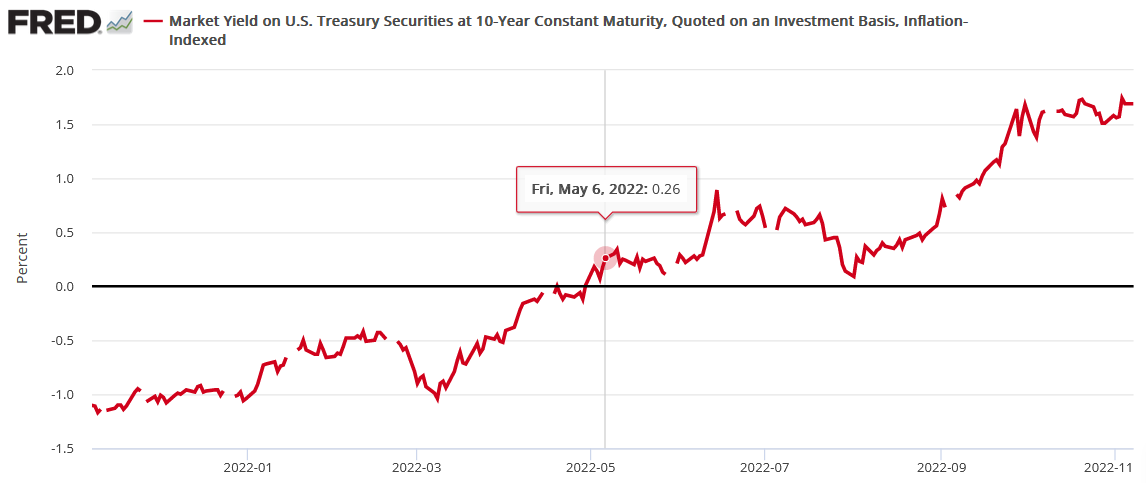
Therefore, with “contractionary” implying a U.S. 10-Year real yield at or above the highs from 2018 (> 1%), a realization is profoundly bearish for the PMs.
Moreover, with the U.S. 10-Year real yield up by more than 6x since May 6, its ascent weighed on risk assets. For context, the GDXJ ETF ended the May 6 session at $41.45, so it’s declined substantially, even when considering the recent rally.
Please see below:
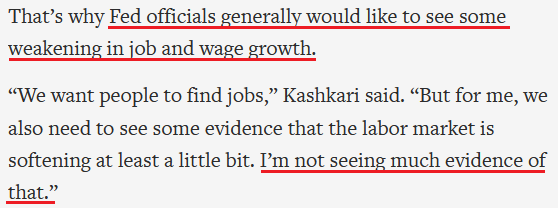
Yet, the critical point is that the same investors who ignored Kashkari and many other Fed officials’ warnings back then are making the same mistake now. Please remember what Kashkari said on Nov. 4:
 Source: Associated Press
Likewise, Powell made the point loud and clear during his post-FOMC press conference on Nov. 2:
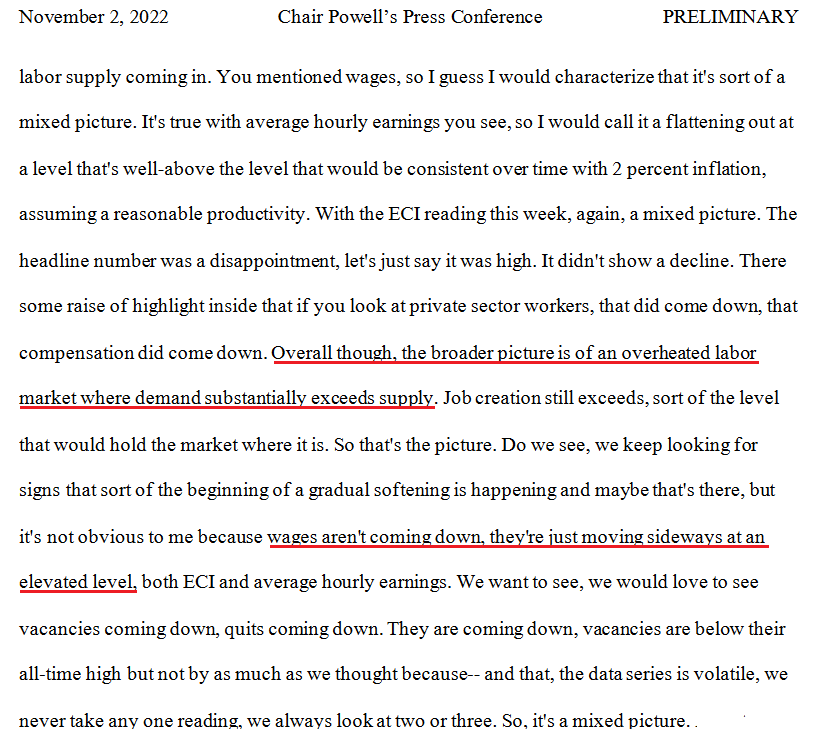 Source: U.S. Fed
So with Kashkari and Powell both saying that the FFR will need to rise more than previously expected, the crowd is buying hope and selling reality as they did in May, despite the strategy incurring substantial losses.
All in all, while the PMs’ recent price action has been disappointing, the fundamentals haven’t changed: Fed officials told us they wanted higher real yields in May, and those who paid attention benefitted; and with October’s employment data still highly resilient, their message is loud and clear now: the FFR’s peak is still a long way away.
As a result, expect the bulls to shake their heads in disbelief once again when reality re-emerges in the months ahead.
The Bottom Line
While investors are eager to repeat their springtime mistake, the herd behavior highlights why the crowd is often poor at reading the fundamentals. With employment largely outperforming expectations in recent months, the Fed has made little progress in creating the demand destruction necessary to reduce inflation; and while Powell and Kashkari said that explicitly, the consensus remains in denial. As such, the bottom fishers should suffer mightily when sentiment reverses.
In conclusion, the PMs rallied on Nov. 8, as mistakes are only obvious in hindsight. However, with Bitcoin’s plight another microcosm of the shifting fundamental environment, the outlook for gold, silver, mining stocks and the S&P 500 remains highly treacherous. Therefore, I think that the bear market still has plenty of room to run.
Technically Speaking
Remember when Trump was elected as the U.S. President? And remember what happened to the price of gold at that time?
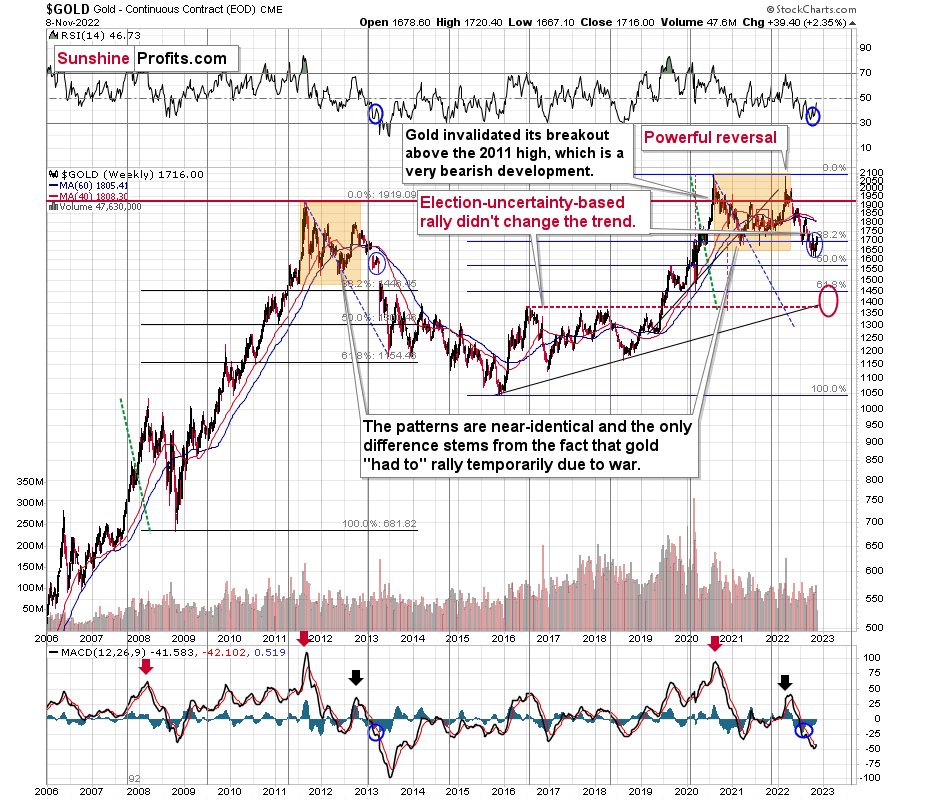
I marked in on the above chart, but to make it clearer, I’ll zoom in.
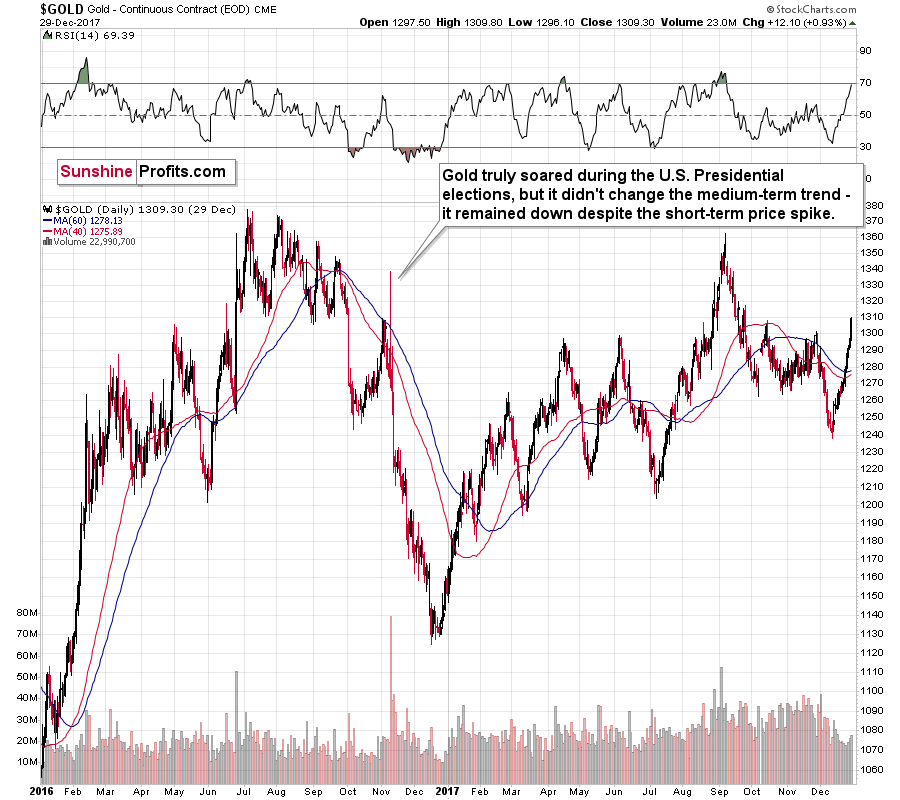
Gold truly soared during the 2016 U.S. Presidential elections, but it didn't change the medium-term trend - it remained down despite the short-term price spike.
The election-based price spike took place after a corrective short-term rally.
And what happened yesterday and in the preceding days?
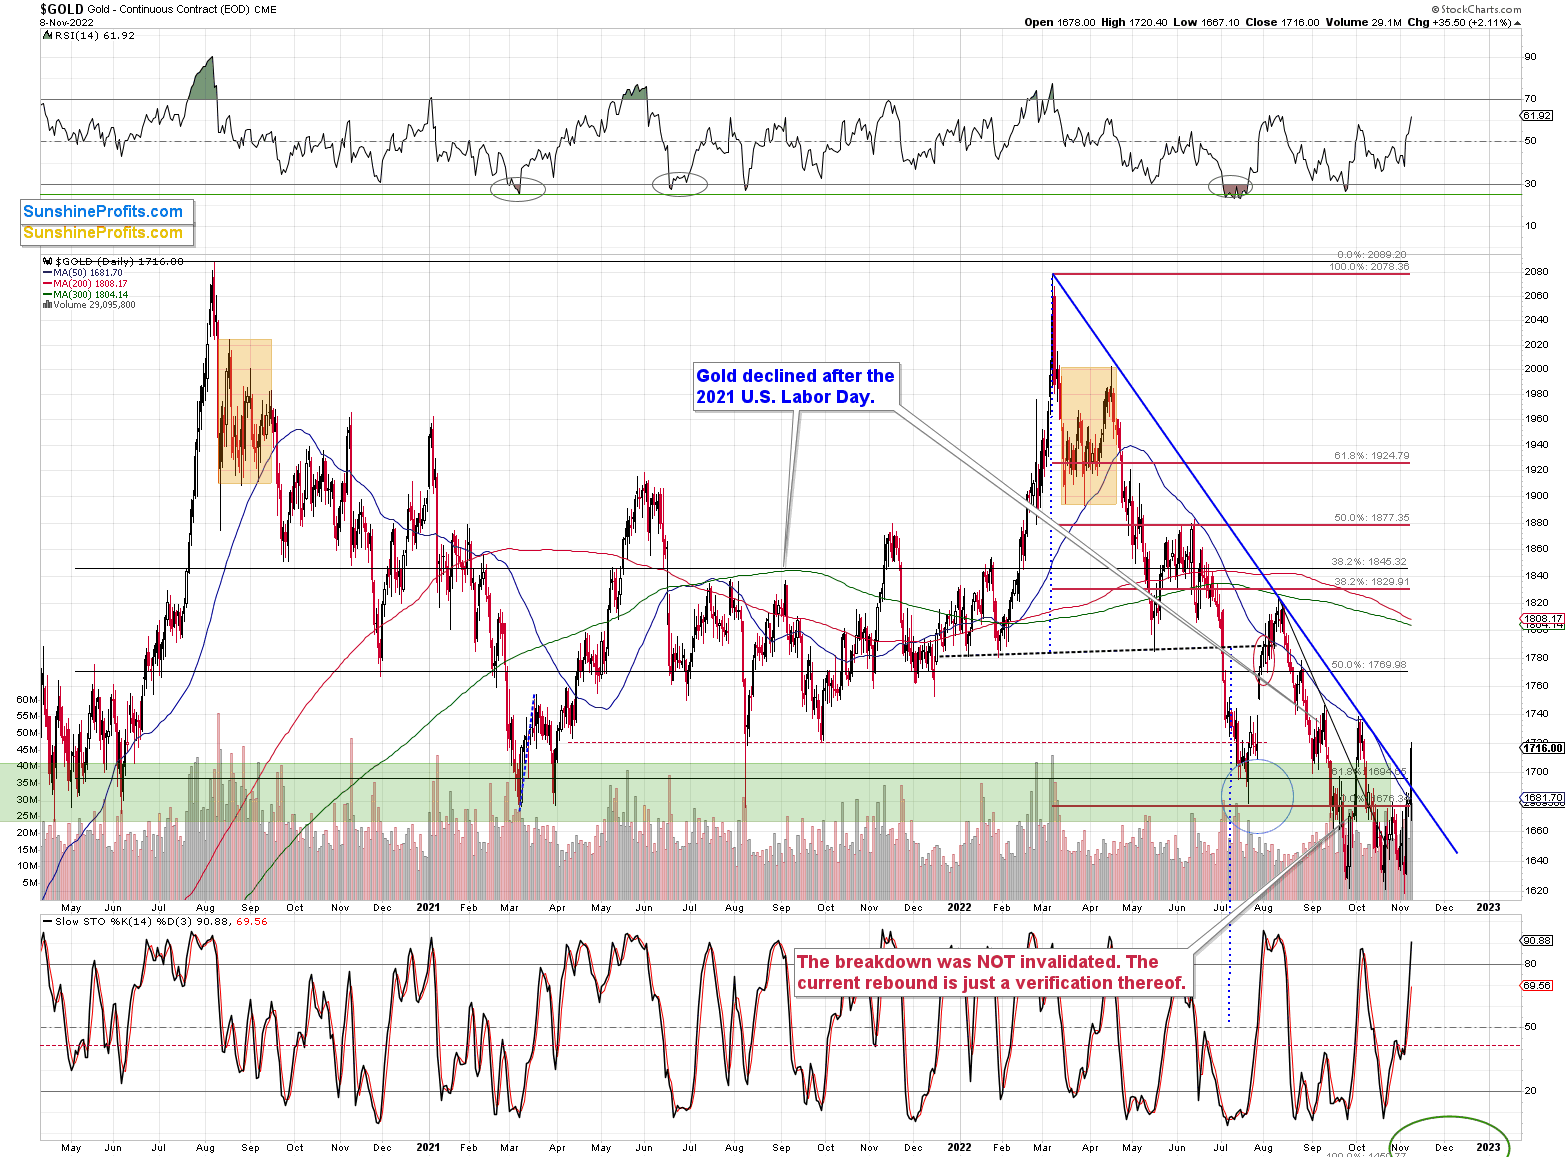
Gold moved sharply higher after a short-term rally. The history tends to rhyme, so I doubt that yesterday’s price action is able to trigger a sustainable rally.
That was just a single daily close above the declining, medium-term resistance line (marked with blue), and the 50-day moving average. Will this breakout be confirmed? Again, I doubt it.
Interestingly, based on yesterday’s rally, the gold-based RSI moved slightly above 60. That’s exactly what happened back in 2016 after the U.S. Presidential elections. And that was a local top – right before a massive slide. Gold then declined by almost 16% in less than two following months.
If the same was to happen now, gold would move to about $1,450. And yes, that would be in perfect tune with my previous analyses. That’s where we have strong support based on the 2020 lows.
Let’s keep in mind that the two key fundamental drivers of gold price are: the real interest rates, and the USD Index.
The real interest rates are clearly headed higher (nominal rates are going up, and eventually inflation is likely to come down), which is bearish for gold.
And the USD Index…
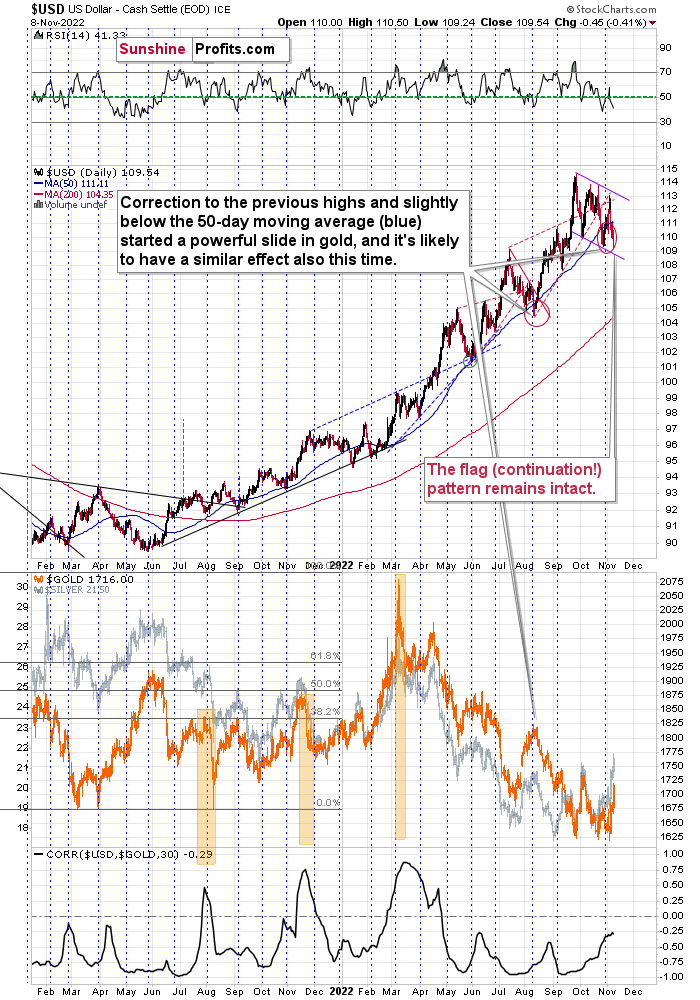
In short, the USD Index remains in its flag pattern that started in September. A flag pattern is a continuation pattern where the price trades sideways (but slightly against the trend) and it continues… until it doesn’t. Quite often, the pattern ends after two or three bottoms. We already had two, and it seems that the third one is about to be formed or it has already formed.
The RSI is slightly below 50 and the USDX itself is a bit below its 50-day moving average (blue line). In the previous months, this combination of factors meant that another sizable rally was just around the corner. As history tends to rhyme, the implications are bullish.
Since March, gold has been moving in the opposite direction to the USD Index, so the implications of the above are bearish for gold and the rest of the precious metals sector.
Why wasn’t gold moving against the USD Index in February? Because of the fear and uncertainty related to the Russian invasion of Ukraine. Please note that the war in Ukraine is still in place, and yet, gold is hundreds of dollars below its 2022 high. This serves as a strong confirmation of gold’s current weakness.
All in all, despite the very recent upswing in gold, the outlook for the precious metals sector remains very bearish in the medium term.
Overview of the Upcoming Part of the Decline
- It seems to me that the corrective upswing is over and that the next big move lower is already underway.
- If we see a situation where miners slide in a meaningful and volatile way while silver doesn’t (it just declines moderately), I plan to – once again – switch from short positions in miners to short positions in silver. At this time, it’s too early to say at what price levels this could take place and if we get this kind of opportunity at all – perhaps with gold prices close to $1,500 - $1,550.
- I plan to switch from the short positions in junior mining stocks or silver (whichever I’ll have at that moment) to long positions in junior mining stocks when gold / mining stocks move to their 2020 lows (approximately). While I’m probably not going to write about it at this stage yet, this is when some investors might consider getting back in with their long-term investing capital (or perhaps 1/3 or 1/2 thereof).
- I plan to return to short positions in junior mining stocks after a rebound – and the rebound could take gold from about $1,450 to about $1,550, and it could take the GDXJ from about $20 to about $24.
- I plan to exit all remaining short positions once gold shows substantial strength relative to the USD Index while the latter is still rallying. This may be the case with gold prices close to $1,400 and GDXJ close to $15 . This moment (when gold performs very strongly against the rallying USD and miners are strong relative to gold after its substantial decline) is likely to be the best entry point for long-term investments, in my view. This can also happen with gold close to $1,400, but at the moment it’s too early to say with certainty.
- The above is based on the information available today, and it might change in the following days/weeks.
You will find my general overview of the outlook for gold on the chart below:
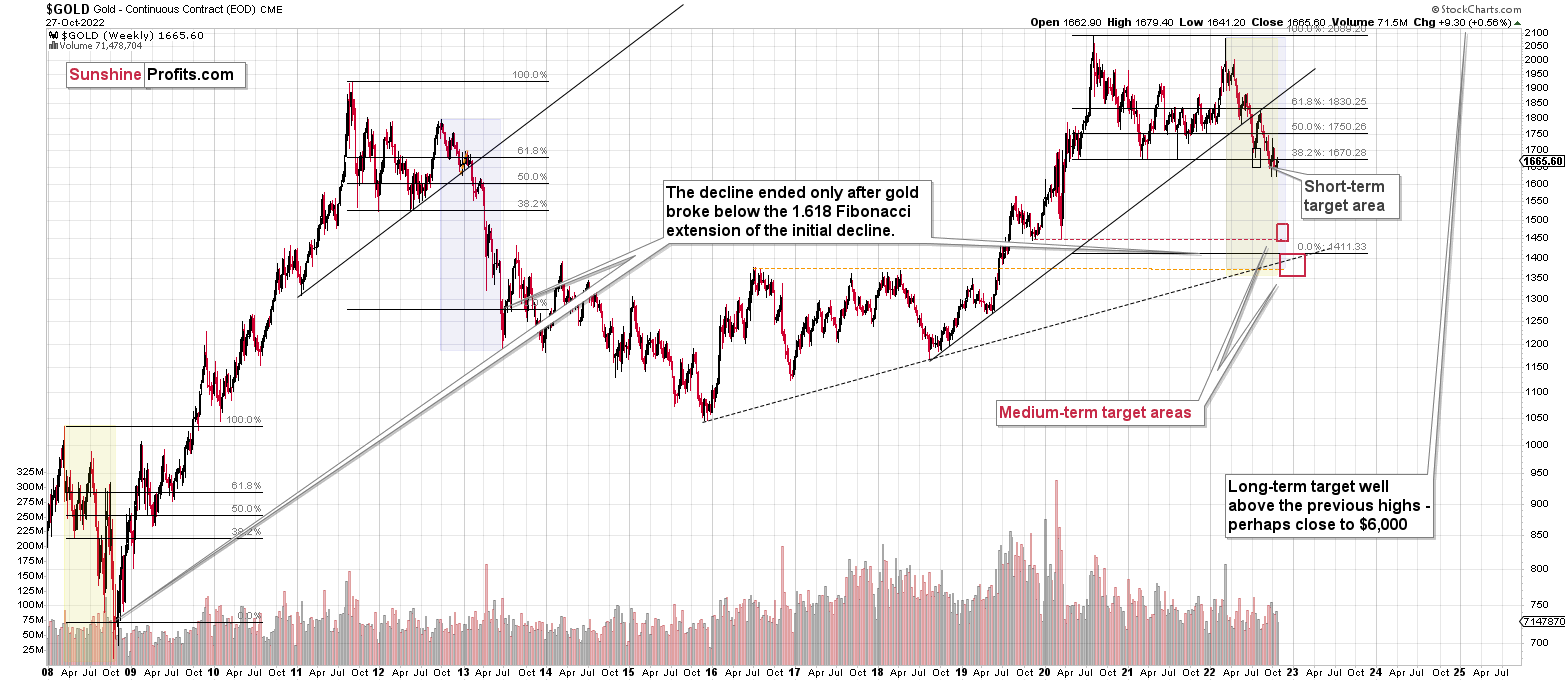
Please note that the above timing details are relatively broad and “for general overview only” – so that you know more or less what I think and how volatile I think the moves are likely to be – on an approximate basis. These time targets are not binding nor clear enough for me to think that they should be used for purchasing options, warrants, or similar instruments.
Summary
Summing up, it seems that the biggest part of the 2013-like decline is taking place right now, and – while I can’t make any promises regarding performance - it seems likely to me that our big profits are about to become huge and then ridiculously big in the relatively near future.
As I have written before, the recent upswing didn’t change anything. While the mining stocks appeared “strong” recently, it seems to me that it’s just a reflection of the temporary (in my view) strength in the general stock market. And as stocks decline, mining stocks – and especially junior mining stocks – are likely to truly slide.
Things might happen very fast in the coming days, and if I plan to make any adjustments, I’ll keep you informed. Still, if the targets that I’m mentioning in the “Trading” part of the summary are reached, I think that profits should be taken off the table without an additional confirmation from me. I will probably get on the long side of the market at that time, but I’ll send a confirmation if I decide to do so.
After the final sell-off (that takes gold to about $1,350-$1,500), I expect the precious metals to rally significantly. The final part of the decline might take as little as 1-5 weeks, so it's important to stay alert to any changes.
As always, we'll keep you – our subscribers – informed.
To summarize:
Trading capital (supplementary part of the portfolio; our opinion): Full speculative short positions (300% of the full position) in junior mining stocks are justified from the risk to reward point of view with the following binding exit profit-take price levels:
Mining stocks (price levels for the GDXJ ETF): binding profit-take exit price: $20.32; stop-loss: none (the volatility is too big to justify a stop-loss order in case of this particular trade)
Alternatively, if one seeks leverage, we’re providing the binding profit-take levels for the JDST (2x leveraged). The binding profit-take level for the JDST: $27.87; stop-loss for the JDST: none (the volatility is too big to justify a SL order in case of this particular trade).
For-your-information targets (our opinion; we continue to think that mining stocks are the preferred way of taking advantage of the upcoming price move, but if for whatever reason one wants / has to use silver or gold for this trade, we are providing the details anyway.):
Silver futures downside profit-take exit price: $12.32
SLV profit-take exit price: $11.32
ZSL profit-take exit price: $74.87
Gold futures downside profit-take exit price: $1,504
HGD.TO – alternative (Canadian) 2x inverse leveraged gold stocks ETF – the upside profit-take exit price: $18.47
HZD.TO – alternative (Canadian) 2x inverse leveraged silver ETF – the upside profit-take exit price: $46.87
Long-term capital (core part of the portfolio; our opinion): No positions (in other words: cash)
Insurance capital (core part of the portfolio; our opinion): Full position
Whether you’ve already subscribed or not, we encourage you to find out how to make the most of our alerts and read our replies to the most common alert-and-gold-trading-related-questions.
Please note that we describe the situation for the day that the alert is posted in the trading section. In other words, if we are writing about a speculative position, it means that it is up-to-date on the day it was posted. We are also featuring the initial target prices to decide whether keeping a position on a given day is in tune with your approach (some moves are too small for medium-term traders, and some might appear too big for day-traders).
Additionally, you might want to read why our stop-loss orders are usually relatively far from the current price.
Please note that a full position doesn't mean using all of the capital for a given trade. You will find details on our thoughts on gold portfolio structuring in the Key Insights section on our website.
As a reminder - "initial target price" means exactly that - an "initial" one. It's not a price level at which we suggest closing positions. If this becomes the case (as it did in the previous trade), we will refer to these levels as levels of exit orders (exactly as we've done previously). Stop-loss levels, however, are naturally not "initial", but something that, in our opinion, might be entered as an order.
Since it is impossible to synchronize target prices and stop-loss levels for all the ETFs and ETNs with the main markets that we provide these levels for (gold, silver and mining stocks - the GDX ETF), the stop-loss levels and target prices for other ETNs and ETF (among other: UGL, GLL, AGQ, ZSL, NUGT, DUST, JNUG, JDST) are provided as supplementary, and not as "final". This means that if a stop-loss or a target level is reached for any of the "additional instruments" (GLL for instance), but not for the "main instrument" (gold in this case), we will view positions in both gold and GLL as still open and the stop-loss for GLL would have to be moved lower. On the other hand, if gold moves to a stop-loss level but GLL doesn't, then we will view both positions (in gold and GLL) as closed. In other words, since it's not possible to be 100% certain that each related instrument moves to a given level when the underlying instrument does, we can't provide levels that would be binding. The levels that we do provide are our best estimate of the levels that will correspond to the levels in the underlying assets, but it will be the underlying assets that one will need to focus on regarding the signs pointing to closing a given position or keeping it open. We might adjust the levels in the "additional instruments" without adjusting the levels in the "main instruments", which will simply mean that we have improved our estimation of these levels, not that we changed our outlook on the markets. We are already working on a tool that would update these levels daily for the most popular ETFs, ETNs and individual mining stocks.
Our preferred ways to invest in and to trade gold along with the reasoning can be found in the how to buy gold section. Furthermore, our preferred ETFs and ETNs can be found in our Gold & Silver ETF Ranking.
As a reminder, Gold & Silver Trading Alerts are posted before or on each trading day (we usually post them before the opening bell, but we don't promise doing that each day). If there's anything urgent, we will send you an additional small alert before posting the main one.
Thank you.
Przemyslaw K. Radomski, CFA
Founder, Editor-in-chief

