

Briefly: in our opinion, full (300% of the regular position size) speculative short positions in junior mining stocks are justified from the risk/reward point of view at the moment of publishing this Alert.
Gold declined heavily yesterday, it clearly invalidated its inverse head-and-shoulders pattern, and it showed that it can still slide while the USD Index is moving somewhat higher. In other words, things appear to be back to normal, and quite in tune with what I’ve been warning about previously.
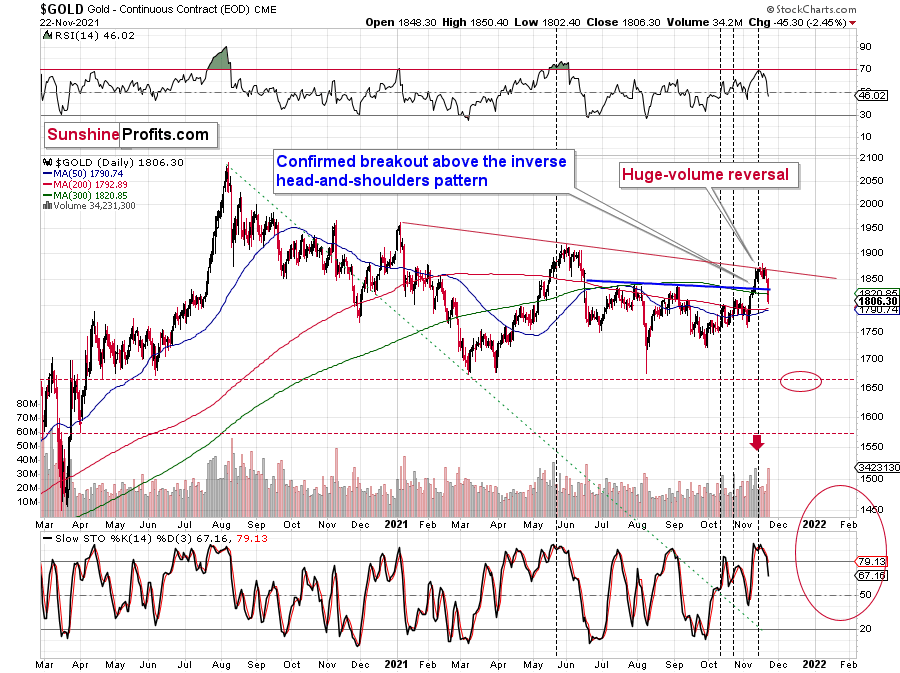
I warned that the inverse H&S pattern could be invalidated and that’s exactly what has just happened. The invalidation materialized on huge volume, which makes it “believable” and not random.
The fact that it all happened shortly after gold failed to break above its declining red resistance line, and after the gold-price-based RSI indicator (upper part of the above chart) moved close to 70, only adds to the credibility of the bearish case.
I also recorded a short video with a general overview of the situation on the gold market:
Also, in today’s pre-market trading, the USD Index is slightly lower, and gold is down by over $9. The implications are bearish not only for gold but for the rest of the precious metals sector as well.
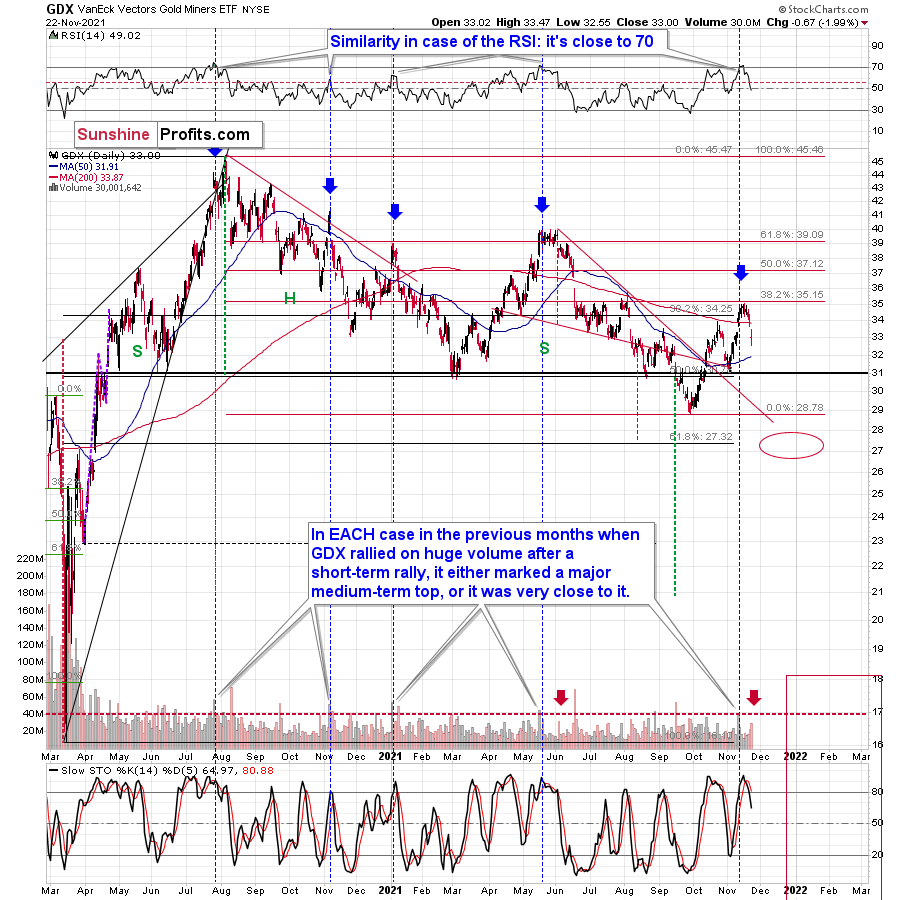
Gold miners (the GDX ETF) moved lower by about 2% yesterday, and it took form on quite a visible volume too. This makes the current situation even more similar to what happened in May and June, earlier this year. I marked similar sessions with red arrows.
Back in June that was just the beginning of a much bigger decline, and the same appears to be the case right now.
In other words, buckle up, because our short positions in mining stocks are likely to become a source of major gains without a bigger delay.
Also, let’s keep in mind that GDX topped in perfect tune with the previous topping patterns that formed right after GDX’s high-volume rally. I previously wrote:
The GDX ETF rallied on huge volume on Nov. 11 and there were only 4 cases in the recent past when we saw something like that after a visible short-term rally.
In EACH of those 4 cases, GDX was after a sharp daily rally.
In EACH of those 4 cases, GDX-based RSI indicator (upper part of the chart above) was trading close to 70.
The rallies that immediately preceded these 4 cases:
- The July 27, 2020 session was immediately preceded by a 29-trading-day rally that took the GDX about 42% higher. It was 7 trading days before the final top (about 24% of time).
- The November 5, 2020 session was immediately preceded by a 5-trading-day rally that took the GDX about 14%-15% higher (the high-volume day / the top). It was 1 trading day before the final top (20% of time).
- The January 4, 2021 session was immediately preceded by a 26-trading-day rally that took the GDX about 17%-18% higher (the high-volume day / the top). It was 1 trading day before the final top (about 4% of time).
- The May 17, 2021 session was immediately preceded by a 52-trading-day rally that took the GDX about 30% higher. It was 7 trading days before the final top (about 13% of time).
So, as you can see these sessions have even more in common than it seemed at the first sight. The sessions formed soon before the final tops (4% - 24% of time of the preceding rally before the final top), but the prices didn’t move much higher compared to how much they had already rallied before the high-volume sessions.
Consequently, since history tends to rhyme, we can expect the GDX ETF to move a bit higher here (but not significantly so) and we can expect this extra move higher to take between additional 0 to 7 trading days (based on the Nov. 12 session).
If the final top formed on Nov. 16, then it formed 4 trading days after the huge-volume session, practically right in the middle of the expected 0-7 trading day range.
Moreover, since the GDX topped very close to its 38.2% Fibonacci retracement, it seems that miners corrected “enough” for another huge downswing to materialize.
Having said that, let’s take a look at the markets from a more fundamental angle.
Hawk Talk
With Fed Chairman Jerome Powell officially reappointed for a second term and Fed Governor Lael Brainard promoted to Vice-Chair, the chess pieces are now in place atop the FOMC. However, with inflation surging and the Fed materially behind the curve, the central bank has begun to ratchet up the hawkish rhetoric.
To explain, I wrote on Oct. 21:
While the deflationists have receded into the background and the Fed is hoping that 2022 will be more kind to its “transitory” narrative, inflation is still accelerating. And while the death of QE should help calm some of the fervor, an accelerated taper that concludes “by the middle of next year” is extremely bullish for the USD Index. Moreover, with the Fed still materially behind the inflation curve, hawkish whispers of further tightening should hit the wire in the coming months.
And right on cue, Fed Vice Chairman Richard Clarida (who still holds the position until January 2022) said on Nov. 19 that he’s concerned about the “upside risk to inflation.”
“I’ll be looking closely at the data that we get between now and the December meeting. It may well be appropriate at that meeting to have a discussion about increasing the pace at which we are reducing our asset purchases”.
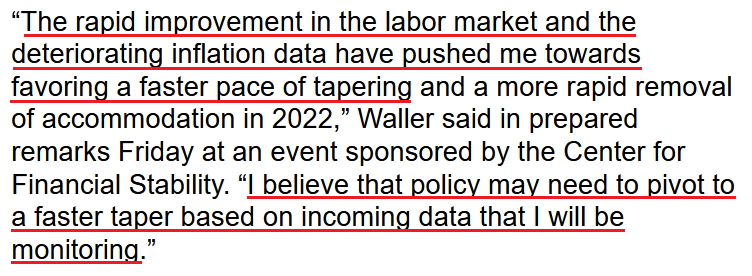
For context, the FOMC announced the taper only 20 days ago. And now, Clarida is hinting at accelerating the Fed’s already accelerated taper timeline. Furthermore, Fed Governor Christopher Waller (another voting FOMC member) said on Nov. 19 that two outcomes are possible over the coming months:
If “some other factor substantially slows the recovery, hindering the progress toward maximum employment, the FOMC could slow the taper,” Waller said. “But if the economy makes quick progress toward maximum employment or inflation data show no signs of retreating from their currently high readings, the committee may choose to speed up the taper, which would position it to accelerate subsequent steps in tightening monetary policy if necessary.”
And on which side does he reside?
 Source: Bloomberg
Likewise, following the reappointment on Nov. 22, Powell said that “we know that high inflation takes a toll on families, especially those less able to meet the higher costs of essentials, like food, housing, and transportation. We will use our tools both to support the economy – a strong labor market – and to prevent higher inflation from becoming entrenched.”
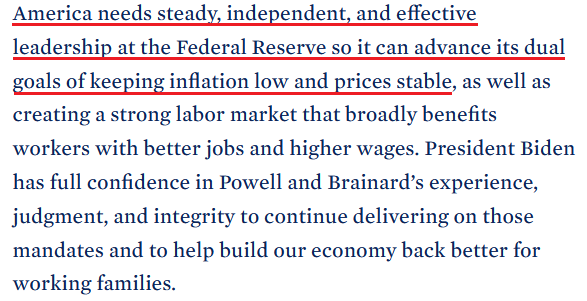
And U.S. President Joe Biden added on Nov. 22 that he is “confident that Chair Powell and Dr. Brainard’s focus on keeping inflation low, prices stable, and delivering full employment will make our economy stronger than ever before.”
Likewise, a statement by The White House had a similar message:
 Source: The White House
And why is all of this so important? Well, because I warned on Nov. 18 that ‘the war on inflation’ is already underway. I wrote:
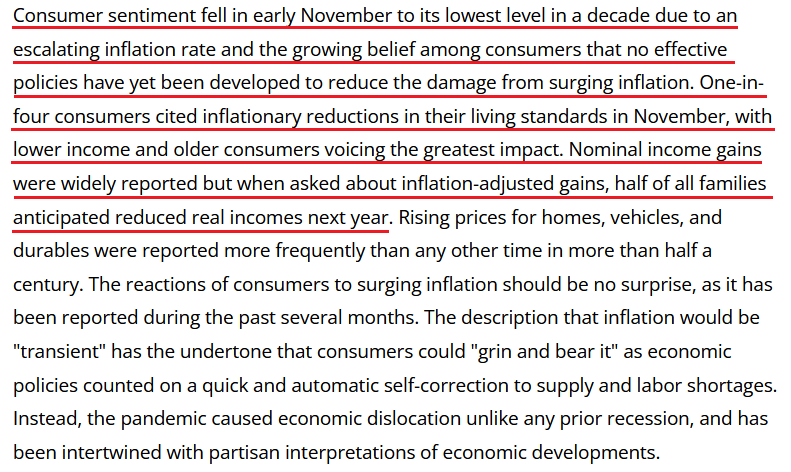
The University of Michigan released its Consumer Sentiment Index on Nov. 12. And with the index hitting a 10-year low, it’s no coincidence that The White House (and soon likely the Fed) has made inflation Public Enemy No. 1.
Please see below:
 Source: the University of Michigan
Second, the political component shouldn’t be ignored. Biden’s approval ratings keep hitting new lows along with consumer confidence. Thus, is it in his best interest to maintain the status quo? Of course not. That’s why he’s been so forceful on inflation over the last few weeks. Essentially, if he (and/or the Fed) does nothing, he’ll likely lose the next presidential election and the Democrats will likely lose control of Congress. However, if he tames inflation, then he’s a hero. And left with those two options, which one do you think he’ll choose?
Thus, it’s important to remember that reappointing Powell was a hawkish move. And while the statement may seem laughable due to his dovish disposition over the last 10 months, Powell is still more hawkish than Brainard.
However, given the nature of U.S. inflation, we believe that it doesn’t matter who runs the Fed. The reality is: if prices keep rising and consumer confidence keeps falling, eventually demand destruction unfolds. Thus, whether it’s Powell or Brainard calling the shots, failure to solve the inflationary conundrum will likely push the U.S. economy into recession.
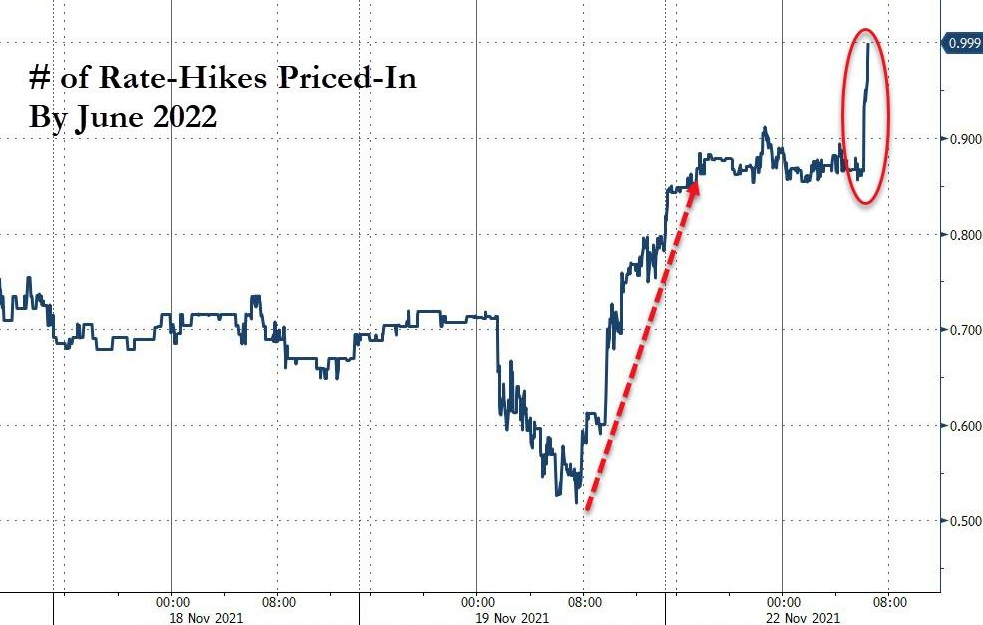
Despite that, though, investors reacted on Nov. 22. And after the reappointment of Powell lit a hawkish fire, rate hike bets began to smolder. To explain, futures traders previously expected the Fed to raise interest rates in September 2022. However, after the headline Consumer Price Index (CPI) surged by 6.2% year-over-year (YoY) on Nov. 10 – the highest YoY percentage increase since 1990 – the forecast was pulled forward to July 2022.
Now, with Powell reappointed on Nov. 22, futures traders expect the first rate hike to materialize in June 2022.
Please see below:
 Source: Bloomberg/ZeroHedge
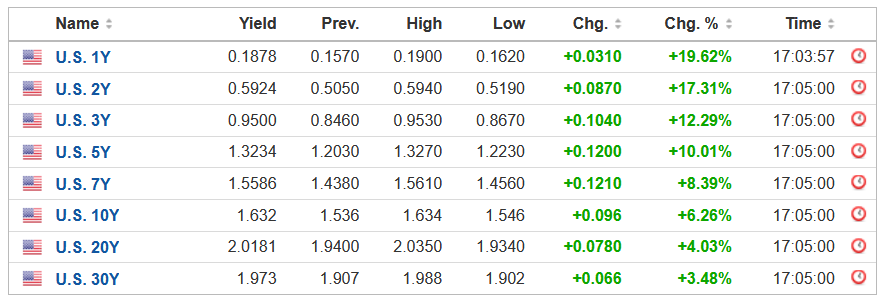
What’s more, the U.S. yield curve surged on Nov. 22, and the U.S. 5-Year Treasury yield hit a new 2021 high.
Please see below:
 Source: Investing.com
However, while the drama helped uplift the USD Index and upend the PMs, the ‘hawk talk’ is likely far from its peak. And with inflation still surging and the Fed still materially behind the curve, the FOMC will likely pivot from hawkish rhetoric to hawkish policy in the coming months. This means that bearish forecasts for gold and bearish forecasts for silver “have legs”.
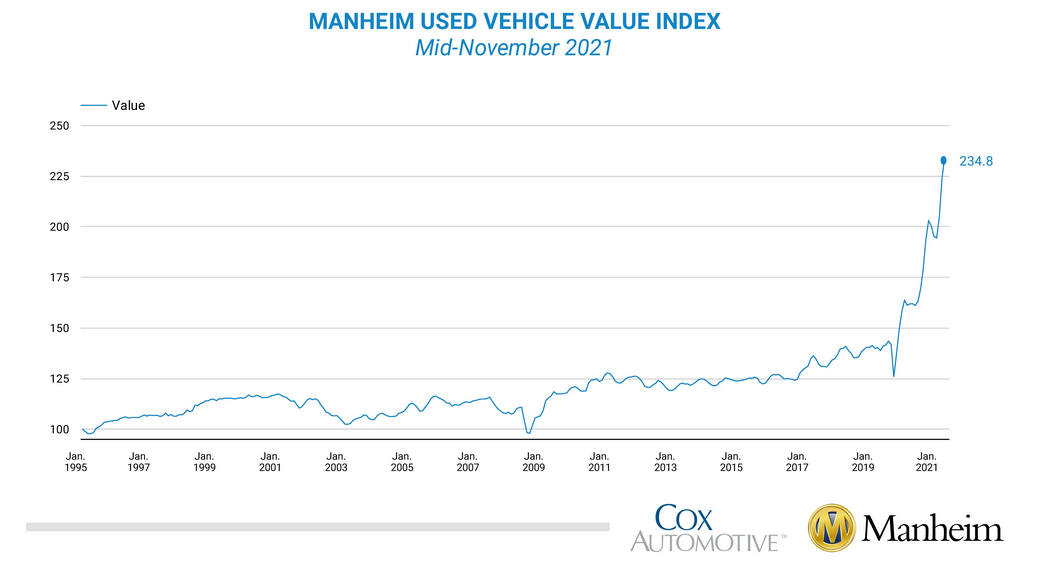
To explain, the Manheim Used Vehicle Value Index “increased 4.9% in the first 15 days of November compared to October. This brought the Manheim Used Vehicle Value Index to [a record high] 234.8, a 44.9% increase from November 2020.”
Please see below:
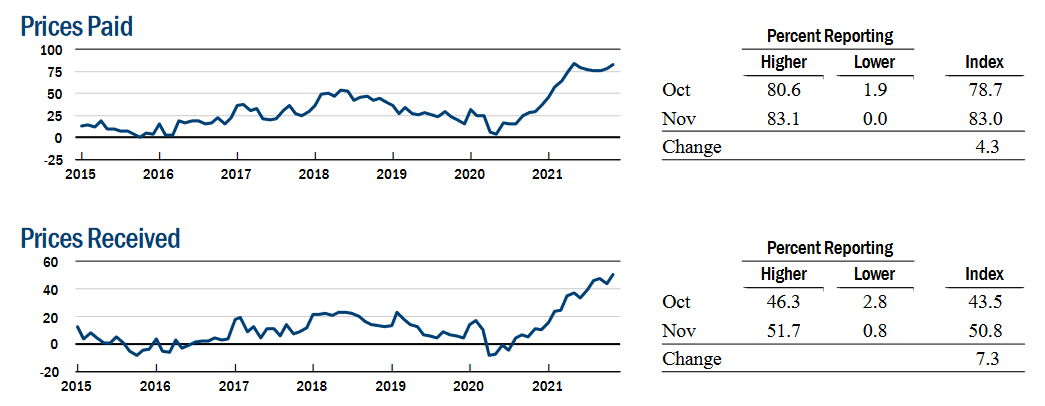
Second, the New York Fed released its Empire State Manufacturing Survey on Nov. 16. And while the headline index increased from 19.9 in October to 30.9 in November, the report revealed:
“The prices paid index edged up four points to 83.0, and the prices received index moved up seven points to a record high of 50.8, signaling ongoing substantial increases in both input prices and selling prices.”
Please see below:
 Source: New York Fed
Third, the Philadelphia Fed released its Manufacturing Business Outlook Survey on Nov. 18. And while the headline index increased from 24 in October to 39 in November, inflation remains the talk of the town. The report revealed:
“Firms continued to report increases in prices for inputs and their own goods. The prices paid diffusion index rose 10 points to 80.0, its highest reading since June’s 42-year high of 80.7. Over 82 percent of the firms reported increases in input prices, while 2 percent reported decreases. The current prices received index increased 12 points to 62.9, its highest reading since June 1974.”
On top of that, when Philadelphia manufacturing firms were asked about their pricing plans over the next four quarters, can you guess what they said?
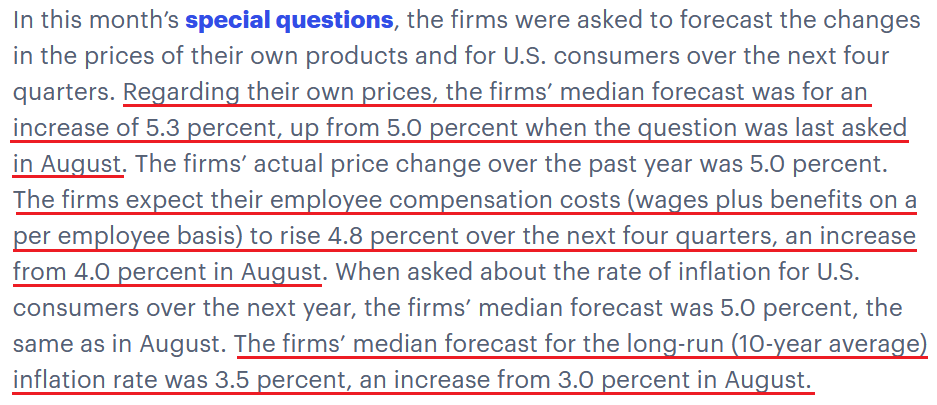 Source: Philadelphia Fed
The bottom line? 'The war on inflation is upon us, as policymakers realize that pricing pressures won't abate without an active response. As a result, the FOMC's priorities have shifted from maximum employment to containing inflation. And while I've been warning for months that surging inflation would elicit hawkish shifts from the Fed, there is still plenty of room to run.
For example, the Fed is nowhere near its 2% annual target and likely won't be without raising interest rates. And while the U.S. dollar has been on fire recently, the more 'hawk talk' that materializes, the more bullish it is for the USD Index. As a result, while I seem to repeat the statement weekly, the U.S. dollar's fundamentals are stronger now than at any other point in 2021.
In conclusion, the PMs declined on Nov. 22, and the USD Index continued its bullish assault. And with U.S. Treasury yields waking up from their slumber, the two-headed monster showcased its fundamental might. Moreover, with inflation surging and the Fed poised to pivot even further in the coming months, gold should suffer more daily 'flash crashes' along the way.
Overview of the Upcoming Part of the Decline
- It seems to me that the current corrective upswing in gold is about to be over soon, and the next short-term move lower is about to begin. Since it appears to be another short-term move more than a continuation of the bigger decline, I think that junior miners would be likely to (at least initially) decline more than silver.
- It seems that the first stop for gold will be close to its previous 2021 lows, slightly below $1,700. Then it will likely correct a bit, but it’s unclear if I want to exit or reverse the current short position based on that – it depends on the number and the nature of the bullish indications that we get at that time.
- After the above-mentioned correction, we’re likely to see a powerful slide, perhaps close to the 2020 low ($1,450 - $1,500).
- If we see a situation where miners slide in a meaningful and volatile way while silver doesn’t (it just declines moderately), I plan to – once again – switch from short positions in miners to short positions in silver. At this time, it’s too early to say at what price levels this could take place, and if we get this kind of opportunity at all – perhaps with gold close to $1,600.
- I plan to exit all remaining short positions once gold shows substantial strength relative to the USD Index while the latter is still rallying. This may be the case with gold close to $1,350 - $1,400. I expect silver to fall the hardest in the final part of the move. This moment (when gold performs very strongly against the rallying USD and miners are strong relative to gold after its substantial decline) is likely to be the best entry point for long-term investments, in my view. This can also happen with gold close to $1,375, but at the moment it’s too early to say with certainty. I expect the final bottom to take place near the end of the year, perhaps in mid-December. It is not set in stone that PMs have to bottom at that time. If not then, then early 2022 would become a likely time target.
- As a confirmation for the above, I will use the (upcoming or perhaps we have already seen it?) top in the general stock market as the starting point for the three-month countdown. The reason is that after the 1929 top, gold miners declined for about three months after the general stock market started to slide. We also saw some confirmations of this theory based on the analogy to 2008. All in all, the precious metals sector is likely to bottom about three months after the general stock market tops. The additional confirmation will come from the tapering schedule, as markets are likely to move on the rumor and reverse on the fact as they tend to do in general.
- The above is based on the information available today, and it might change in the following days/weeks.
You will find my general overview of the outlook for gold on the chart below:
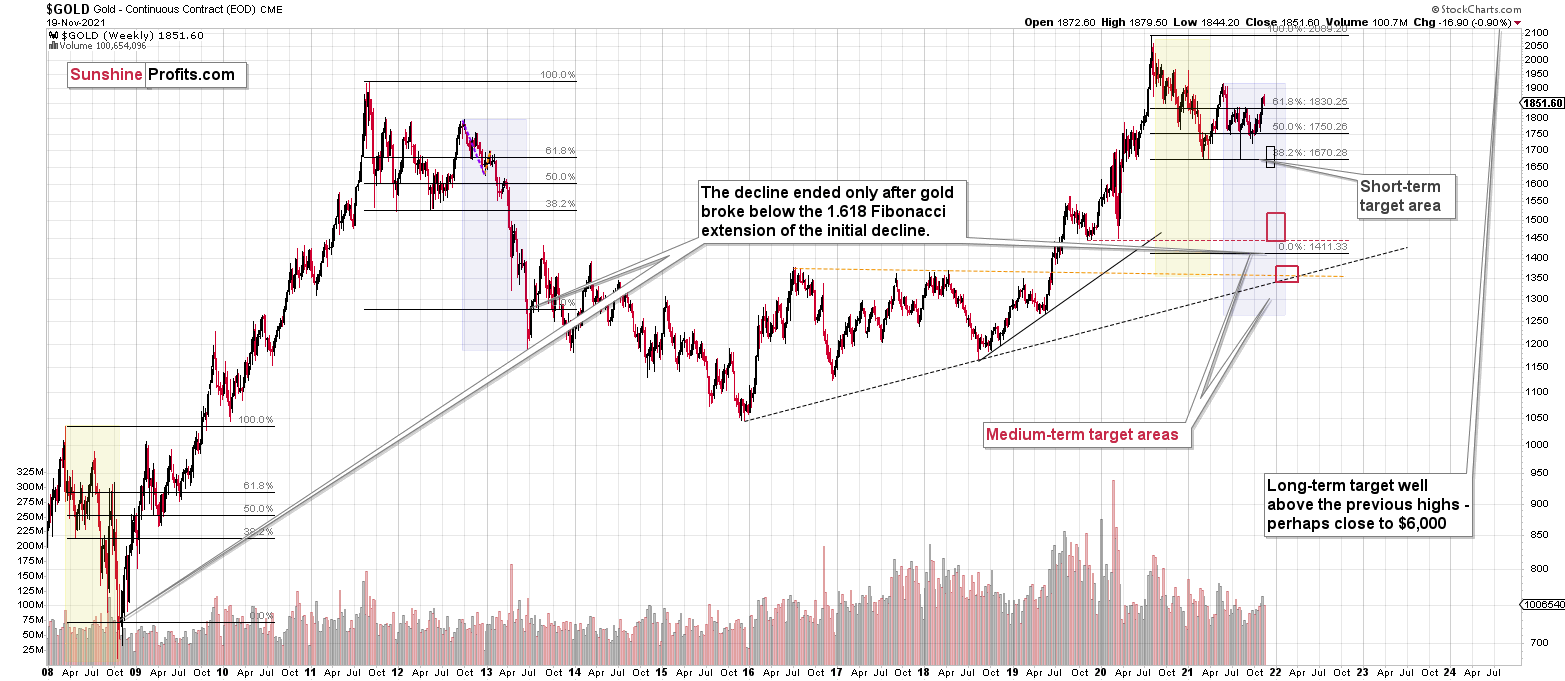
Please note that the above timing details are relatively broad and “for general overview only” – so that you know more or less what I think and how volatile I think the moves are likely to be – on an approximate basis. These time targets are not binding or clear enough for me to think that they should be used for purchasing options, warrants or similar instruments.
Summary
The PMs declined last week after rallying on the previous week when their momentum has teetered on euphoria. However, when prices diverge from fundamentals, sharp sell-offs often occur when sentiment shifts. As a result, caution is warranted, and the PMs’ recent bout of optimism will probably end in disappointment. This disappointment has likely already started on Nov. 16, in tune with the previous high-volume-based patterns.
Since it seems that the PMs are likely about to start another short-term move lower more, I think that junior miners would be likely to (at least initially) decline more than silver.
From the medium-term point of view, the key two long-term factors remain the analogy to 2013 in gold and the broad head and shoulders pattern in the HUI Index. They both suggest much lower prices ahead.
It seems that our profits from the short positions are going to become truly epic in the following months.
After the sell-off (that takes gold to about $1,350 - $1,500), I expect the precious metals to rally significantly. The final part of the decline might take as little as 1-5 weeks, so it's important to stay alert to any changes.
Most importantly, please stay healthy and safe. We made a lot of money last March and this March, and it seems that we’re about to make much more on the upcoming decline, but you have to be healthy to enjoy the results.
As always, we'll keep you - our subscribers - informed.
To summarize:
Trading capital (supplementary part of the portfolio; our opinion): Full speculative short positions (300% of the full position) in junior mining stocks are justified from the risk to reward point of view with the following binding exit profit-take price levels:
Mining stocks (price levels for the GDXJ ETF): binding profit-take exit price: $35.73; stop-loss: none (the volatility is too big to justify a stop-loss order in case of this particular trade)
Alternatively, if one seeks leverage, we’re providing the binding profit-take levels for the JDST (2x leveraged) and GDXD (3x leveraged – which is not suggested for most traders/investors due to the significant leverage). The binding profit-take level for the JDST: $16.18; stop-loss for the JDST: none (the volatility is too big to justify a SL order in case of this particular trade); binding profit-take level for the GDXD: $32.08; stop-loss for the GDXD: none (the volatility is too big to justify a SL order in case of this particular trade).
For-your-information targets (our opinion; we continue to think that mining stocks are the preferred way of taking advantage of the upcoming price move, but if for whatever reason one wants / has to use silver or gold for this trade, we are providing the details anyway.):
Silver futures downside profit-take exit price: $19.12
SLV profit-take exit price: $17.72
ZSL profit-take exit price: $41.38
Gold futures downside profit-take exit price: $1,683
HGD.TO – alternative (Canadian) inverse 2x leveraged gold stocks ETF – the upside profit-take exit price: $12.48
HZD.TO – alternative (Canadian) inverse 2x leveraged silver ETF – the upside profit-take exit price: $30.48
Long-term capital (core part of the portfolio; our opinion): No positions (in other words: cash
Insurance capital (core part of the portfolio; our opinion): Full position
Whether you already subscribed or not, we encourage you to find out how to make the most of our alerts and read our replies to the most common alert-and-gold-trading-related-questions.
Please note that we describe the situation for the day that the alert is posted in the trading section. In other words, if we are writing about a speculative position, it means that it is up-to-date on the day it was posted. We are also featuring the initial target prices to decide whether keeping a position on a given day is in tune with your approach (some moves are too small for medium-term traders, and some might appear too big for day-traders).
Additionally, you might want to read why our stop-loss orders are usually relatively far from the current price.
Please note that a full position doesn't mean using all of the capital for a given trade. You will find details on our thoughts on gold portfolio structuring in the Key Insights section on our website.
As a reminder - "initial target price" means exactly that - an "initial" one. It's not a price level at which we suggest closing positions. If this becomes the case (like it did in the previous trade), we will refer to these levels as levels of exit orders (exactly as we've done previously). Stop-loss levels, however, are naturally not "initial", but something that, in our opinion, might be entered as an order.
Since it is impossible to synchronize target prices and stop-loss levels for all the ETFs and ETNs with the main markets that we provide these levels for (gold, silver and mining stocks - the GDX ETF), the stop-loss levels and target prices for other ETNs and ETF (among other: UGL, GLL, AGQ, ZSL, NUGT, DUST, JNUG, JDST) are provided as supplementary, and not as "final". This means that if a stop-loss or a target level is reached for any of the "additional instruments" (GLL for instance), but not for the "main instrument" (gold in this case), we will view positions in both gold and GLL as still open and the stop-loss for GLL would have to be moved lower. On the other hand, if gold moves to a stop-loss level but GLL doesn't, then we will view both positions (in gold and GLL) as closed. In other words, since it's not possible to be 100% certain that each related instrument moves to a given level when the underlying instrument does, we can't provide levels that would be binding. The levels that we do provide are our best estimate of the levels that will correspond to the levels in the underlying assets, but it will be the underlying assets that one will need to focus on regarding the signs pointing to closing a given position or keeping it open. We might adjust the levels in the "additional instruments" without adjusting the levels in the "main instruments", which will simply mean that we have improved our estimation of these levels, not that we changed our outlook on the markets. We are already working on a tool that would update these levels daily for the most popular ETFs, ETNs and individual mining stocks.
Our preferred ways to invest in and to trade gold along with the reasoning can be found in the how to buy gold section. Furthermore, our preferred ETFs and ETNs can be found in our Gold & Silver ETF Ranking.
As a reminder, Gold & Silver Trading Alerts are posted before or on each trading day (we usually post them before the opening bell, but we don't promise doing that each day). If there's anything urgent, we will send you an additional small alert before posting the main one.
Thank you.
Przemyslaw Radomski, CFA
Founder, Editor-in-chief

